Nova A/B Testing

Are Your A/B Tests Actually Making You Money?

Amazon tells you which variant won. Nova tells you which variant is profitable. Connect your split tests to real P&L data across every SKU and marketplace.

Try for Free
Rated 4.9/5 · 14-day free trial
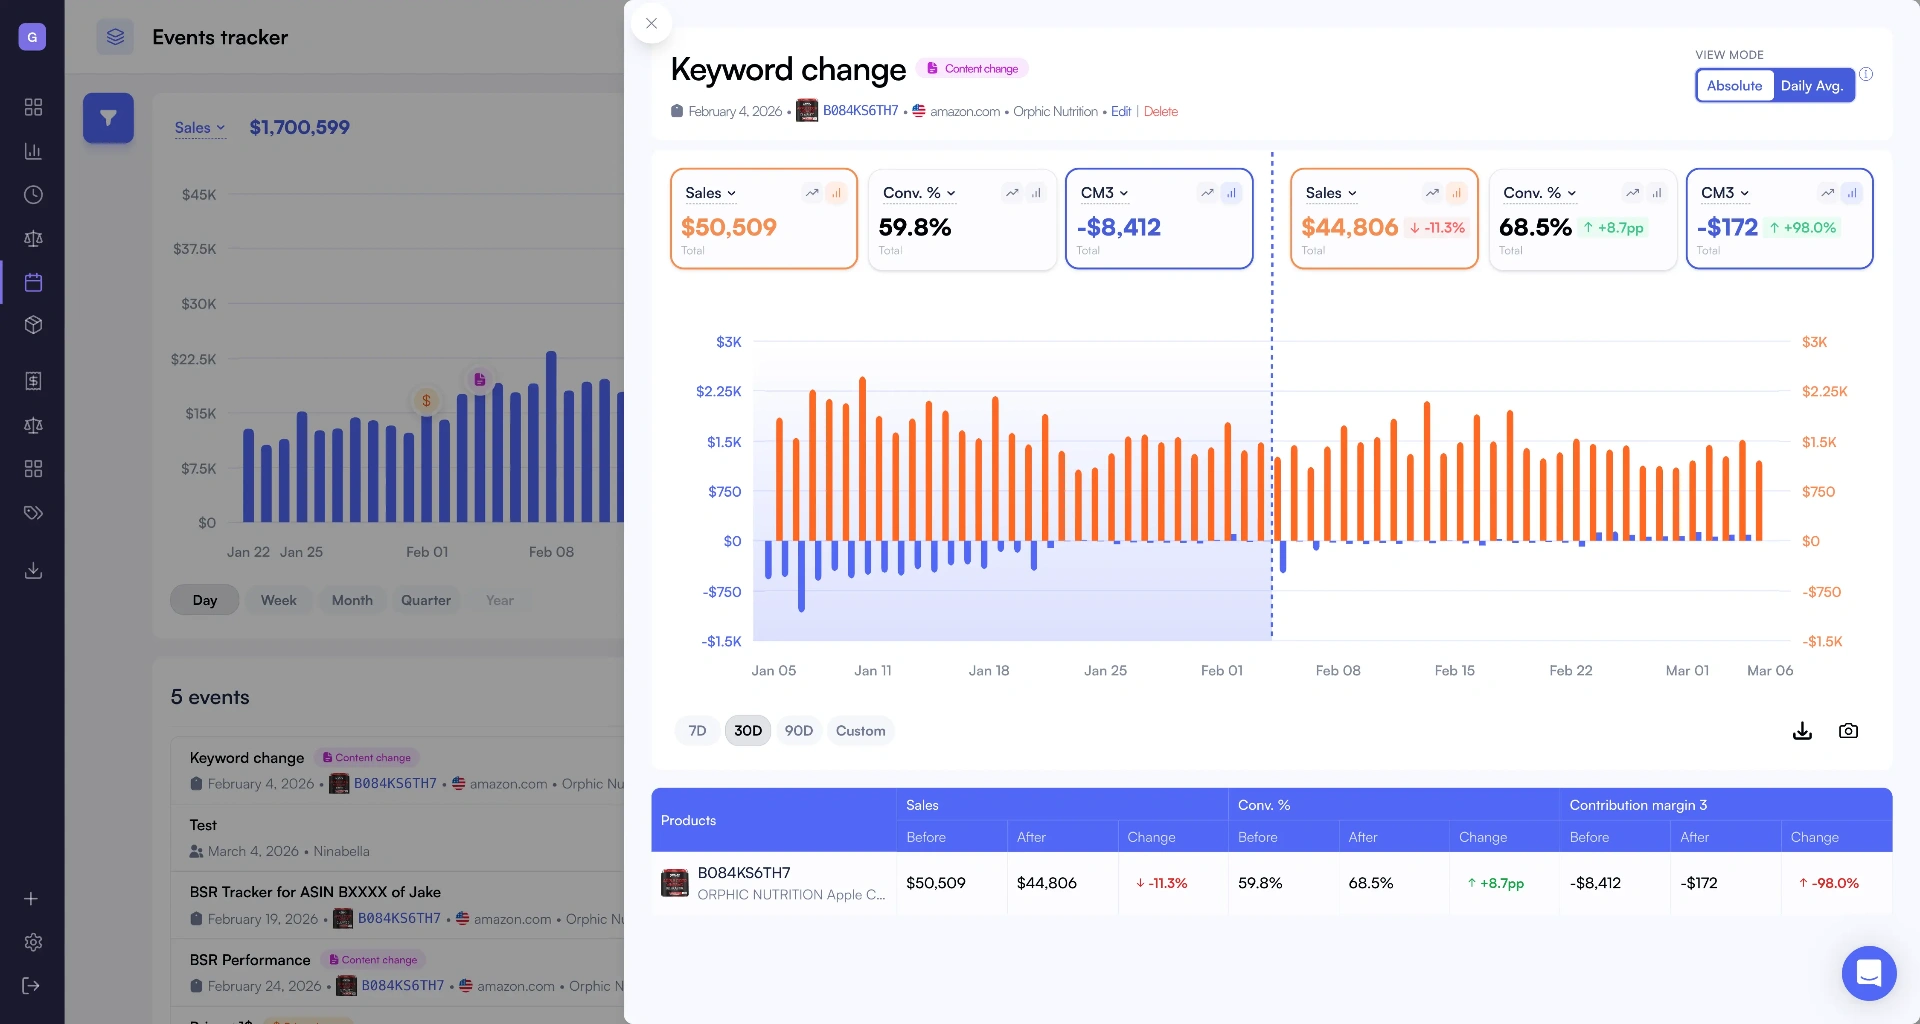
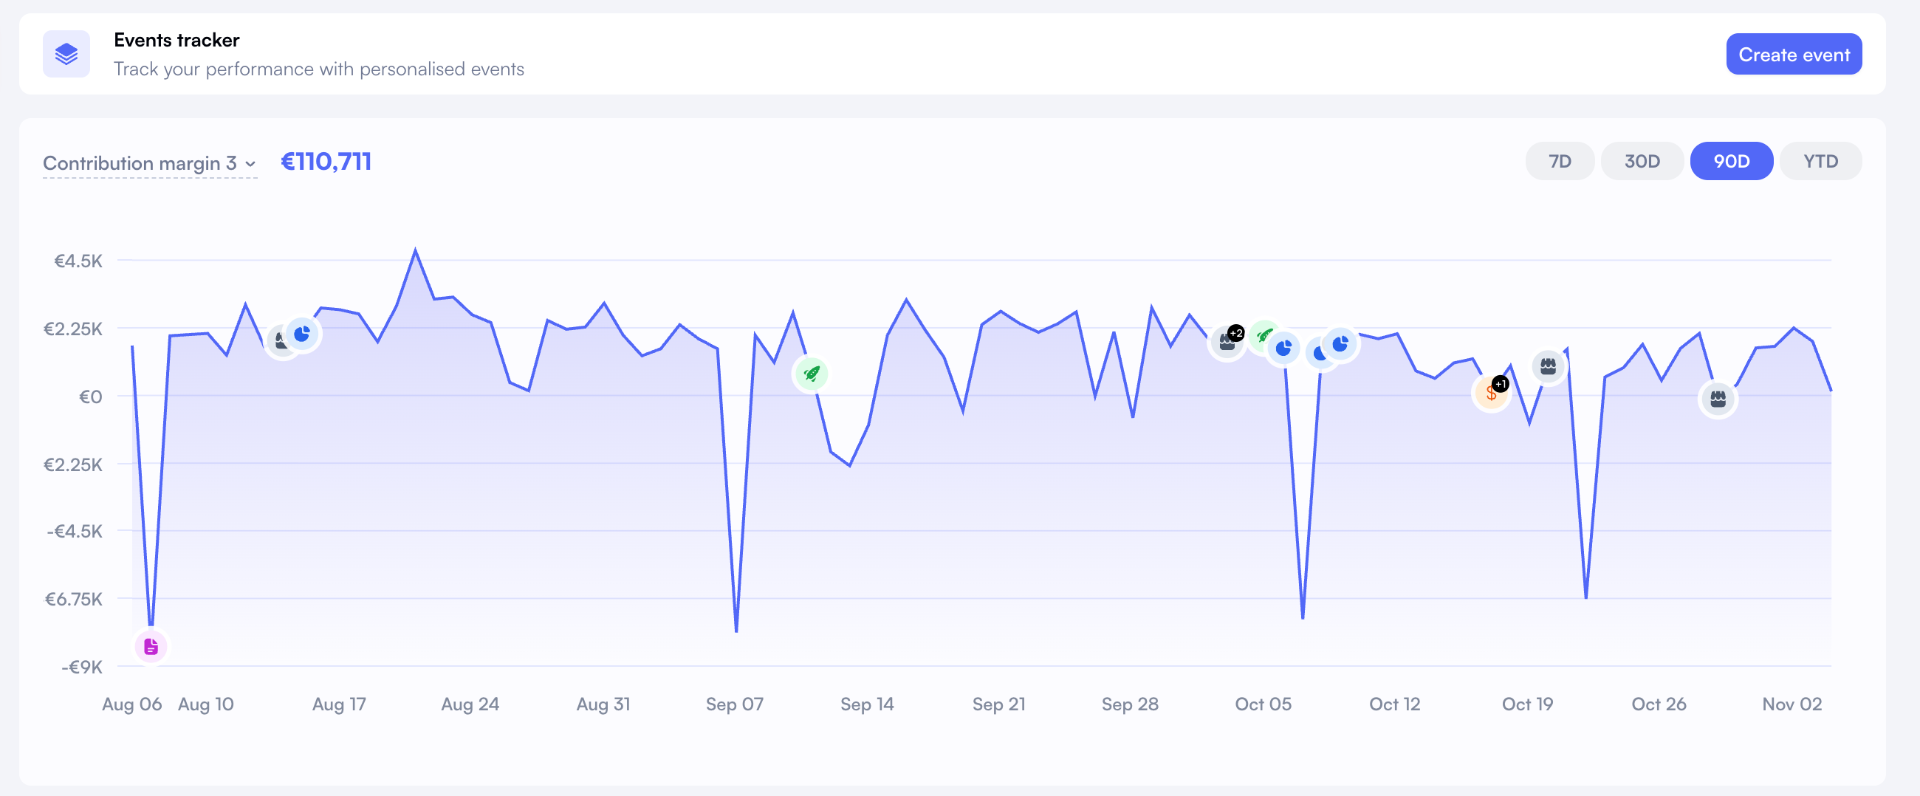
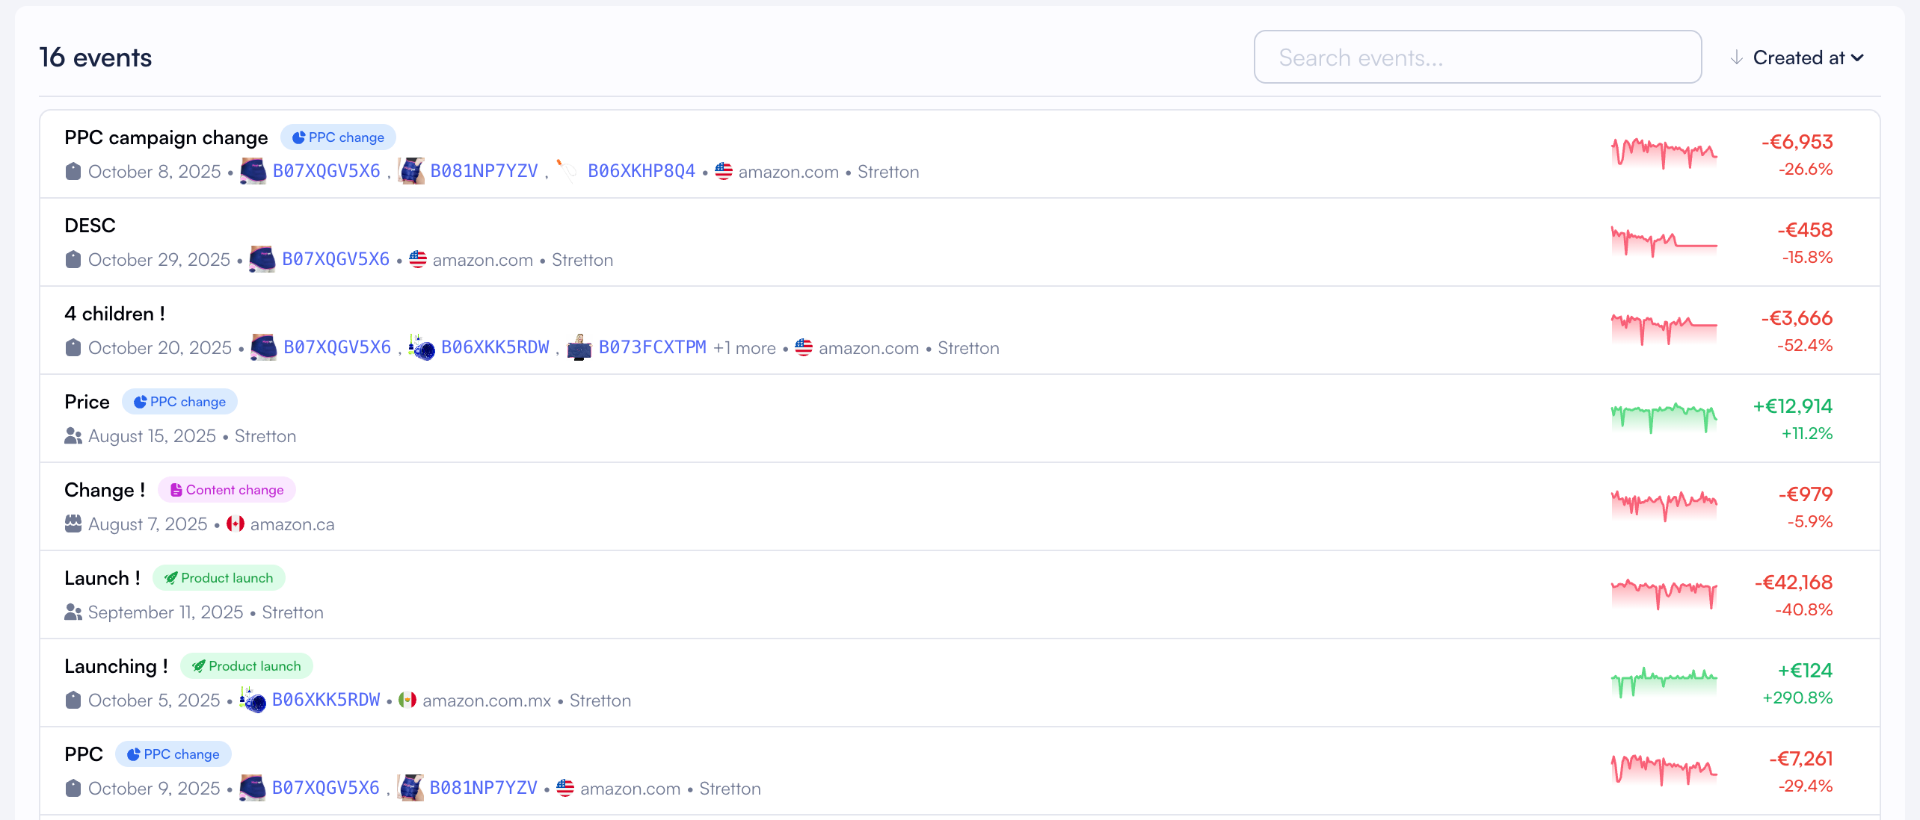
Nova Amazon A/B testing tracker dashboard showing split test variants with revenue and margin impact per experiment

The gap between "winning" and profitable

You're running Amazon experiments. Good. But the data you're getting back is incomplete. Here's what's missing.

01

Amazon Experiments shows conversions, not profit

Amazon Experiments tells you which variant won. It doesn't tell you if either variant is profitable. A 12% conversion lift means nothing if your margin on that product is negative after fees and ad spend.

02

You can't measure what you can't connect

You ran 6 tests last quarter. Can you tell which ones actually moved your bottom line? Without connecting test results to your P&L, you're optimizing for a metric that doesn't pay the bills.

03

Split testing without margin data is guessing

Your new main image increased sessions by 8%. But the product's return rate also jumped. Net impact on profit? You won't find that answer in Manage Your Experiments.

04

Winning variants can still lose money

Your test 'won' with 3% more sessions. But returns doubled and ad spend climbed to maintain rank. The variant Amazon called the winner cost you $2,400 last month.

See how Nova tracks your experiments

From test creation to profit impact. Four screens that turn Amazon experiments into business decisions.

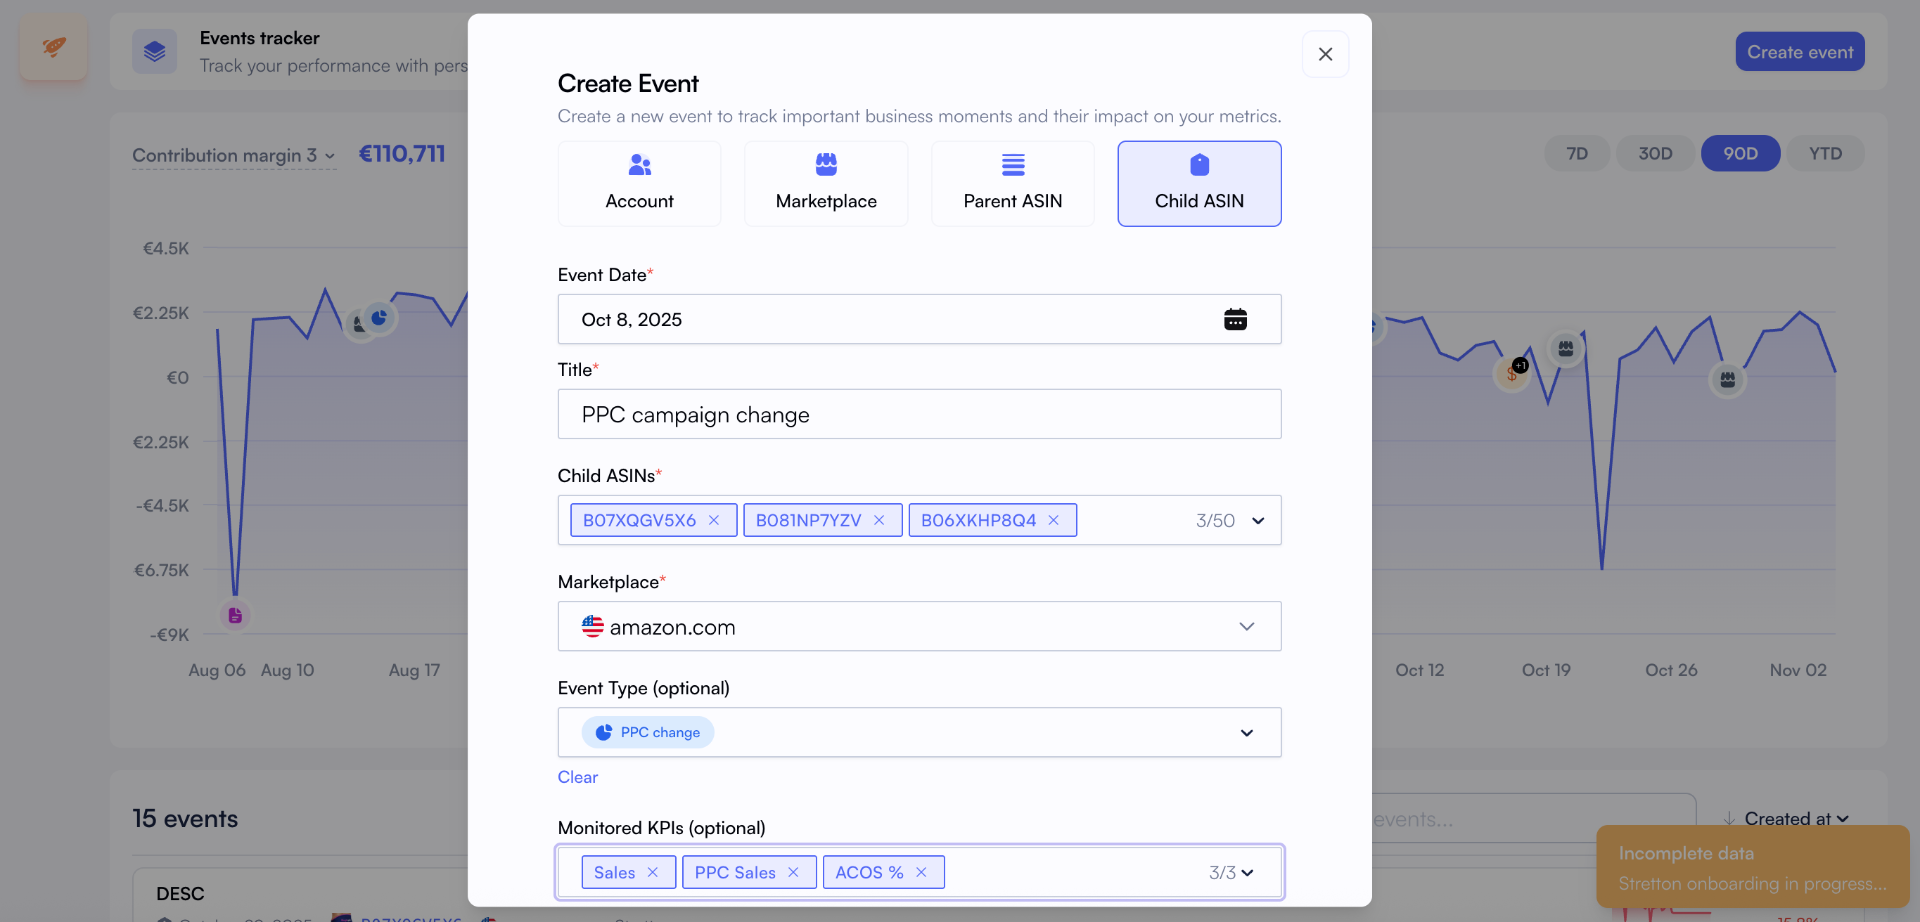
Nova A/B test creation screen with variant A and B setup
A/B test results showing variant A vs B with revenue and margin comparison
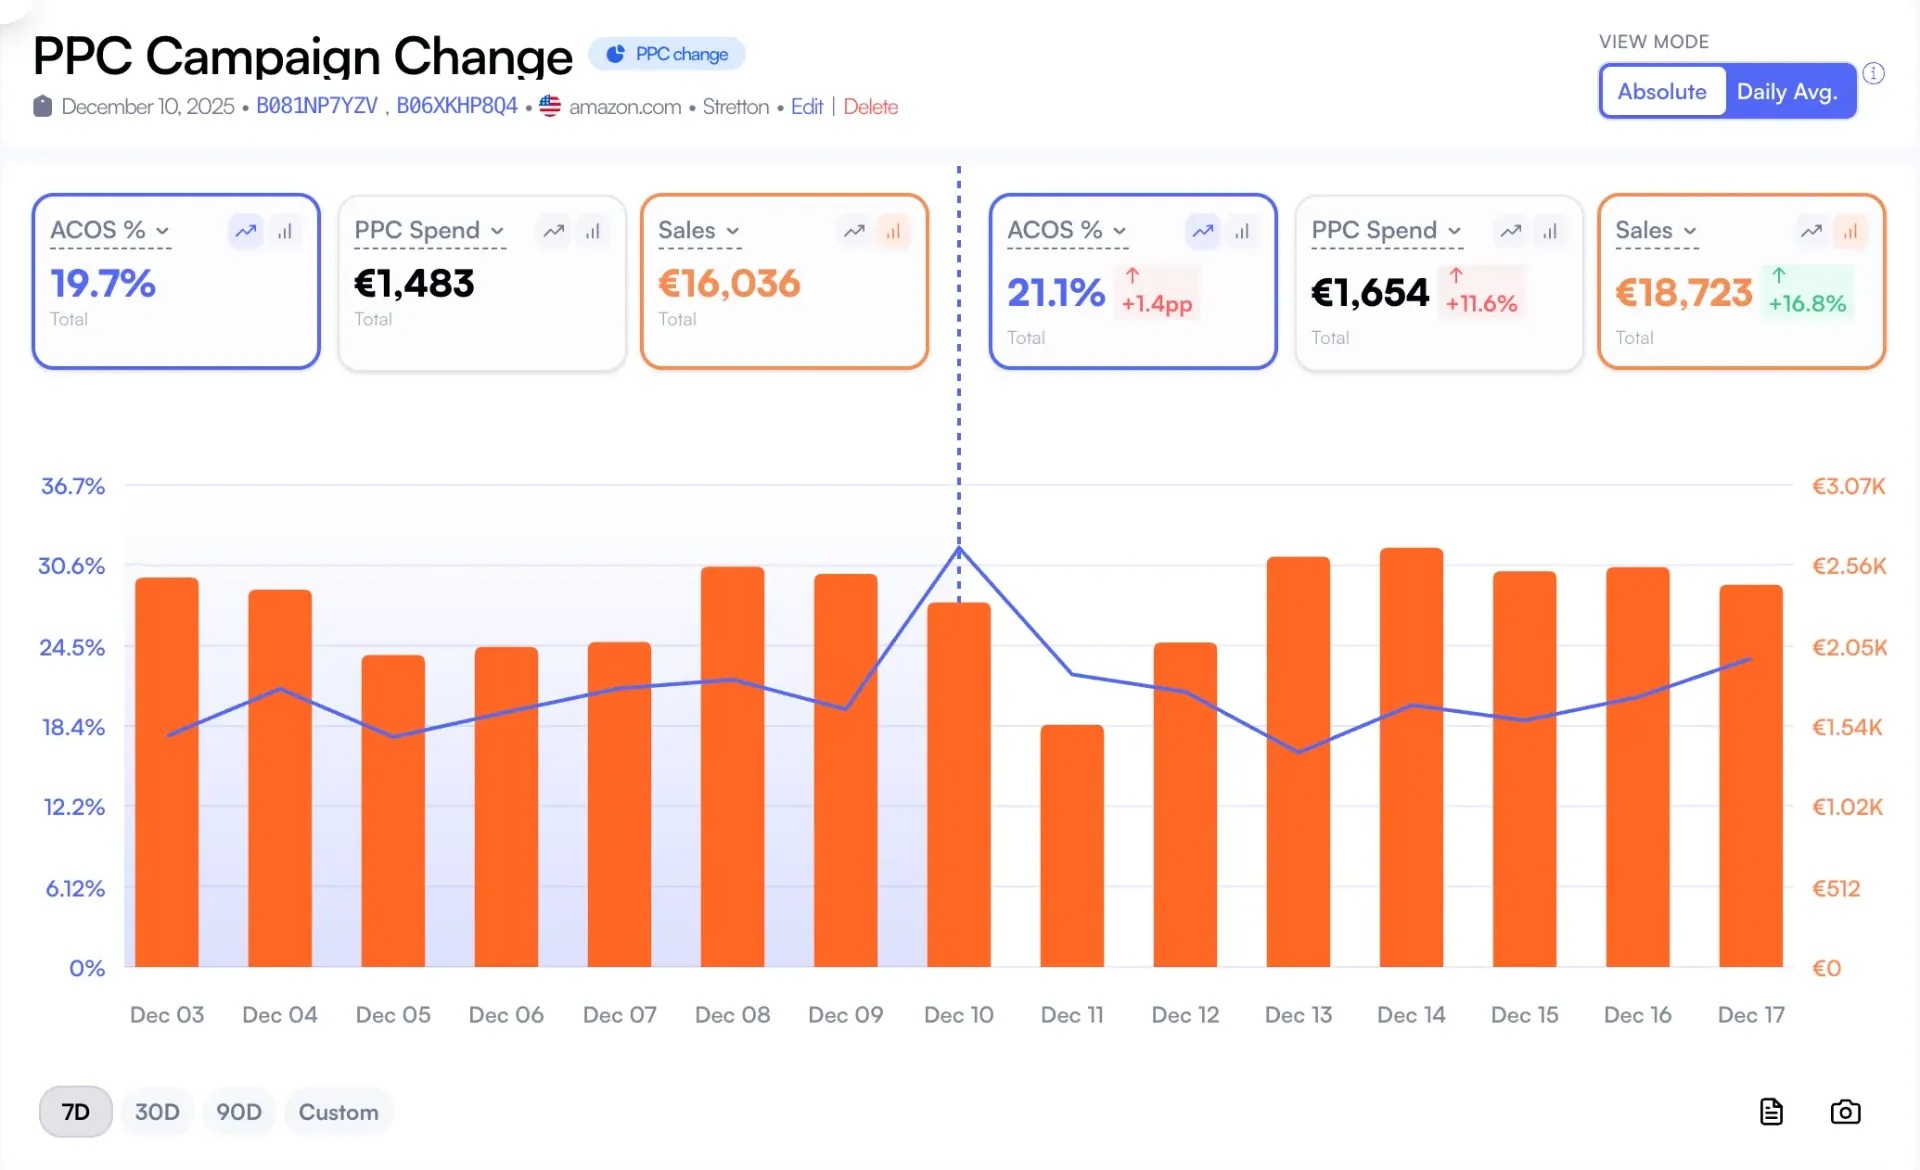
Nova before and after analysis showing profit impact of implemented A/B test winner

4

Screens Per Test

Create, monitor, analyze, and compare. Every experiment in one flow.

P&L

Connected to Profit

Test results linked to real margins, fees, and ad spend. Not just conversion rates.

21

Marketplaces

Track experiments across every Amazon region in a single view.

Nova vs Amazon Experiments vs spreadsheets

Three ways to track split tests. Only one connects results to your bottom line.

CapabilityAmazon ExperimentsSpreadsheetsNova
Conversion trackingManual
Revenue per variantManual calc✓ Automatic
Margin per variant✓ Connected to P&L
Fee impact analysis✓ 40+ fee types
Return rate by variantManual✓ Auto-tracked
BSR tracking during testManual✓ Daily history
Before/after P&L comparisonHours of work✓ One click
Multi-marketplace testsPer marketplaceSeparate sheets✓ Unified view
PPC spend per variantManual✓ Automatic
Historical test archiveLimitedIf maintained✓ Full history

How it works

Three steps from test setup to profit clarity. No spreadsheets. No guesswork.

1

Create Your Experiment

Set up your A/B test in Amazon's Manage Your Experiments. Then log it in Nova with your hypothesis and variant details. Takes 2 minutes.

2

Track Variant Performance

Nova monitors both variants in real time. Sales, revenue, margins, fees, returns, and BSR all tracked automatically alongside your existing P&L data.

3

See the Profit Impact

When the test ends, compare variants on profit, not just conversions. See the before/after margin impact and make decisions backed by real financial data.

Two teams. One testing blind spot.

Whether you're optimizing listings or managing ad spend, you need to know what tests do to your margins.

Listing Optimization Teams

You test images, titles, and A+ content weekly

  • See which image variant drives more revenue per session, not just more sessions
  • Track how title changes affect BSR, margins, and return rates simultaneously
  • Compare A+ content variants on actual profit contribution, not conversion rate alone
  • Archive every test with financial results so you build institutional knowledge
For brand managers →

Performance Marketing Teams

You need to know how listing changes affect ad ROI

  • Track how main image tests impact PPC conversion rates and ACoS
  • Measure whether a title change improved organic rank enough to reduce ad dependency
  • Connect A/B test outcomes to TACoS trends across your entire ad portfolio
  • Spot when a 'winning' variant increases returns and erases your ad spend savings
For FBA sellers →

Connect A/B testing to your full analytics stack. See our Profit Tracker, Sales Tracker, Performance Tracker, and Seller Dashboard.

What is Amazon A/B testing?

Amazon A/B testing (officially called Manage Your Experiments) is a built-in tool that lets brand-registered sellers test different versions of listing elements against each other. You can test main images, titles, bullet points, A+ content, and product descriptions. Amazon splits traffic between two variants and tracks which one converts better.

The limitation? Amazon only measures conversion rate. It doesn't account for margins, fees, return rates, or ad spend. A variant that converts 5% better but attracts more returns or requires higher PPC bids can actually lose you money. That's the gap between "winning" an A/B test and profiting from one.

Nova's A/B testing tracker bridges this gap by connecting your experiments to your P&L dashboard. Every test gets tracked with full financial context: revenue per variant, margin per variant, fee differences, return rate changes, and BSR movement. You make listing decisions based on profit impact, not just conversion signals.

Smart sellers combine A/B testing data with PPC analytics and revenue tracking to build a complete picture. When you know exactly how each listing change affects your bottom line, you stop guessing and start compounding gains across your catalog.

Why Sellers Choose Nova for A/B Test Tracking

"We used to celebrate conversion lifts from image tests. Then we connected Nova and realized two of our 'winning' variants had higher return rates. Net margin was actually worse."

Listing Optimization Lead

120 SKUs, US and EU marketplaces

"Being able to see the before/after P&L impact of each test changed how our team prioritizes experiments. We focus on margin-moving tests now, not vanity metrics."

E-commerce Director

Agency managing 40+ brands

Simple, transparent pricing

Start free. Scale when you're ready.

14-day free trial • No credit card required • Cancel anytime

Sellers & Brand Owners

Full analytics. All marketplaces.

Starting at$29/month
Start 14-day free trial
  • Profit & loss analytics
  • PPC Analytics
  • Custom breakdowns
  • Buy Box %
  • BSR Tracker
  • Returns Analytics
  • Consolidated Data Exports
  • Priority support
Enterprise & Agency

Unlimited accounts. Dedicated support.

Custom
  • Unlimited orders
  • Unlimited accounts
  • Unlimited team seats
  • Advanced User Management System
  • Client-first view
  • Dedicated account manager
  • Custom data exports
  • SLA guarantees

Amazon A/B Testing: Frequently Asked Questions

Everything you need to know about tracking Amazon split tests with profit data.

Amazon A/B testing (also called split testing or Manage Your Experiments) lets you test two versions of a listing element, like a title, image, or A+ content, against each other. Amazon splits traffic between variants and measures which one gets more conversions. Nova adds profit tracking on top, so you see which variant actually makes more money, not just more clicks.
Amazon Experiments tells you which variant got more conversions. Nova connects that data to your P&L, so you can see the revenue, margin, and profit impact of each variant. You also get before/after comparisons, BSR tracking during tests, and the ability to track tests across multiple marketplaces from one dashboard.
Yes. Nova supports 21 Amazon marketplaces. You can run and track split tests across US, UK, Germany, and every other Amazon region from one unified dashboard. Compare variant performance across markets side by side.
Amazon currently supports A/B testing on main images, titles, bullet points, A+ content, and product descriptions. Nova tracks all of these test types and connects results to your sales, revenue, and margin data automatically.
Amazon recommends a minimum of 4 weeks for statistical significance. Running tests for less time risks making decisions on noisy data. Nova tracks the full duration and flags when results reach confidence thresholds, so you don't cut tests short.
No. You create and manage experiments in Seller Central using Amazon's Manage Your Experiments tool. Nova tracks the financial impact of your tests by connecting experiment data to your P&L, showing you which variants drive profit, not just conversions.
Nova starts at $29 per month with annual billing and includes a 14-day free trial. A/B test tracking is included in all plans alongside P&L analytics, PPC tracking, and custom breakdowns. No credit card required to start.

Stop Guessing Which Variant Wins. Start Measuring Which One Profits.

Connect your Amazon experiments to real P&L data. See the profit impact of every split test across your catalog.

Try for Free