NovaClaudeMCP

Nova MCP for Claude goes live in

--Days
--Hrs
--Min
--Sec

Amazon BSR Tracker

Track Best Sellers Rank at ASIN level. See how your products trend against the marketplace.

Try for Free
Rated 4.9/5 · 14-day free trial
Nova BSR Performance dashboard showing main and subcategory Best Sellers Rank with absolute and daily average views, trend chart, and before/after comparison table

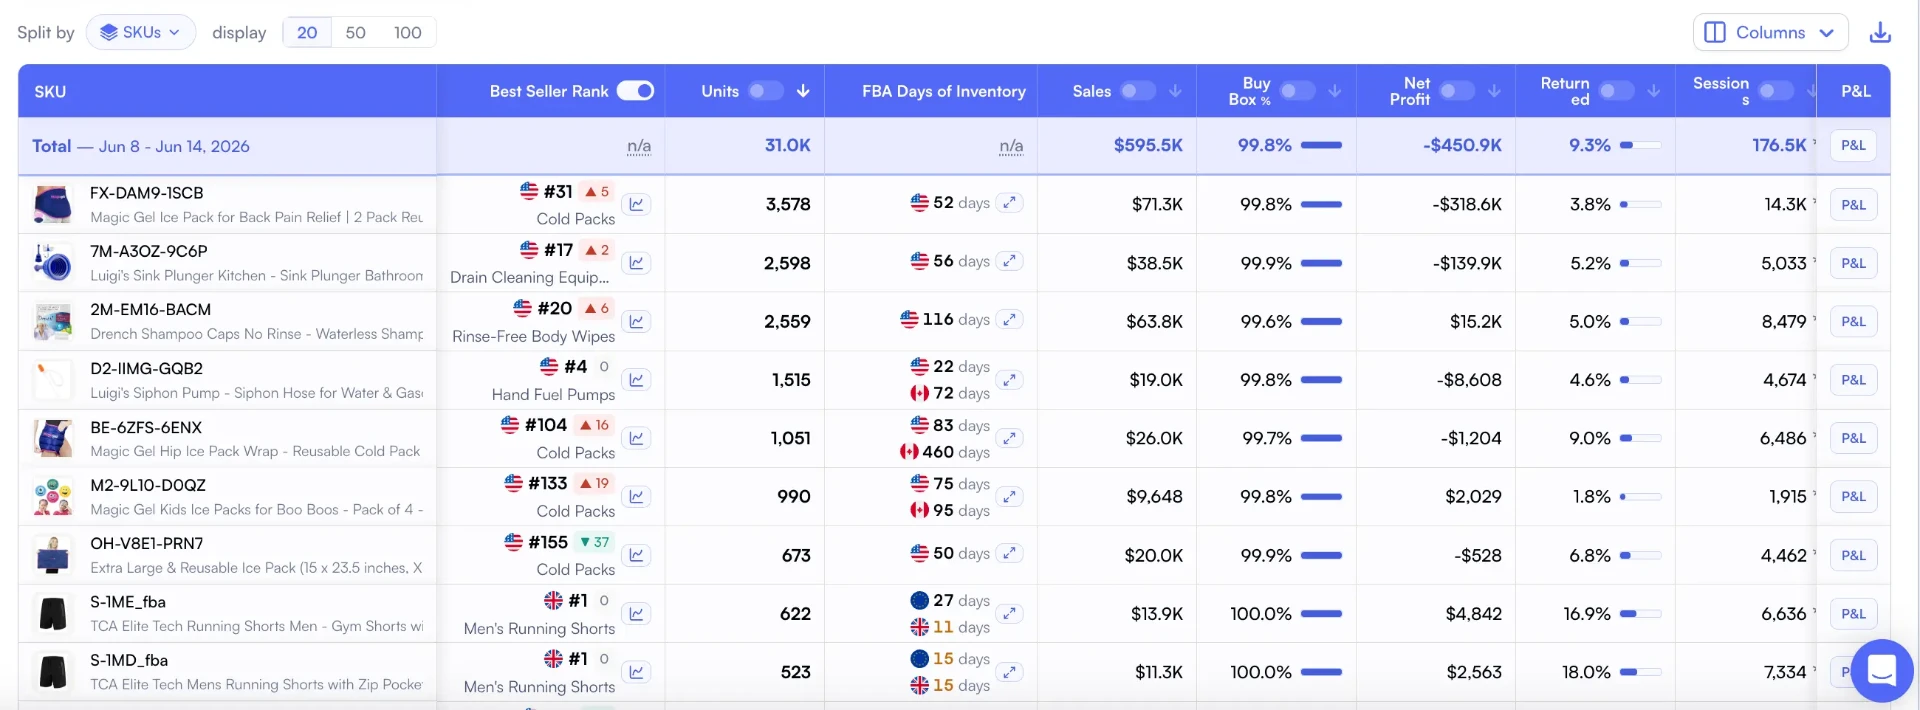
Track BSR at the SKU level, next to your P&L

Best Seller Rank lives inside the SKU table, alongside Units, Sales, Buy Box %, Net Profit, and Amazon Fees for the same period. Sort by rank and read profit signal in the same row, then open the per-SKU P&L for a deeper view.

Nova SKU-level table with Best Seller Rank column showing rank, period variation, and category label for each SKU, next to Units, Sales, Buy Box %, Net Profit, Amazon Fees, and a per-SKU P&L button

Why BSR matters

Revenue and units only tell you what happened inside your account. BSR shows how you perform against the rest of the marketplace, so you know whether a sales bump is real share gain or just category lift.

  • Market context. Revenue and units don't tell you if you're winning or losing share. BSR does.
  • Competitive edge. Track how campaigns, price changes, and inventory affect your position vs. competitors.
  • Real performance. A sales spike means nothing if the whole category grew. BSR shows true relative gains.

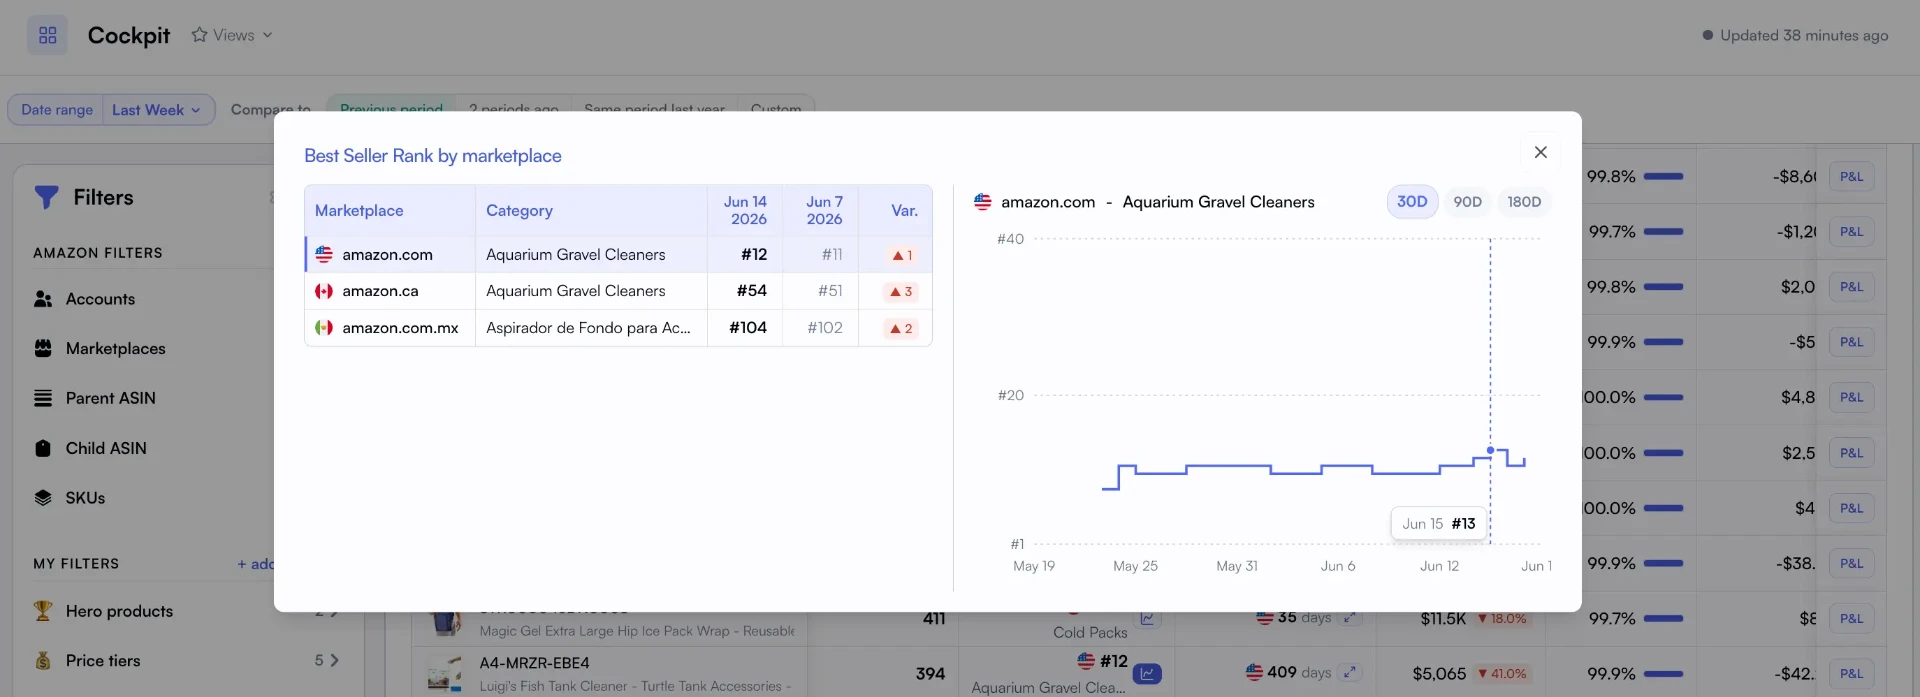
BSR across all 21 Amazon marketplaces

Open any SKU and see Best Seller Rank side by side across every Amazon marketplace where it's live, with latest rank, prior-period average, variation, and the local category label.

Nova Best Seller Rank by Marketplace modal showing rank, prior-period average, and variation per Amazon marketplace where the ASIN is live

Trends over time

See how your ASIN trends day to day and correlate BSR changes with ads, price moves, and inventory shifts.

Nova Cockpit chart titled Best Seller Rank by day, showing daily BSR for 3 child ASINs on amazon.com over a 7-day range with 30D, 90D, YTD, L12M ranges and D/W/M/Q/Y granularity controls

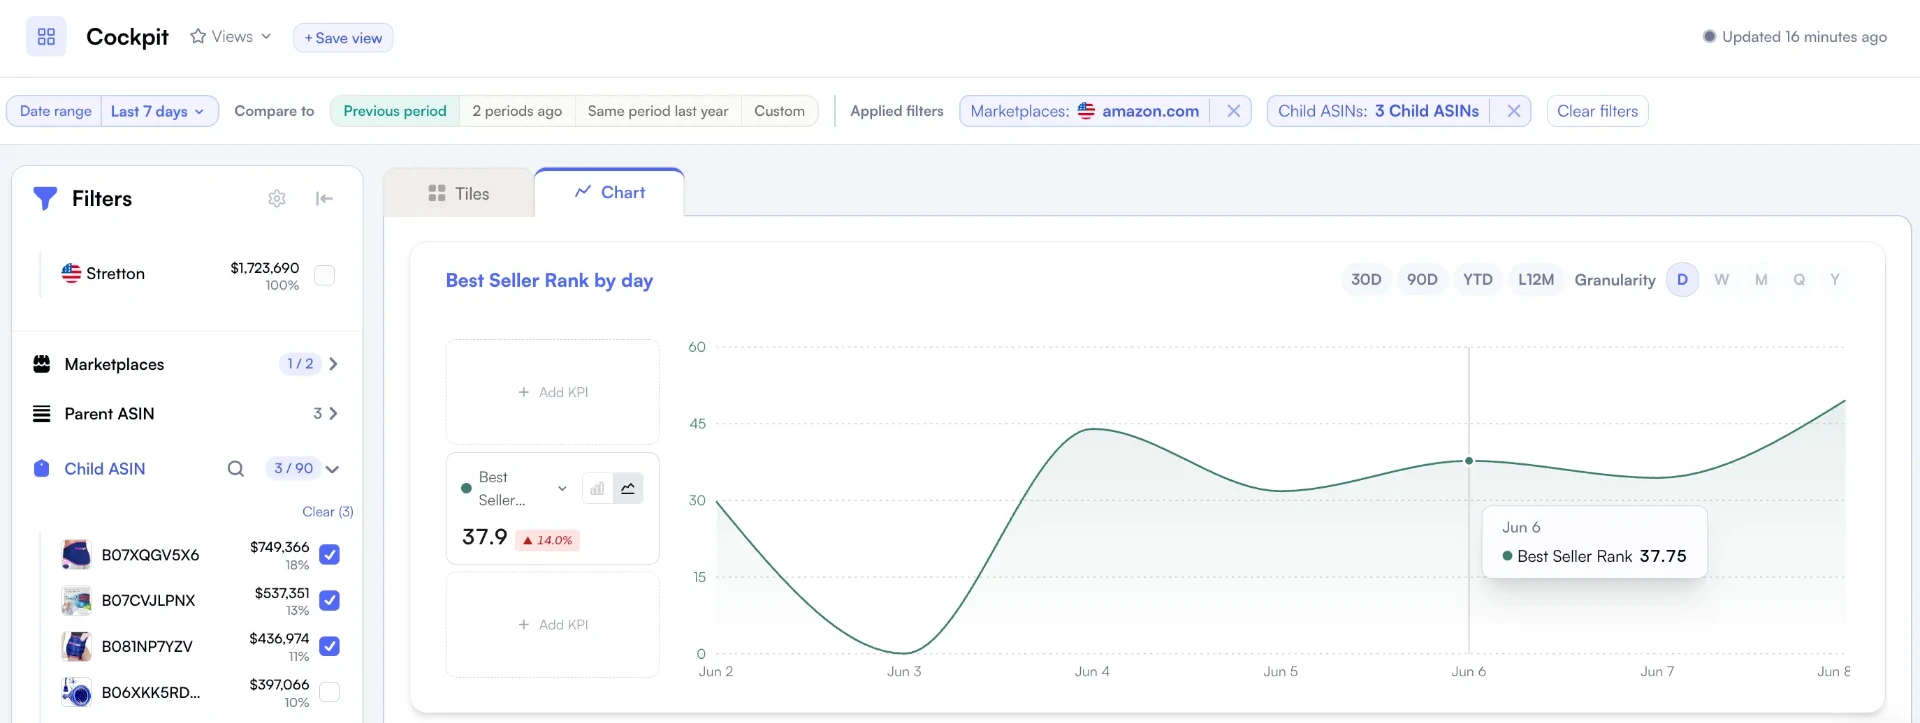
Track BSR by day, week, month, quarter, or year from inside the Seller Cockpit.

  • Historical trends

    Visualize BSR movements over 7D, 30D, 90D, or custom periods.

  • Campaign impact

    Identify what actions moved your ranking: ads, pricing, inventory.

  • Seasonality patterns

    Spot seasonal BSR fluctuations and plan inventory accordingly.

  • Competitive benchmarking

    Compare your BSR trajectory against category leaders to gauge true market share gains.

Amazon BSR tracking FAQ

Common questions about Best Sellers Rank and how to track it

Best Sellers Rank is Amazon's hourly-updated ranking of how a product sells inside its category, where rank #1 is the top seller. It is the closest public proxy for sales velocity and is shown for both main and subcategories. Lower BSR usually means more sales, but the relationship is non-linear and varies sharply by category.
Amazon refreshes BSR roughly every hour for active products, with full daily recalculations. Nova captures these snapshots so you can see intraday and day-over-day shifts, including the impact of promotions, ad campaigns, and competitor moves.
Yes. Nova tracks BSR per marketplace across all 21 Amazon marketplaces it covers. Open any SKU and the per-marketplace breakdown shows latest rank, prior-period average, and variation for each marketplace where the ASIN is live, with the local category label.
Yes. The SKU table puts Best Seller Rank next to Units, Sales, Buy Box %, Net Profit, Amazon Fees, and P&L for the same period. You can sort by any column, filter by marketplace or parent ASIN, and open a SKU to see how rank moves track with margin.
Connect your Seller Central or product list to Nova and the BSR tracker automatically monitors main category and subcategory ranks for every ASIN. You get historical trends, before/after views around campaigns or price changes, and side-by-side benchmarks against competitor ASINs you choose to follow.
Yes. Add competitor ASINs to your Nova workspace and the BSR tracker pulls the same hourly rank history Amazon shows publicly. You can compare rank trajectory, share-of-category shifts, and how your launches or price changes move you against named competitors.
Yes within the same category, but BSR is not comparable across categories. A BSR of 5,000 in Books represents very different sales velocity than 5,000 in Toys. Nova normalizes rank inside each category so trend comparisons stay meaningful.
BSR is a relative ranking, not an absolute units-sold figure. Top ranks (under 1,000) typically represent dozens to hundreds of daily sales depending on the category, while ranks past 100,000 usually represent only a handful per week. Pair Nova BSR data with your own units-sold data to calibrate the curve for each category you sell in.
Yes. Nova covers 21 Amazon marketplaces and tracks BSR per marketplace, so you can monitor the same ASIN's rank in the US, UK, Germany, Japan, and elsewhere from a single dashboard.
Use Nova's before/after views to confirm whether PPC pushes, deals, coupons, or main-image tests actually move rank, and to spot sustained gains versus short spikes. Combine rank trends with your profit data so you only double down on actions that improve both BSR and margin.

Simple, transparent pricing

Start free. Scale when you're ready.

14-day free trial • No credit card required • Cancel anytime

Sellers & Brand Owners

Full analytics. All marketplaces.

Starting at$29/month
Start 14-day free trial
  • Profit & loss analytics
  • PPC Analytics
  • Custom breakdowns
  • Buy Box %
  • BSR Tracker
  • Returns Analytics
  • Consolidated Data Exports
  • Priority support
Enterprise & Agency

Unlimited accounts. Dedicated support.

Custom
  • Unlimited orders
  • Unlimited accounts
  • Unlimited team seats
  • Advanced User Management System
  • Client-first view
  • Dedicated account manager
  • Custom data exports
  • SLA guarantees