
Amazon BSR Guide 2026: Track Best Sellers Rank by ASIN
Your internal sales metrics only tell half the story. BSR reveals how you perform against the entire marketplace. Learn how to find, track, and estimate sales from Best Sellers Rank.
What is BSR on Amazon?
Amazon Best Sellers Rank (BSR) is a numerical ranking that shows how well a product sells compared to others in its category. A BSR of #1 means the best-selling product. BSR updates hourly based on recent sales velocity, making it a real-time indicator of competitive position. Every product has both a main category BSR and subcategory BSR.
Latest updates
Refreshed June 2026
- Nova's BSR tracker now ships three new views: a BSR-by-day chart in the Seller Cockpit, BSR inside the SKU table next to Units, Sales, and Net Profit, and a per-marketplace breakdown across the 21 Amazon marketplaces Nova covers.
- Q2 2026 category velocity has tightened the BSR-to-sales bands in Home, Beauty, and Tools as sub-category competition picked up.
- BSR rarely moves alone, so it lands in the wider Amazon FBA analytics view where rank shifts reconcile with units, sessions, and contribution margin in one place.
Your internal sales metrics only tell half the story. Revenue grew 15% last month. Great, right? Maybe. Maybe not. If the entire category grew 30%, you actually lost ground. Best Sellers Rank (BSR) reveals what internal metrics can't: how you perform against the entire marketplace.
Industry research shows that over 70% of Amazon sellers consider BSR one of their top five performance indicators. Yet most track it manually, checking once a day (or week) and missing the patterns that actually matter.
This guide covers everything you need to know about tracking BSR at the ASIN level: where to find BSR on product pages, how to estimate sales from BSR, why manual tracking fails, and what actions to take when your ranking shifts.
Nova's BSR Tracker tracks main and subcategory BSR at ASIN level with historical trends.
Where to find BSR on Amazon
Finding BSR on an Amazon product page is straightforward once you know where to look. Here's the step-by-step process:
How to Find BSR on Any Product Page
- 1.Go to any Amazon product page (your own or a competitor's)
- 2.Scroll down to "Product details" section (below the bullet points and images)
- 3.Look for "Best Sellers Rank" which shows both main category and subcategory rankings
- 4.Click the category name to see top 100 products in that category
Why BSR Sometimes Doesn't Appear
New products may not show BSR until they have sales history (typically 24-48 hours after first sale). Products with very low sales velocity in huge categories may also display "No rank" temporarily. If your BSR disappeared, check if you had a stockout. BSR recalculates once sales resume.
On mobile, BSR appears in the same "Product details" section. The format is identical: main category rank first, then subcategory ranks listed below. Both are clickable links to the Best Sellers page for that category.
For tracking your own products at scale, Nova's BSR Tracker pulls BSR data automatically for all your ASINs. No manual page visits required.
How Nova tracks BSR across SKUs, marketplaces, and time
Nova ships three views that turn raw rank data into decisions: a BSR-by-day chart in the Seller Cockpit, BSR inside the SKU table next to your P&L, and a per-marketplace breakdown for every ASIN.
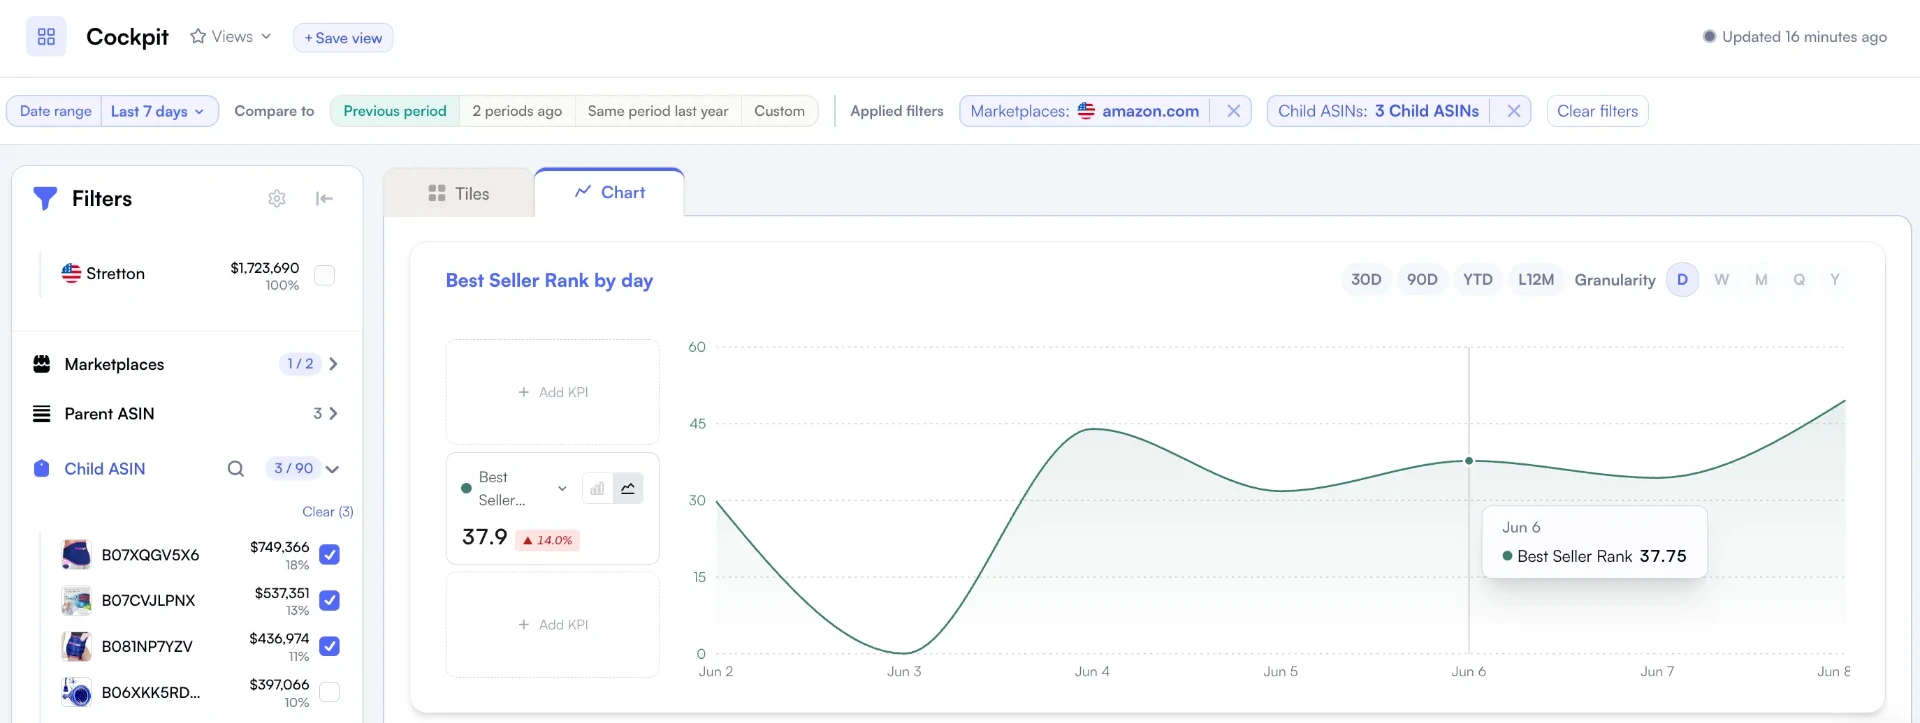
BSR by day in the Cockpit, with 30D / 90D / YTD / L12M ranges and D/W/M/Q/Y granularity. Filter to specific child ASINs and compare against any prior period.
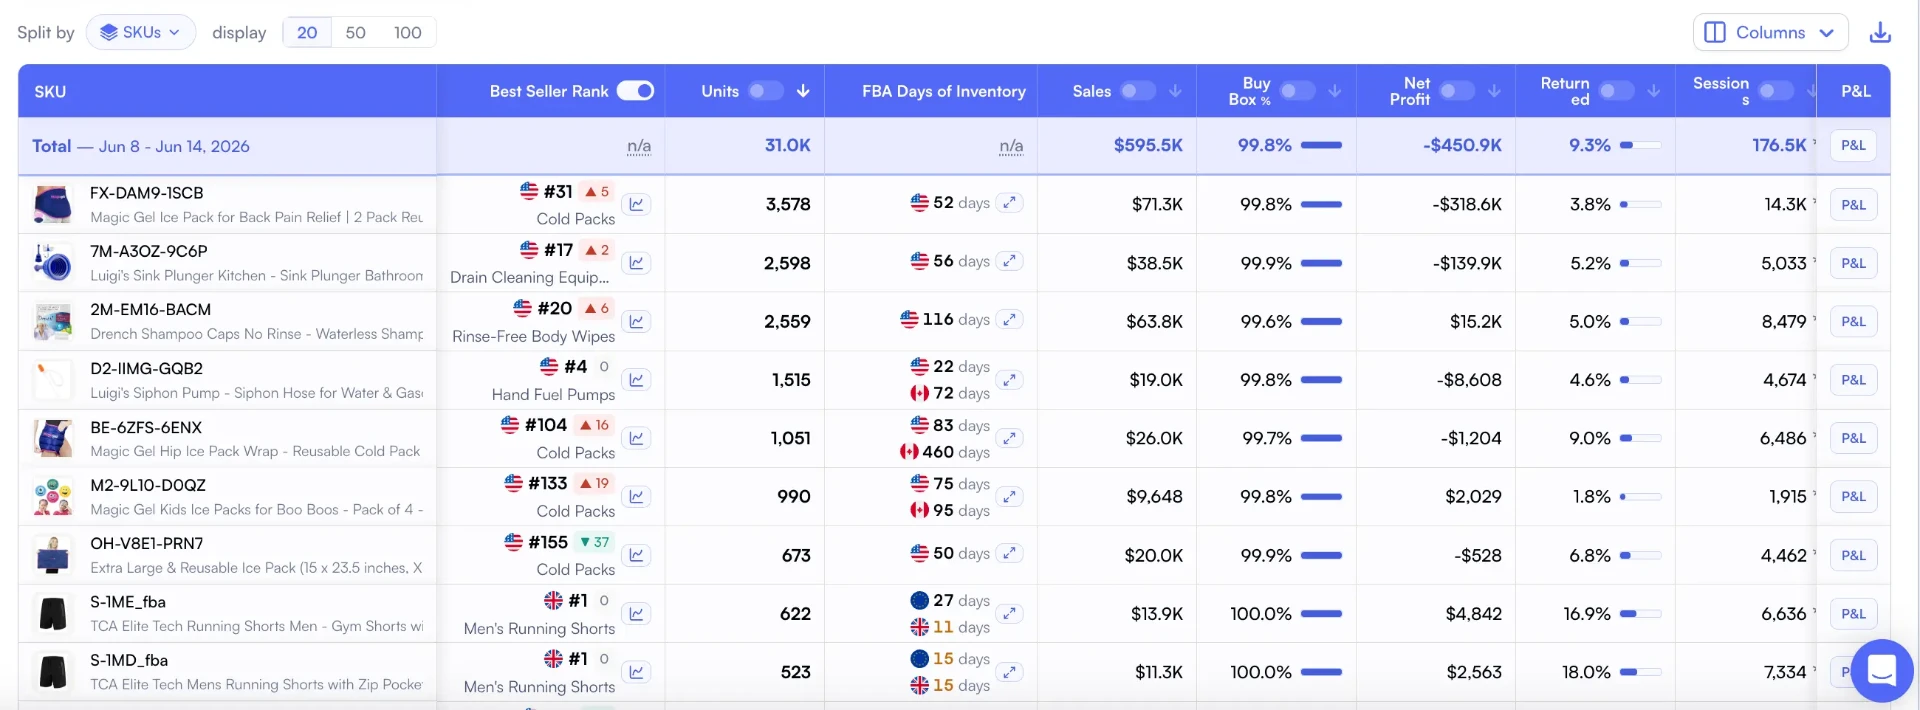
BSR at the SKU level, sorted alongside Units, Sales, Buy Box %, Net Profit, and Amazon Fees so you read rank moves in profit context, not in isolation.
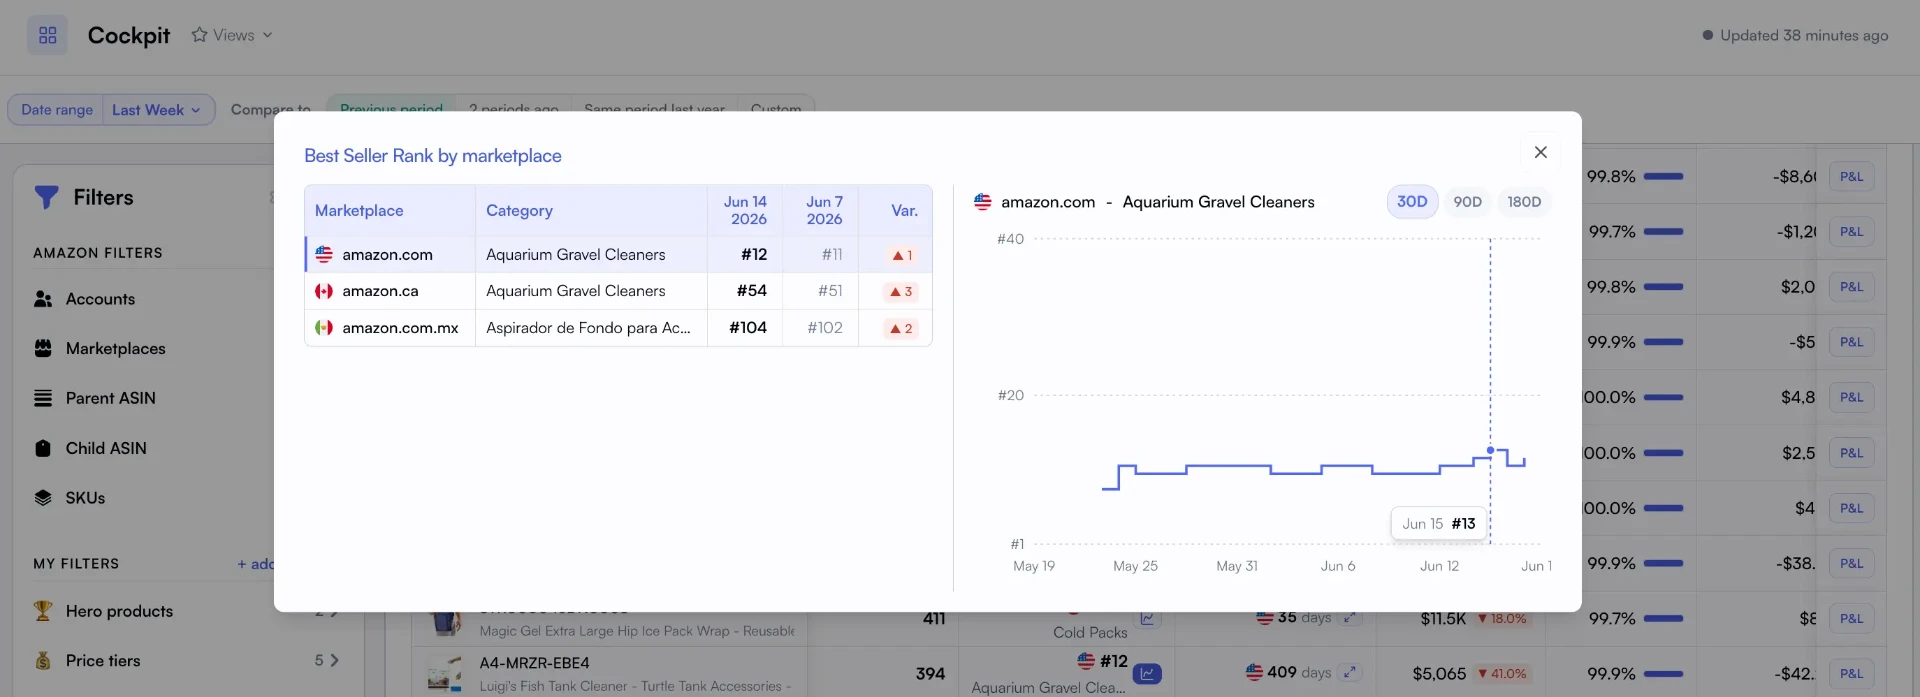
Per-marketplace BSR breakdown across the 21 Amazon marketplaces Nova covers, with latest rank, prior-period average, variation, and the local category label.
See all three live on the BSR tracker feature page.
BSR to sales estimation: What does BSR 50,000 mean?
One of the most common questions sellers ask is: "How many sales does a BSR of 50,000 mean?" The answer varies dramatically by category size. Here's a rough estimation framework.
| BSR Range | Electronics (Huge) | Home & Kitchen (Large) | Sports Outdoors (Medium) |
|---|---|---|---|
| BSR 1-100 | 500-5,000+ sales/day | 200-2,000+ sales/day | 100-500+ sales/day |
| BSR 1,000-5,000 | 50-200 sales/day | 20-100 sales/day | 10-50 sales/day |
| BSR 10,000-50,000 | 5-30 sales/day | 2-15 sales/day | 1-5 sales/day |
| BSR 50,000-100,000 | 1-5 sales/day | 0.5-2 sales/day | 0.2-1 sales/day |
| BSR 100,000+ | <1 sale/day | <0.5 sales/day | <0.2 sales/day |
Important: BSR-to-Sales Estimates Are Rough
These estimates are approximations. BSR fluctuates hourly, category sizes vary, and seasonal patterns affect the relationship. A BSR of 50,000 in Electronics during Q4 means more sales than BSR 50,000 in February. Use these ranges for ballpark planning, not precise forecasting. For accurate sales tracking, use your actual P&L data.
BSR 50,000 in Electronics
~3-10
Estimated sales per day
BSR 50,000 in Home & Kitchen
~1-5
Estimated sales per day
BSR 50,000 Monthly
~60-300
Estimated units/month (varies)
The key insight: category size matters more than the BSR number itself. A BSR of 50,000 in Electronics might mean 5+ sales per day. The same BSR in a small subcategory might mean zero sales this week. Always interpret BSR relative to category context. Learn more about competitive positioning in our product research guide.
What is Amazon Best Sellers Rank (BSR)?
Best Sellers Rank is Amazon's way of ranking every product by sales velocity within its category. A product with BSR #1 in a category sells more (recently) than any other product in that category. BSR #50,000 means 49,999 products outsold yours in recent sales.
How Amazon Calculates BSR
Amazon uses a weighted algorithm that favors recent sales over historical volume. The exact formula is proprietary, but we know it includes:
- Recent sales velocity: Sales in the last 1-2 hours carry more weight than yesterday's sales
- Historical performance: Long-term patterns smooth out short-term spikes
- Category-specific comparison: your rank is relative to other products in the same category
Update Frequency
Hourly
BSR refreshes every 1-2 hours based on recent sales
Ranking Scope
Category
Each product ranks within its assigned categories
Visibility
Public
BSR appears on every Amazon product page
Key insight: BSR is relative, not absolute. A BSR of #500 in "Electronics" (millions of products) is extremely good. A BSR of #500 in "Office Chair Cushions" (thousands of products) is merely average. Context matters. According to Amazon Seller Central documentation, BSR should always be interpreted within its category context.
Why BSR matters more than internal metrics
Internal metrics create a closed loop. You see your revenue, your units, your profit. All useful. But you're missing the market. Did your 10% sales increase happen because you improved, or because Prime Day lifted everyone? BSR answers that question.
Internal Metrics (What You See)
- •Revenue: Up 12% this month
- •Units: 847 sold (new record)
- •Profit margin: Stable at 22%
- •Conclusion: Business is growing
BSR (Market Reality)
- •BSR dropped from #180 to #340
- •Category grew 28% overall
- •3 new competitors entered top 50
- •Reality: You're losing market share
The Hidden Danger of Internal-Only Tracking
Revenue can grow while market share shrinks. This is the most dangerous blind spot for Amazon sellers. You feel successful while competitors quietly capture your future customers. By the time internal metrics show decline, you've already lost 6-12 months of positioning. BSR is your early warning system.
Research on competitive strategy confirms that relative market position is a stronger predictor of long-term success than absolute growth. Companies focused on market share outperform those focused purely on revenue growth. BSR is your market share proxy on Amazon.
Two levels of category ranking
Every Amazon product has at least two BSR rankings: one for the main category and one (or more) for subcategories. Understanding both reveals different strategic insights about your market position.
Main Category BSR
Your overall ranking across the broadest category. This is your high-volume benchmark showing position against thousands of products.
- Brand visibility indicator
- Cross-niche comparison
- Marketplace-wide context
Subcategory BSR
Your ranking within your specific niche. This targeted view reveals how you compete against direct alternatives.
- Direct competitor insight
- Niche dominance tracking
- Category-specific trends
| Metric | Main Category BSR | Subcategory BSR |
|---|---|---|
| Competition Pool | Thousands to millions of products | Dozens to thousands of products |
| Best Use Case | Overall brand health monitoring | Direct competitive analysis |
| Volatility | Lower (large sample size) | Higher (fewer products) |
| Strategic Action | Long-term brand building | Short-term competitive moves |
Subcategory Dominance Strategy
A home goods brand selling silicone kitchen utensils found their main category BSR fluctuated wildly (Home & Kitchen has millions of products). But their subcategory BSR in "Silicone Cooking Utensils" was much more stable and actionable. They focused on dominating subcategory BSR #1-5, which drove consistent organic traffic. Main category BSR followed naturally.
Nova's BSR Tracker tracks both main and subcategory rankings at the ASIN level, showing historical trends for each. This dual-view approach helps you understand whether ranking changes are niche-specific or category-wide.
How to track BSR effectively
Most sellers check BSR manually. They visit the product page, scroll down, note the number. Maybe they do this daily. Maybe weekly. This approach fails for three reasons:
Why Manual BSR Tracking Fails
- 1.Snapshot, not trend: BSR changes hourly. Checking once daily captures 1 of 24 potential data points.
- 2.No historical comparison: "BSR is #450 today" means nothing without context. Was it #300 last week? #600?
- 3.Can't correlate with actions: without automated tracking, you can't see how campaigns, price changes, or inventory affected rank.
Effective BSR tracking requires automation, historical data, and correlation with your other metrics. Here's the framework:
Automate data collection: Use a tool that captures BSR automatically at regular intervals. Daily captures are minimum. Hourly is ideal for products moving 10+ units per day. Nova captures BSR data continuously and stores historical trends for every ASIN in your catalog.
Compare apples to apples: Always compare BSR at the same time of day and same day of week. Weekend BSR patterns differ from weekday patterns. Tuesday at 10am compared to last Tuesday at 10am is valid. Tuesday compared to Saturday isn't.
Correlate with your actions: track BSR alongside your campaigns, price changes, and inventory levels. When BSR improves after a campaign launch, you've found signal. When it drops after a price increase, you've found your elasticity threshold.
Set meaningful benchmarks: Define your BSR targets based on your category size and competition. "Top 100" in a massive category is very different from "Top 100" in a small niche. Use your historical average as baseline, then set improvement targets from there.
Nova's Day-to-Day Analytics combines BSR tracking with your sales, advertising, and inventory data in one dashboard. You see the correlation between your actions and market position without switching between tools or manual calculation.
Understanding BSR trends and patterns
A single BSR reading tells you almost nothing. The power of BSR tracking comes from analyzing trends over time. Here's how to interpret what you're seeing.
7-Day Trends
Short-term momentum indicator. Captures campaign effects, promotional spikes, and inventory impacts. High volatility is normal.
30-Day Trends
Strategic direction indicator. Shows whether you're genuinely improving or declining. Smooths out weekly noise.
90-Day Trends
Quarterly health check. Reveals whether your competitive position is strengthening or weakening over a full business quarter.
Year-over-Year
Seasonality-adjusted comparison. The only way to compare Q4 to Q4, Prime Day to Prime Day, and control for category cycles.
BSR Volatility Is Normal
BSR can fluctuate 20-50% within a single day for products selling 5-20 units daily. Don't panic over hourly movements. Focus on 7-day and 30-day averages to identify real trends versus noise.
Seasonal patterns to expect
BSR doesn't exist in a vacuum. Category-wide seasonality affects everyone. Understanding these patterns prevents misinterpreting normal fluctuations as problems:
- Q4 compression: Holiday shopping lifts all boats. BSR improvements in November-December may reflect category growth, not your improvement.
- January reset: Post-holiday slowdown hits most categories. BSR decline in January is often seasonal, not concerning.
- Prime Day spikes: Big deal events create temporary BSR chaos. Compare Prime Day to last Prime Day, not to regular weeks.
- Category-specific seasons: Outdoor products peak summer, gift items peak Q4, tax software peaks Q1. Know your category's rhythm.
Nova's BSR Tracker visualizes BSR movements over 7D, 30D, 90D, and custom periods. You see the trend lines that matter, not just today's number.
BSR benchmarks by category
"What's a good BSR?" is one of the most common questions Amazon sellers ask. The answer: it depends entirely on your category size. Here's how to think about benchmarks.
| Category Size | Top Performer | Strong Performer | Average |
|---|---|---|---|
| Massive (1M+ products) | Top 1,000 | Top 10,000 | Top 100,000 |
| Large (100K-1M products) | Top 100 | Top 1,000 | Top 10,000 |
| Medium (10K-100K products) | Top 50 | Top 500 | Top 5,000 |
| Small (under 10K products) | Top 10 | Top 50 | Top 500 |
Use Your Own History as the Best Benchmark
External benchmarks provide context, but your best comparison is yourself. Track your 90-day average BSR for each product. That's your baseline. Set improvement targets from there: "Move from average BSR #2,400 to #1,800 within 60 days." This is more actionable than arbitrary category targets.
According to eMarketer, Amazon's marketplace continues to grow, meaning category sizes expand over time. A BSR that was "good" two years ago may be merely average now. Regular benchmarking against current conditions prevents outdated expectations.
How BSR connects to other performance metrics
BSR doesn't exist in isolation. It correlates with (and sometimes predicts) changes in your other key metrics. Understanding these connections amplifies the value of BSR tracking.
BSR and Organic Rankings
Strong BSR often correlates with improved organic search visibility. Amazon's A10 algorithm considers sales velocity, and BSR is a proxy for that velocity. Products ranking well in BSR tend to rank well organically for related keywords.
Connection: BSR improvement → higher organic placement → more organic sales → BSR improvement (positive feedback loop)
BSR and Advertising Efficiency
Products with better BSR often see lower CPCs in sponsored ads. Higher conversion rates (implied by good BSR) improve your ad relevancy scores. This creates a compounding advantage where market leaders pay less per click. Learn more about this relationship in our TACoS guide.
Connection: Strong BSR → higher ad relevancy → lower CPCs → better TACoS → more profitable growth
BSR and Profitability
BSR improvements typically precede profit margin improvements. Higher sales velocity improves inventory turnover (reducing storage fees), unlocks better supplier pricing, and reduces per-unit fulfillment costs. Track these connections using Nova's P&L Analytics.
Connection: BSR improvement → faster inventory turns → lower unit costs → higher margins
Nova's Winners & Losers dashboard combines BSR trends with profit performance, helping you identify which products are gaining market share profitably versus which are winning share at the cost of margins.
Case study: BSR tracking in action
Here's how systematic BSR tracking transformed decision-making for a kitchen accessories brand selling on Amazon US and UK.
Background
- Product: Silicone baking mats (12-ASIN product line)
- Category: Kitchen & Dining → Bakeware → Baking Mats & Liners
- Starting position: Main category BSR averaging #45,000; Subcategory BSR averaging #85
- Monthly revenue: $52,000
The problem they discovered
Revenue had grown 8% quarter-over-quarter. Internal metrics looked healthy. But when they implemented automated BSR tracking, they discovered their subcategory BSR had deteriorated from #65 to #85 over the same period. They were growing, but losing market share to faster-growing competitors.
Actions taken based on BSR data
Identified the top-gaining competitors by correlating their BSR improvements with product changes. Found 3 competitors had launched lower-price bundles.
Launched a competitive bundle (3-pack with exclusive colors) targeting the price point competitors were winning at.
Increased advertising budget by 40% on products where BSR data showed momentum, reducing spend on declining ASINs.
Tracked BSR weekly to measure response, adjusting tactics based on 7-day trend direction rather than waiting for monthly reviews.
Results After 90 Days
BSR #85 → #42
Subcategory rank improved
+28%
Revenue growth (vs 8% previous quarter)
+15%
Organic traffic share
Without BSR tracking, they would have continued celebrating "8% growth" while competitors captured their market. The early warning from BSR data enabled proactive response instead of reactive damage control 6 months later.
Common BSR mistakes to avoid
BSR is a powerful signal, but it's easy to misinterpret. Here are the most common mistakes sellers make when tracking and acting on BSR data.
Four BSR Mistakes That Cost Money
- 1.Ignoring subcategory BSR: Main category BSR is noisy. Subcategory BSR shows direct competitive position. Sellers who only track main category miss the actionable signal.
- 2.Obsessing over hourly fluctuations: BSR swings 20-50% daily for mid-volume products. Reacting to every hourly change creates whiplash. Focus on 7-day and 30-day averages.
- 3.Not correlating with actions: "BSR improved" means nothing if you don't know why. Track BSR alongside campaigns, pricing, and inventory to identify what actually works.
- 4.Treating BSR as absolute: BSR #500 in Electronics is phenomenal. BSR #500 in a tiny subcategory is mediocre. Always interpret BSR relative to category size and competitive set.
The Right Way to Use BSR
Treat BSR as a directional signal, not a precise measurement. Use 7-day averages to identify momentum. Use 30-day averages to confirm trends. Correlate changes with your actions to build a playbook of what works. Review weekly with your business review checklist.
Frequently asked questions
Start tracking BSR today
BSR is your window into marketplace reality. Internal metrics show your numbers. BSR shows your position relative to everyone else. The sellers who track both make better decisions, faster.
The key takeaways from this guide:
- BSR reveals market position that internal metrics hide. Revenue can grow while market share shrinks.
- Track both main and subcategory BSR. Subcategory is usually more actionable for competitive decisions.
- Focus on trends, not snapshots. Use 7-day and 30-day averages to identify real momentum.
- Correlate BSR with your actions. The real value comes from understanding what moves your rank.
- Automate tracking. Manual checks miss the patterns that matter. Tools like Nova's BSR Tracker capture continuous data.
Try Nova's BSR Tracker
Track main and subcategory BSR at ASIN level. Visualize 7D, 30D, and 90D trends. Correlate BSR with your sales, ads, and inventory in one dashboard. Start your free trial today.
Explore BSR TrackerReferences
- Amazon Seller Central: Best Sellers Rank Documentation
- Harvard Business Review: Competitive Strategy Research
- Practical Ecommerce: BSR Volatility Analysis
- eMarketer: Amazon Marketplace Growth Data
Ready to Transform Your Amazon Business?
Join thousands of successful sellers who use Nova Analytics to make data-driven decisions and maximize their profits.
Continue Learning
Explore more expert insights to grow your Amazon business
Amazon Seller Analytics: The Complete 2026 Guide
Five types of analytics every Amazon seller needs, how to choose the right tools, and the mistakes that cost thousands in missed profit. A comprehensive guide for sellers at every stage.
Best AMZScout Alternative 2026 - Profit Analytics Stack
AMZScout helps sellers find products. Nova shows which ones actually make money — reconciled against Amazon SP-API. Build a research + profit-tracking stack from $29/month.
Best Sellersprite Alternative 2026 - Profit Analytics Stack
Sellersprite finds opportunities. Nova validates which ones make money — reconciled against Amazon SP-API across all 21 marketplaces, from $29/month.