
Amazon A/B Test Tracking
Amazon's tool shows which version won. But it doesn't show whether that win made you more money. Learn to track profit impact, not just conversion rate.
Amazon's Manage Your Experiments tool shows you which image or title won. That's useful. But it doesn't show you whether that win actually made you more money. A listing change that increases conversion rate by 10% can still hurt your bottom line if it attracts lower-value customers or increases return rates.
Smart sellers track what Amazon doesn't: the profit impact of every experiment. They know not just which version converts better, but which version generates better margins, lower returns, and higher customer lifetime value.
This guide shows you how to track A/B test results beyond conversion rate. You'll learn what metrics actually matter, how to calculate profit impact, and how to build a systematic testing program that compounds gains over time.
CVR Increase ≠ Profit Increase
40%
Of tests that improve CVR hurt margins
Average Listing Improvement
12-18%
Revenue lift from optimized listings
Tests Run Per Quarter
4-8
Recommended for mature products
What Amazon's Manage Your Experiments shows (and doesn't)
Manage Your Experiments is Amazon's built-in A/B testing tool. It's free, easy to use, and gives you statistically valid results. For basic testing, it works well. But it has significant blind spots that can lead to costly decisions.
| What Amazon Shows | What Amazon Doesn't Show |
|---|---|
| Conversion rate difference | Profit per conversion |
| Units sold during test | Margin per unit sold |
| Statistical significance | Long-term customer value |
| Which version "won" | Return rate by version |
| Revenue during test period | Ad spend required per version |
The Conversion Rate Trap
A main image showing aggressive pricing can boost CVR by 15%. But if it attracts bargain hunters who return more often and never repurchase, you've optimized for the wrong metric. Research shows that products with misleading images see 2-3x higher return rates. Those returns eat your entire margin and then some.
The solution isn't to stop testing. It's to track the metrics that actually predict profit, not just the ones Amazon surfaces by default.
The metrics that matter beyond conversion rate
To evaluate A/B tests properly, you need to track five metrics that Amazon's tool ignores. These separate the tests that look good from the tests that actually improve your business.
1. Profit per session
Not profit per conversion. Profit per session. This accounts for both conversion rate AND margin. A version with 5% lower CVR but 15% higher margin wins on profit per session.
How to calculate: (Units sold × Net profit per unit) ÷ Total sessions during test period. Compare this between variants, not just conversion rate.
2. Return rate by variant
Track returns for 30 days after the test ends. Some listing changes increase conversions by setting unrealistic expectations. Those conversions come back as returns, erasing your gains.
Warning sign: If the "winning" variant shows return rates 20%+ higher than the control, investigate before rolling out. Learn more in our return rate analytics guide.
3. Average selling price by variant
If you sell multiple variants (sizes, colors, bundles), track which ones sell under each listing version. A main image emphasizing "value" might shift purchases toward your cheapest, lowest-margin variant.
What to watch: Average order value and variant mix. The version with higher CVR might have lower AOV, making it a net loser.
4. Advertising efficiency by variant
Some listings convert better from organic traffic but worse from paid traffic (or vice versa). If your test ran primarily during high-ad-spend periods, your results may not hold when ad mix changes.
How to check: Compare TACoS during the test period. If one variant required more ad support to achieve similar results, factor that into your decision.
5. Post-test performance stability
Some test "wins" are temporary. They exploit novelty or seasonal patterns. Monitor the winning variant for 2-4 weeks after rollout to confirm gains persist.
Best practice: Flag any test result that shows 20%+ degradation in the first month after rollout. Consider reverting or re-testing.
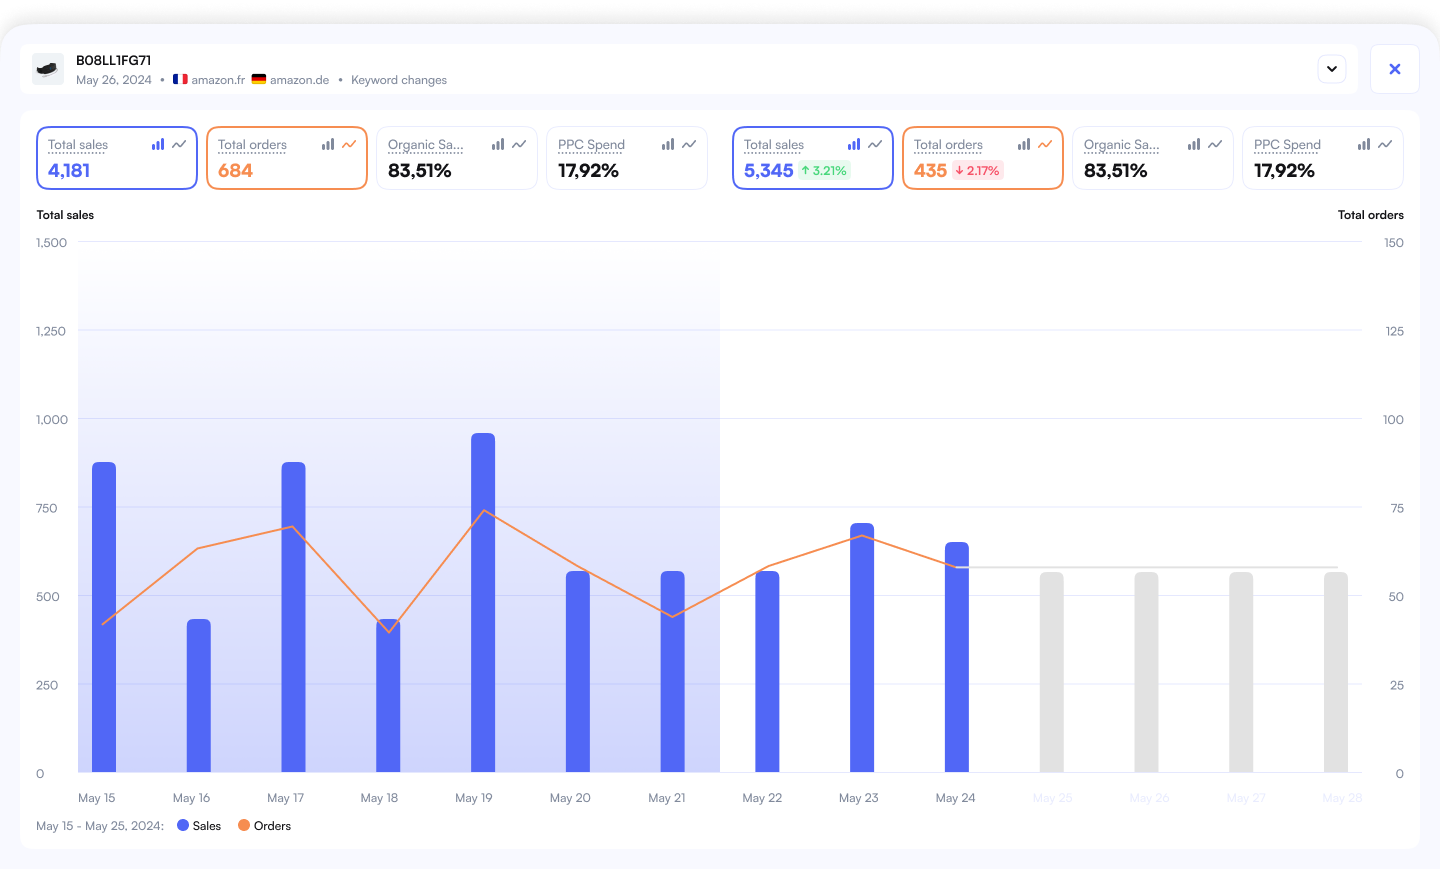
Tracking experiments in one dashboard
A proper A/B test tracking system shows all your experiments in one view, with profit metrics alongside Amazon's conversion data. This makes it easy to see which tests actually improved your business.
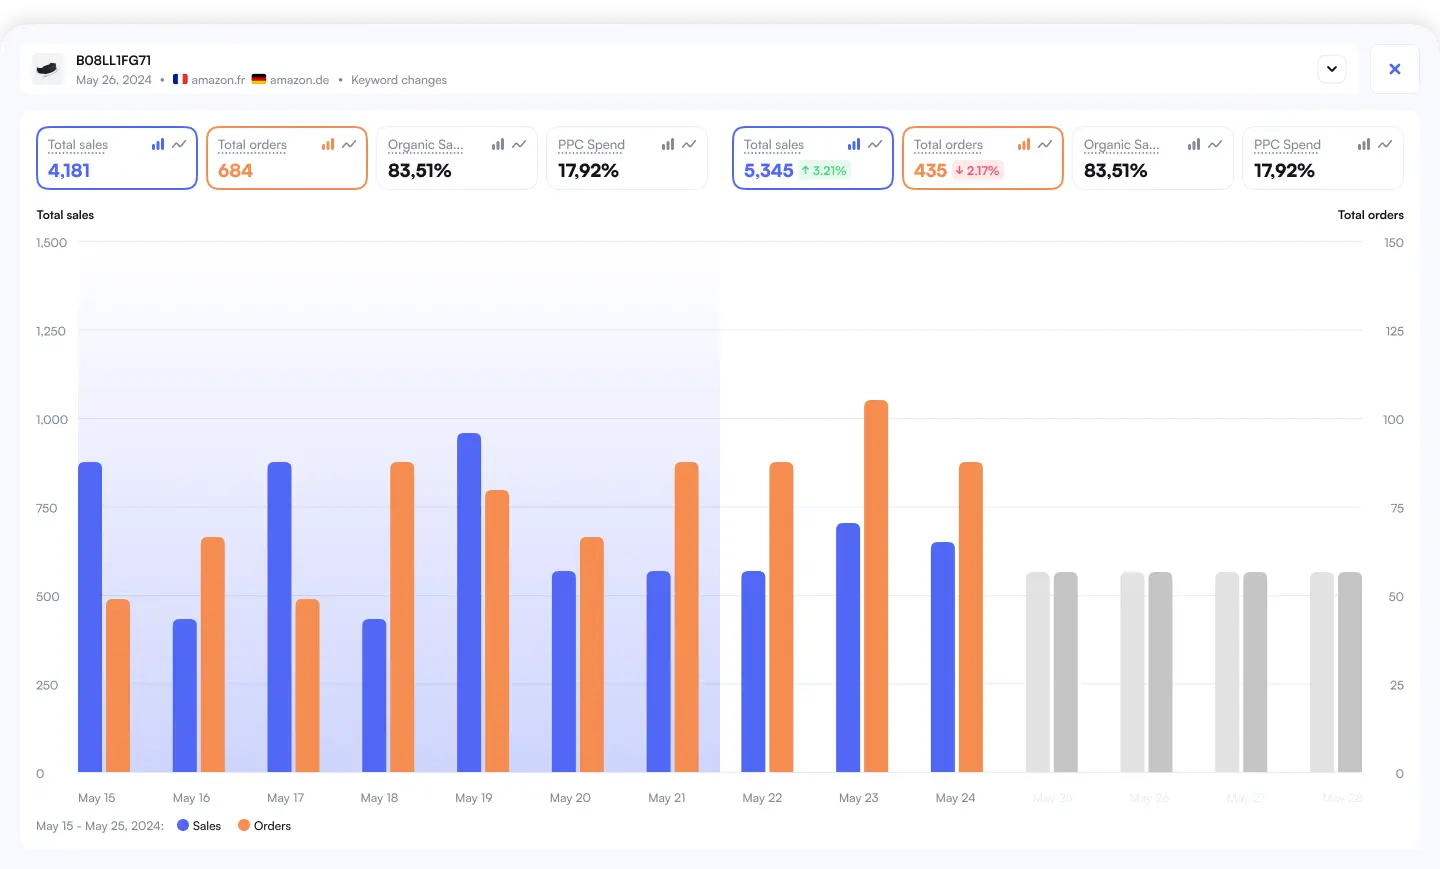
Nova's A/B Testing Tracker Connects to Manage Your Experiments and overlays profit data from your P&L dashboard, giving you the complete picture.
How to track profit impact of listing changes
Here's the step-by-step process for measuring true profit impact, not just conversion lift.
1Baseline your product before testing
Before launching any test, document your product's current performance. You need a clear baseline to measure improvement against.
| Metric | Baseline Period | Why It Matters |
|---|---|---|
| Conversion rate | Last 30 days | Amazon's primary metric |
| Net profit per unit | Last 30 days | Your actual bottom line |
| Return rate | Last 60 days | Hidden cost of conversions |
| TACoS | Last 30 days | Advertising dependency |
2run the test with clean controls
During the test, avoid changes that could contaminate results: don't adjust pricing, don't dramatically change ad spend, don't run promotions. Keep everything else constant so you're measuring the listing change only.
Test duration: run until you reach statistical significance or 4 weeks, whichever comes first. Tests shorter than 2 weeks rarely produce reliable results due to day-of-week and promotional timing effects.
3Calculate profit impact, not just CVR lift
When the test ends, calculate profit per session for each variant. Here's the formula:
Profit per session = (Sessions × CVR × Net profit per unit) ÷ Sessions
Simplified: Profit per session = CVR × Net profit per unit
Compare this between variants. The one with higher profit per session wins, regardless of which has higher CVR.
4Monitor returns for 30 days post-test
Returns from the test period will trickle in over the next month. Track return rate by which variant generated the original sale.
Action threshold: If the winning variant's return rate exceeds the baseline by 25%+, recalculate profit impact with return costs included. This can flip your decision.
5Roll out and verify
After implementing the winning variant, monitor performance for 2-4 weeks. Confirm that the gains persist outside the test environment.
Why this matters: Test environments can have Hawthorne effects. Sometimes simply changing something causes temporary lifts that fade. Verification catches these false positives.
Analyzing test results with profit data
When you combine Amazon's conversion data with your profit metrics, you can make decisions that actually improve your bottom line, not just your vanity metrics.
Track experiment history and profit impact over time to build institutional knowledge about what works for your products. Connect your testing insights with Nova's P&L Dashboard for complete visibility.
Case study: when higher CVR hurt margins
Here's a real example of why profit tracking matters more than conversion rate.
Kitchen gadget brand: main image test
A kitchen brand tested two main images. Version A showed the product in a clean studio setting. Version B showed it in use with food preparation, emphasizing how "compact" and "space-saving" it was.
| Metric | Version A (Studio) | Version B (In-Use) |
|---|---|---|
| Conversion rate | 8.2% | 9.6% (+17%) |
| Return rate | 6.4% | 11.2% (+75%) |
| Net profit per sale | $12.40 | $10.80 (after return costs) |
| Profit per session | $1.02 | $0.96 |
The lesson: Amazon's tool declared Version B the winner. But the "compact" emphasis set unrealistic size expectations, driving returns from customers who found it larger than expected. Version A generated 6% more profit per session despite lower conversion rate.
Without profit tracking, this brand would have rolled out the worse option and wondered why margins dropped.
Setting up systematic experiment tracking
One-off tests are useful. A systematic testing program compounds gains over time. Here's how to build one.
Prioritize tests by impact potential
Focus testing resources on high-volume, high-margin products first. A 10% improvement on a product selling 500 units/month at $15 margin beats a 30% improvement on a product selling 50 units/month at $5 margin. Use Nova's Winners & Losers to identify your highest-impact testing candidates.
Test one element at a time
Resist the urge to test multiple changes simultaneously. If you change the main image AND the title, you can't know which change drove results. Test main image first, implement winner, then test title separately.
Document everything
Keep a test log with hypothesis, variants tested, results, and learnings. Over time, you'll build institutional knowledge about what works for your products and categories. This knowledge is one of your competitive moats.
Schedule regular testing cadence
For mature products, run 4-8 tests per year. For new products still finding product-market fit, test more aggressively. Block time quarterly to review test results and plan the next round.
| Test Element | Typical Impact Range | Priority |
|---|---|---|
| Main image | 10-30% CVR change | Highest |
| Title | 5-15% CVR change | High |
| A+ Content | 3-10% CVR change | Medium |
| Bullet points | 2-8% CVR change | Medium |
| Price point | Variable (use carefully) | Test separately from content |
Frequently asked questions
Start tracking test profit impact today
Amazon's Manage Your Experiments is a good starting point. But relying solely on conversion rate leads to decisions that optimize vanity metrics while hurting your actual profitability.
The sellers who compound gains year over year track what matters: profit per session, return rates, and long-term performance stability. They build testing programs that generate sustainable competitive advantage, not just short-term CVR bumps.
Ready to track your A/B tests properly? Explore Nova's A/B Testing Tracker for profit-based experiment analysis. Or start with our profit dashboard setup guide to build your data foundation first.
Sources & References
Ready to Transform Your Amazon Business?
Join thousands of successful sellers who use Nova Analytics to make data-driven decisions and maximize their profits.
Continue Learning
Explore more expert insights to grow your Amazon business
Why Amazon profit tracking is broken in 2026
Seller Central reports lie by omission, spreadsheets buckle under 40+ fee types, and most analytics tools paper over the gaps. Here is what actually broke and how serious operators are fixing it.
Best AMZScout Alternative 2026 - Profit Analytics Stack
AMZScout helps sellers find products. Nova shows which ones actually make money — reconciled against Amazon SP-API. Build a research + profit-tracking stack from $29/month.
Best Sellersprite Alternative 2026 - Profit Analytics Stack
Sellersprite finds opportunities. Nova validates which ones make money — reconciled against Amazon SP-API across all 21 marketplaces, from $29/month.