Amazon Seller Power BI Dashboard: Connect Your Data in 2026
Your finance team uses Power BI. Your operations team uses Power BI. But your Amazon data is stuck in Seller Central exports. This guide shows you how to connect Amazon seller data to Power BI and build dashboards that actually drive decisions.
•Pre-calculate KPIs in your warehouse. Complex DAX formulas slow down reports significantly.
•Nova delivers Amazon data to your warehouse with 700+ metrics ready for Power BI.
Your finance team uses Power BI. Your operations team uses Power BI. But your Amazon data is stuck in Seller Central exports and spreadsheets. This guide shows you how to connect Amazon seller data to Power BI and build dashboards that actually drive decisions.
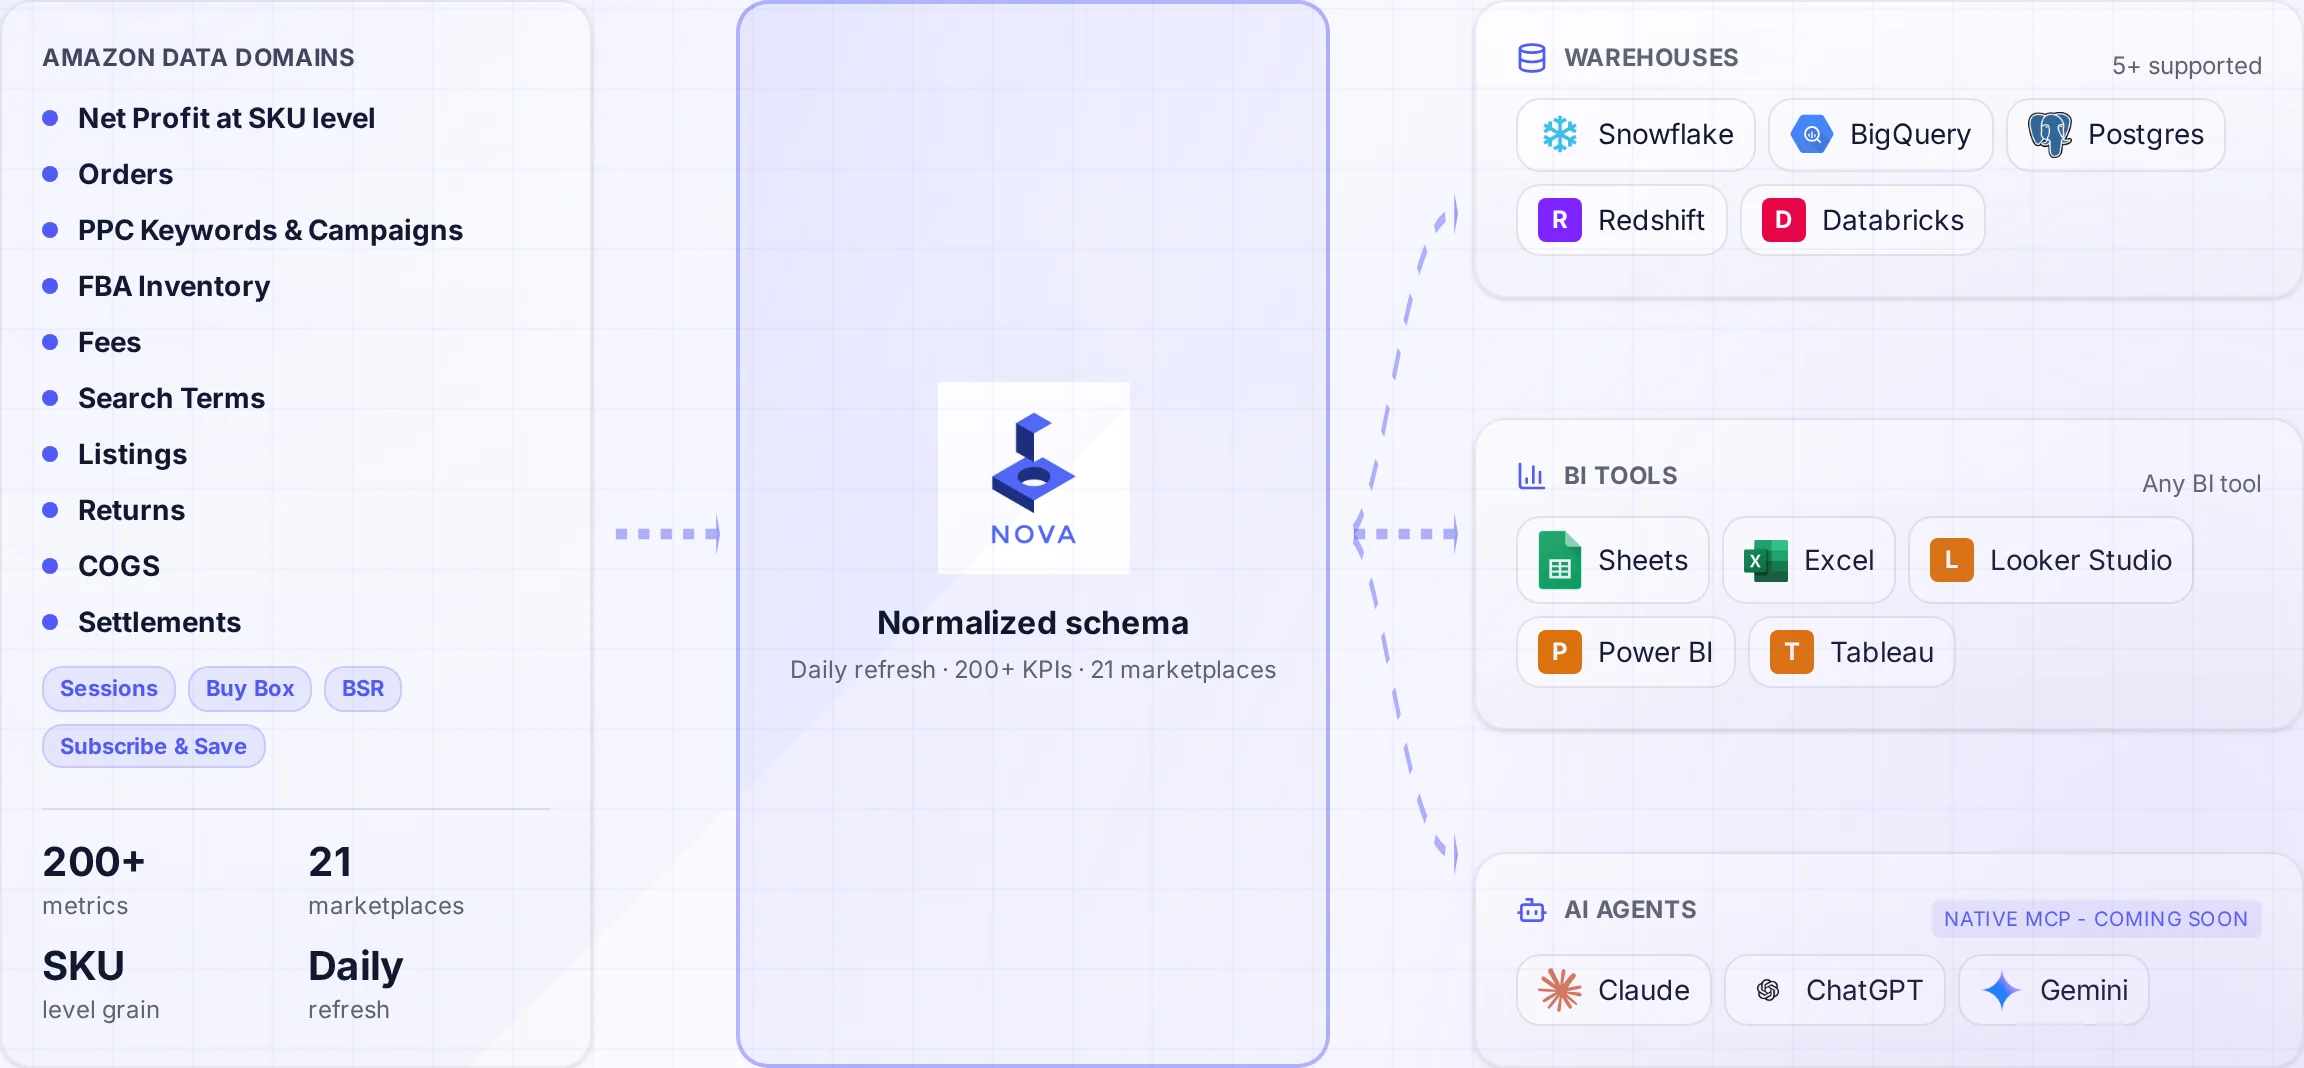
A normalized schema connects Amazon data to the warehouses and tools your team uses.
Power BI is Microsoft's business intelligence platform used by over 5 million organizations worldwide. If your company already uses the Microsoft stack (Excel, Azure, Teams), Power BI is the natural choice for visualization. The challenge isn't Power BI itself. It's getting Amazon data into a format Power BI can use.
We'll cover three paths: connecting via BigQuery/Snowflake (recommended), using CSV exports (painful), and connecting to Nova's raw data service (easiest). By the end, you'll have a clear roadmap for building Amazon dashboards your entire organization can use.
Why Power BI for Amazon Analytics
Seller Central has reports. Amazon Brand Analytics has reports. But none of them integrate with your broader business data. Power BI solves this by becoming the single source of truth for all your data.
Enterprise Integration
Connect Amazon data with ERP, CRM, and financial systems in a single dashboard.
Row-Level Security
Control who sees what. Brand managers see their brands. Executives see everything.
Advanced Analytics
DAX formulas, forecasting, anomaly detection, and AI-powered insights.
Scheduled Refresh
Set it and forget it. Power BI pulls fresh data automatically on your schedule.
When Power BI Makes Sense
Power BI is ideal when you need to combine Amazon data with other business systems, require enterprise security features, or already have Power BI licenses. If you just need Amazon-specific dashboards, Looker Studio (free) or Tableau may be simpler starting points.
3 Ways to Connect Amazon Data to Power BI
Method 1: Via BigQuery or Snowflake (Recommended)
The cleanest approach is routing Amazon data through a data warehouse. Power BI has native connectors for both BigQuery and Snowflake.
Clean data: Warehouse handles transformations, Power BI just visualizes
Scheduled refresh: Power BI Service can refresh hourly
Scalable: Works for 100 SKUs or 100,000 SKUs
Combines sources: Join Amazon data with Shopify, NetSuite, etc.
Method 2: CSV Exports (Manual, Error-Prone)
You can export reports from Seller Central and load them into Power BI. This works for one-off analysis but fails for ongoing dashboards.
Why CSV Exports Don't Scale
Manual process: Someone has to download and upload files daily
Data gaps: Missed a day? Your dashboard is incomplete
Schema changes: Amazon changes column names without warning
Multiple reports: you need 10+ reports for a complete picture
No real-time: Data is always at least 24-48 hours stale
Method 3: Direct from Nova (Easiest)
If you're using Nova's ready-made data service, you can connect Power BI directly to your Nova-managed BigQuery or Snowflake instance. Data flows Amazon → Nova → Warehouse → Power BI with orders and units arriving in real time.
"We tried building Amazon dashboards with CSV exports for 6 months. It was a nightmare. Once we connected Nova to Power BI via BigQuery, we had reliable dashboards in a week. Our finance team finally trusts the numbers."
Jennifer W.
BI Manager, Consumer Goods Brand ($30M/yr)
7 Essential Amazon Power BI Visualizations
Once your data is connected, here are the visualizations every Amazon dashboard needs:
Revenue & Profit Trend
Line chart with dual Y-axis. Daily for operations, weekly for exec reviews.
TACoS Gauge
KPI card with targets. Green <15%, Yellow 15-25%, Red >25%.
SKU Profitability Matrix
Scatter plot: Units sold vs margin. Bubble size = profit.
Fee Breakdown Waterfall
Revenue → Fees → Net Profit. Where does margin go?
Marketplace Comparison
Clustered bars by marketplace. Revenue, margin, TACoS.
Return Rate by Category
Bar chart with 5% threshold highlight. Returns kill profit.
Inventory Health Heatmap
Matrix: Days of inventory, velocity, storage costs.
TACoS (Total Advertising Cost of Sale) tells you if your advertising is sustainable. Unlike ACoS, it accounts for organic sales, showing the true cost of customer acquisition.
Essential DAX Formulas for Amazon KPIs
Power BI uses DAX (Data Analysis Expressions) for calculated columns and measures. Here are the formulas you'll need for Amazon analytics:
Pro Tip: Pre-Calculate in the Warehouse
Complex DAX formulas slow down Power BI reports. If you're using Nova's raw data service, we pre-calculate 700+ metrics in the warehouse. Power BI just displays them. Much faster, much simpler.
Dashboard Templates
Here are three dashboard layouts for different use cases:
Template 1: Daily Operations Dashboard
Target user: Account managers, PPC specialists
Top row: KPI cards (Revenue, Orders, TACoS, BSR changes)
Middle: Revenue trend line (7-day view)
Bottom left: Top 10 products by revenue
Bottom right: Alerts (stock outs, high ACoS, review drops)
Refresh: orders and units in real time
Template 2: Weekly Business Review
Target user: Brand managers, directors
Profit & Loss summary (week-over-week comparison)
SKU profitability matrix
Marketplace performance comparison
Inventory aging analysis
Refresh: Daily
Template 3: Executive Overview
Target user: C-suite, investors
Monthly revenue and profit trends (12-month view)
Category-level performance
YoY growth metrics
Forecast vs actuals
Refresh: Weekly
Frequently Asked Questions
Common questions about Amazon data in Power BI
No. Amazon doesn't provide a direct Power BI connector. You need an intermediary: either a data warehouse (BigQuery, Snowflake) or CSV exports. The warehouse approach is recommended for automated, reliable dashboards.
Import mode loads data into Power BI's memory for faster queries but requires scheduled refreshes. DirectQuery queries the warehouse in real-time but is slower. For Amazon data, Import mode with hourly refresh works well for most use cases.
Power BI Desktop is free. Power BI Pro costs $10/user/month for sharing dashboards. Power BI Premium starts at $20/user/month or $4,995/month for dedicated capacity. Most Amazon sellers start with Pro.
Power BI Pro allows 8 refreshes per day. Power BI Premium allows 48 refreshes per day. The bottleneck is usually getting fresh data into your warehouse, which is why Nova's real-time orders and units matter.
Power BI is better for enterprise environments with Microsoft stack, advanced DAX calculations, and row-level security needs. Looker Studio is free and simpler, ideal for startups or teams new to BI. Both work well with Nova's data service.