Seller Central reports are limited. Looker Studio lets you build unlimited custom Amazon dashboards for free. Learn how to connect your data, which 7 metrics matter most, and get templates for daily performance, P&L, and PPC dashboards.
We understand that some Amazon sellers need flexibility. You want to build your own reports, your own dashboards, your own way. That's exactly why we created Nova's ready-made Amazon raw data service: to give you clean, normalized data you can plug directly into tools like Looker Studio.
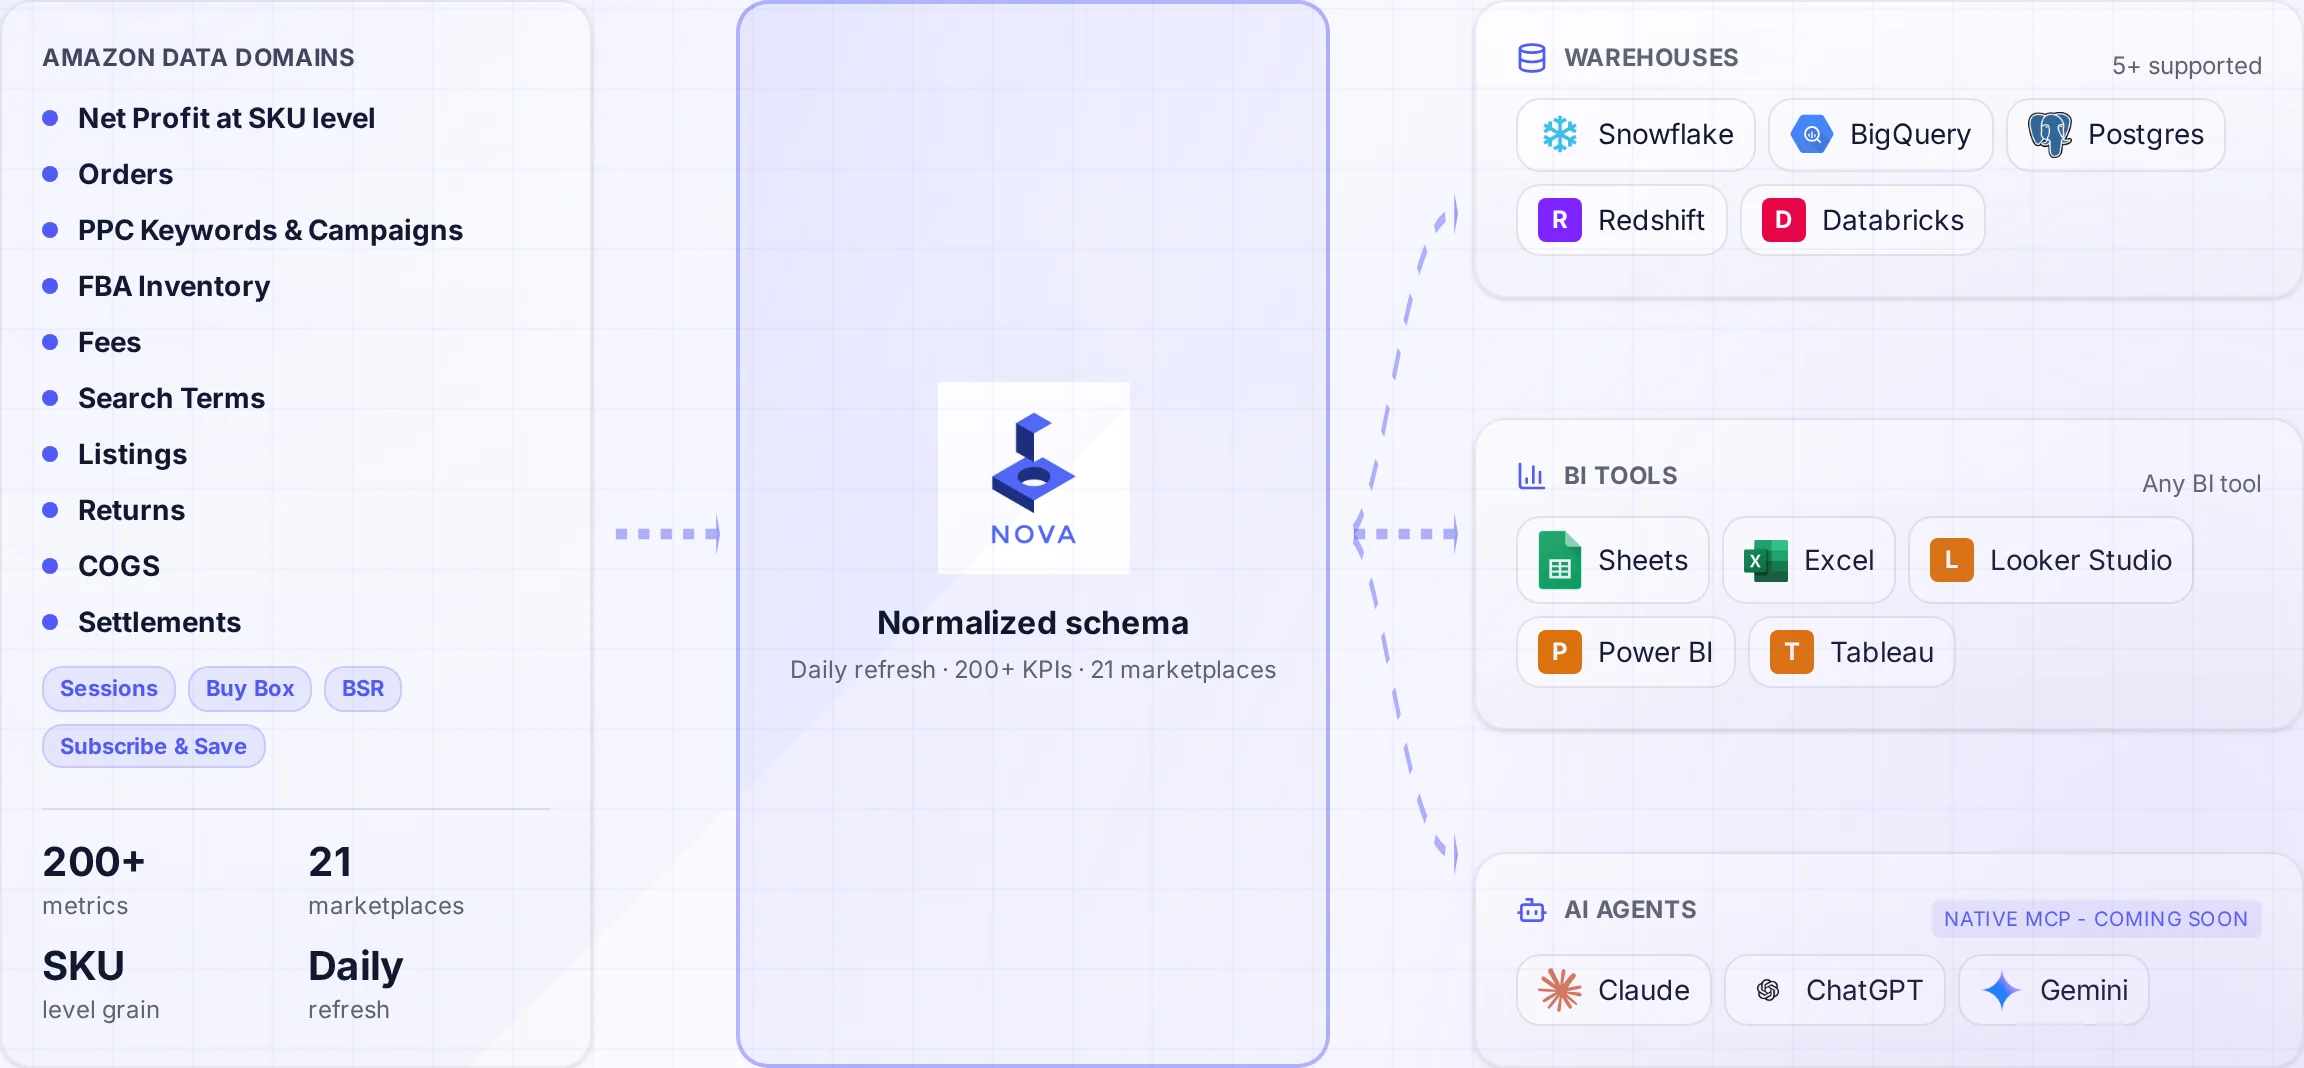
A normalized schema connects Amazon data to the warehouses and tools your team uses.
Seller Central reports are rigid. Spreadsheets break at scale. You've outgrown the built-in tools, but building your own data pipeline from Amazon's fragmented APIs takes 12-18 months and costs hundreds of thousands of dollars.
Google Looker Studio (formerly Data Studio) gives you the flexibility you need. It's free, collaborative, and connects directly to databases like BigQuery. The result: custom dashboards that auto-refresh, embed anywhere, and answer the specific questions your business needs.
The problem? Amazon doesn't connect to Looker Studio. There's no "Connect Amazon" button. Between Amazon's chaotic APIs and Looker Studio's data requirements sits a gap that stops most sellers cold. This guide shows you how to bridge that gap, and how Nova serves as the missing brick between Amazon's data and your custom dashboards.
Why Flexibility Matters for Amazon Sellers
Every Amazon business is different. A private label brand selling 50 SKUs across 5 marketplaces has different reporting needs than an aggregator managing 200 brands. A solo seller tracking profit margins cares about different metrics than an agency reporting to 30 clients.
Seller Central treats everyone the same. You get the same reports, the same date ranges, the same visualizations. No customization. No flexibility.
What Looker Studio Unlocks
Custom metrics: build calculations Seller Central doesn't offer (true net profit, TACoS by product, contribution margin by marketplace)
Multi-account views: Combine data from multiple seller accounts or marketplaces into one dashboard
Team sharing: give stakeholders live access without Seller Central credentials
Historical trends: Visualize years of data instead of Seller Central's limited date ranges
Auto-refresh: Dashboards update automatically, no manual exports
Embeddable reports: put dashboards in client portals, internal wikis, or executive presentations
Looker Studio is free. Unlimited reports. Unlimited viewers. The only cost is getting your Amazon data into a format it can read.
The Amazon API Nightmare: Why This Is Harder Than It Looks
Here's what nobody tells you when you decide to "just export Amazon data to Looker Studio."
Amazon doesn't have one API. It has dozens. The Selling Partner API (SP-API) is actually a collection of 20+ separate APIs, each with its own authentication, rate limits, data formats, and quirks. Getting a complete picture of your business means calling multiple endpoints and stitching the data together yourself.
The Amazon Reports Chaos
Amazon's reporting system is fragmented by design:
Sales data comes from the Orders API and Settlement Reports (which don't match)
Fee data is buried in Settlement Reports, with 200+ fee types coded differently
Advertising data Lives in a completely separate Advertising API
Inventory data Requires the FBA Inventory API plus Inbound Shipment API
Traffic data (sessions, conversion) comes from Business Reports, which have their own API
Returns data Requires the Returns API and FBA Returns Report
Each report has different date formats, different product identifiers (ASIN vs SKU vs FNSKU), and different refresh frequencies. Reconciling them is a full-time job.
Then there's the rate limiting. Amazon throttles API calls aggressively. Request too much data too fast, and you're blocked. Each endpoint has different limits. Some reports take hours to generate before you can even download them.
And Amazon changes things constantly. Schema updates happen quarterly. New fee types appear without warning. Report formats shift. Any pipeline you build today will break tomorrow without constant maintenance.
Three Ways to Get Amazon Data into Looker Studio
Despite the complexity, you have options. Here's what actually works:
Option 1: Manual CSV Exports (Not Recommended)
Why Manual Exports Fail
Downloading CSVs from Seller Central and uploading to Google Sheets works for a week. Then:
You forget to update and decisions are made on stale data
File formats change and break your dashboard
Historical data accumulates in disconnected spreadsheets
Your team spends hours on data entry instead of analysis
You can only export what Seller Central offers, not raw API data
Option 2: Google Sheets Intermediary (Limited)
Some sellers use Google Sheets as a database, then connect Sheets to Looker Studio. This works for small catalogs but hits limits quickly:
Google Sheets has a 10 million cell limit
Performance degrades past 50,000 rows
No automatic Amazon data sync (still requires manual exports or scripts)
Formula errors cascade through connected dashboards
Not suitable for multi-marketplace or high-SKU-count businesses
Option 3: BigQuery + Data Pipeline (Best)
The professional approach: load Amazon data into Google BigQuery, then connect BigQuery to Looker Studio natively. This gives you:
Unlimited data storage (years of history across all marketplaces)
Sub-second query performance on millions of rows
Automatic refresh schedules
Enterprise-grade security
Access to ALL Amazon data points, not just what Seller Central exports
The challenge is building the pipeline that gets Amazon data into BigQuery. That's where most projects die. Read our Amazon Seller Data to BigQuery Guide for the full breakdown.
Nova: The Missing Brick Between Amazon and Looker Studio
This is the gap Nova fills. Instead of spending 12-18 months building and maintaining your own Amazon data pipeline, you connect your seller accounts to Nova and receive clean, modeled data directly in BigQuery (or Snowflake).
What Nova Delivers to Your Data Warehouse
All Amazon data points: every metric available through Amazon's APIs, normalized and ready for analysis
Historical backfills: 2+ years of data loaded automatically
Schema documentation: your team knows exactly what each field means
The result: you focus on building dashboards in Looker Studio, not fighting with Amazon APIs. Nova handles the extraction, transformation, and loading. You get the flexibility you wanted without the engineering nightmare.
What Amazon Data Is Available for Your Dashboards
When you connect Amazon data properly (via Nova or your own pipeline), you get access to everything Amazon tracks. Not just 7 metrics. Not just what Seller Central shows. Everything.
Growth Metrics
Sessions & page views by ASIN
Conversion rates (unit session percentage)
Buy Box percentage over time
Search rank by keyword
Sales velocity & trends
New-to-brand metrics (if Brand Registered)
Organic vs paid traffic split
Profitability Data
200+ fee types (referral, FBA, storage, removal)
Returns & refunds by reason code
Reimbursements claimed and pending
Advertising spend by campaign, ad group, keyword
Promotional discounts and coupons
Currency conversion for global sellers
Settlement reconciliation data
Operations Data
Inventory levels by fulfillment center
Inbound shipment status and history
FBA fees by SKU with size tier
Stranded inventory alerts
Aged inventory reports
Removal and disposal orders
Reserved inventory breakdown
CX & Market Data
Review ratings & counts over time
Seller feedback scores
A-to-Z claims and resolution
Category best seller rank
Brand analytics (search terms, demographics)
Return reasons by product
Customer questions and responses
With all this data available, the 7 metrics highlighted below represent the most commonly requested KPIs. But your dashboards aren't limited to these. Build what your business needs.
7 Most-Requested Amazon Metrics for Looker Studio Dashboards
While you have access to hundreds of data points, these seven metrics appear on almost every Amazon seller dashboard. They're the starting point, not the limit:
1. Revenue & Sales Velocity
Track gross sales, units sold, and average order value. Compare daily/weekly trends to spot momentum shifts before they impact rankings.
2. TACoS (Total ACoS)
Ad spend divided by total revenue (not just ad-attributed). Shows whether PPC is growing your business or eating your margin. TACoS guide.
3. Profit Margins by SKU
Revenue minus all costs (COGS, Amazon fees, ads, shipping). Identify which products make money and which drain resources.
4. Inventory Health
Days of supply, aged inventory percentage, and restock alerts. Stockouts kill rankings. Excess inventory eats storage fees.
5. Buy Box Percentage
The percentage of time you own the Buy Box. Below 90%? You're losing sales to competitors or Amazon itself.
6. Return Rates
Track returns by SKU and reason code. High return rates signal listing issues, quality problems, or competitive pricing gaps.
7. Conversion Rate
Sessions to orders. The metric that compounds everything else. A 1% improvement in conversion beats most other optimizations.
Amazon Looker Studio Dashboard Templates
Here are four dashboard templates that cover most Amazon seller use cases. Each can be built in Looker Studio once your data is connected via BigQuery:
Template 1: Daily Performance Dashboard
The executive overview. One page showing yesterday's performance vs. Goals:
Component
Visualization
Purpose
Revenue scorecard
Big number with trend
Immediate health check
Units sold vs. Last week
Bar chart comparison
Velocity trends
TACoS trend (30 days)
Line chart
Ad efficiency direction
Top 10 SKUs by revenue
Horizontal bar chart
Focus attention
Inventory alerts
Table with conditional formatting
Action items
Template 2: P&L Dashboard
Financial deep dive for weekly/monthly review:
Revenue waterfall (gross → net after returns → net after fees → net profit)
Fee breakdown by type (referral, FBA, storage, advertising)
Profit margin by SKU with sorting
Month-over-month comparison tables
Contribution margin trends
Template 3: PPC Performance Dashboard
Campaign performance for weekly bid adjustments:
ACoS and TACoS by campaign type (Sponsored Products, Brands, Display)
Spend vs. Sales scatter plot to identify efficient campaigns
Keyword performance table with impressions, clicks, conversions
Search term analysis for negative keyword opportunities
Budget utilization by campaign
Template 4: Multi-Marketplace Comparison
For sellers operating across US, UK, DE, FR, and other marketplaces:
Revenue by marketplace (normalized to USD)
Profit margin comparison across regions
Best-performing SKUs by market
Currency impact analysis
Expansion opportunity identification
Looker Studio Sharing Options
Dashboards can be embedded in websites, shared via link, or scheduled as PDF email reports. No recipient needs a Google account to view. This makes it ideal for agency client reporting and executive updates.
Amazon Data in Tableau: When It Makes Sense
Tableau is the enterprise alternative to Looker Studio. Here's when to consider it:
Feature
Looker Studio
Tableau
Cost
Free
$70-150/user/month
Visualization depth
Good for most needs
Advanced, highly customizable
Learning curve
Low (drag-and-drop)
Medium to high
Data prep
Basic
Powerful Prep Builder
Enterprise features
Limited
SSO, governance, row-level security
BigQuery integration
Native (same Google ecosystem)
Requires connector setup
Choose Looker Studio if: you want free, collaborative dashboards and your needs are standard reporting with full flexibility.
Choose Tableau if: you need advanced visualizations, have a data team, or require enterprise governance features.
Both connect to the same BigQuery data source, so you can start with Looker Studio and migrate to Tableau later if needed. Nova delivers to both.
Getting Started: Build Your First Dashboard
1
Connect Your Data
Load Amazon data to BigQuery via Nova (or build your own pipeline).
2
Create Looker Report
Open Looker Studio, add BigQuery as data source, select your dataset.
3
Build & Share
Drag-and-drop visualizations, set refresh schedule, share with team.
Start with the Daily Performance template. Add complexity as your team gets comfortable with the tool. The flexibility is there when you need it.
Ready to Skip the Pipeline Build?
Nova delivers all Amazon data points to BigQuery with orders and units arriving in real time. Connect your seller accounts, get clean data in your warehouse, and start building Looker Studio dashboards in days instead of months. Explore Nova's API for data teams, agencies, and aggregators.