Daily Amazon Dashboard: 7 Metrics to Check Every Morning
Top sellers catch problems in hours, not weeks. Learn the seven metrics to check every morning in under 10 minutes, the red flags that demand immediate action, and how to build the daily dashboard habit.
Reactive sellers check Seller Central when something feels wrong. Proactive sellers check their dashboard every morning before problems become expensive. The difference? One group catches issues in hours. The other discovers them weeks later, after they've cost thousands. We pulled the playbook below from cohort reviews with brands and agencies, not from a slide deck.
Research on analytics adoption shows that companies using operational dashboards reduce decision latency by 75% and improve operational efficiency by 15-25%. For Amazon sellers, that translates to catching problems in their first day instead of their first month.
This guide covers the seven metrics you should check every morning. Not seven reports. Not seven deep dives. Seven quick checks that take 10 minutes total and catch 90% of the problems that cost sellers money.
Daily Check Time
10 min
Target time for morning review
Problem Detection Speed
24 hrs
vs. Weeks with monthly reviews
Issues Caught Early
90%
Of costly problems with daily monitoring
Why daily monitoring beats reactive firefighting
Amazon moves fast. A listing suppression at 8 AM means lost sales all day. A Buy Box loss on a high-velocity product costs hundreds in the first 24 hours. A PPC bid that doubled overnight can drain your ad budget before lunch.
Most sellers discover these issues when they finally log into Seller Central days later, or when revenue mysteriously drops and they start investigating. By then, the damage is done.
The Cost of Delayed Detection
A listing suppression on a product selling 20 units/day at $15 profit per unit costs $300 in lost profit per day. Catching it on day 1 versus day 7 is the difference between $300 and $2,100 in losses. Daily monitoring isn't optional for serious sellers.
The goal of daily monitoring isn't deep analysis. It's rapid detection. You're scanning for anomalies that need investigation, not solving problems during your morning check. When something looks off, you flag it. Then you dig deeper when you have time, or delegate it if you have a team.
Here are the seven metrics that matter most, in the order you should check them.
What a daily dashboard looks like
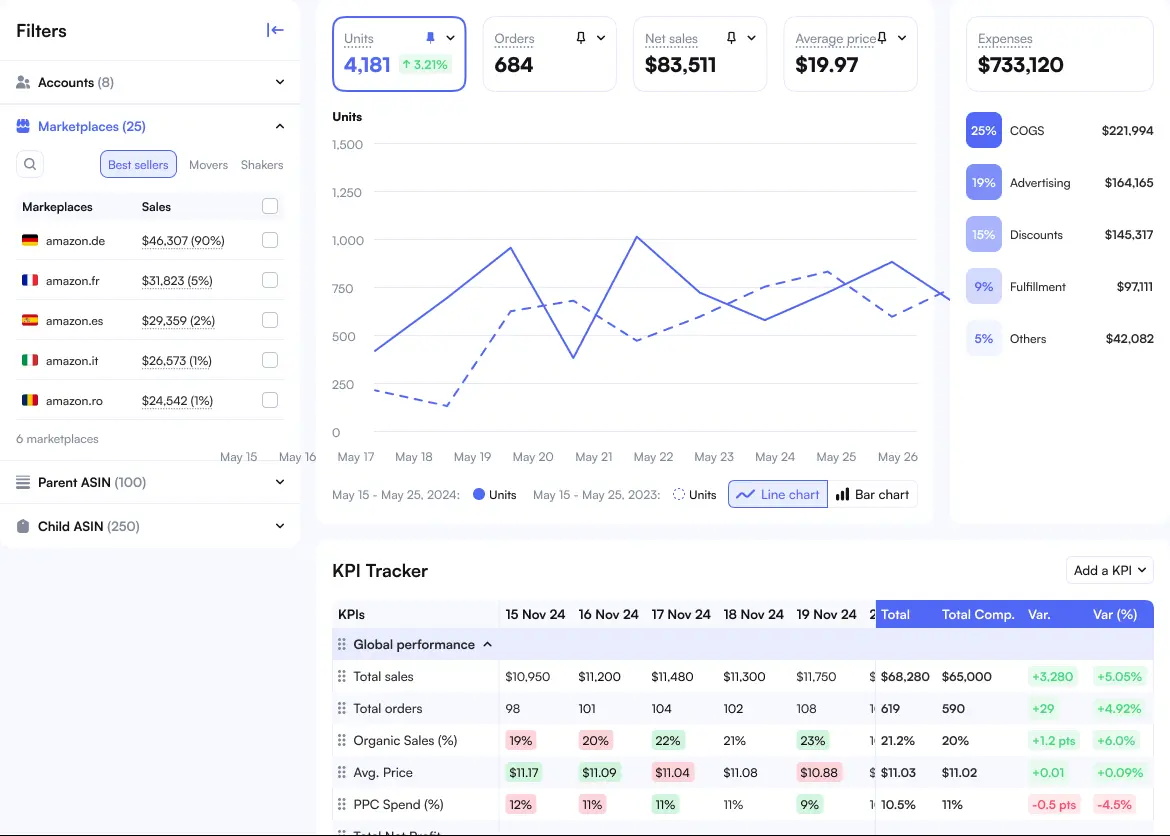
A proper daily dashboard shows all key metrics in one view, eliminating the need to navigate through multiple Seller Central reports. Here's what you should see at a glance each morning. For today's orders while the day is still running, Live Orders Stream compares the pace against a typical day at the same minute.
Nova's Day-to-Day Performance dashboard displays all seven key metrics on a single screen, with orders and units arriving in real time with data from Seller Central.
The 7 essential daily metrics
Each metric below includes what to look for, what triggers an investigation, and approximately how long the check should take. The goal is under 10 minutes total for all seven.
1yesterday's Revenue vs. Same Day Last Week
What to check
Compare yesterday's total revenue to the same weekday last week. Monday vs. Monday, Tuesday vs. Tuesday. This normalizes for weekly patterns.
Investigation trigger
Drop of 15%+ without explanation (no stockout, no known issue). Investigate within 24 hours.
Time required: 30 seconds
Why it matters: Revenue is your top-line signal. Large drops indicate something is wrong (listing issue, Buy Box loss, competitor action). Small variations are normal. Focus on significant deviations.
2Units Sold by Top Products
What to check
Review unit sales for your top 10 products by volume. These drive most of your business and warrant individual attention.
Investigation trigger
Any top-10 product with 20%+ fewer units than typical. Check Buy Box, listing status, inventory.
Time required: 1 minute
Why it matters: Unit sales tell you what revenue can't. A product maintaining revenue but dropping units means price increased (intentional?) or competition thinned (temporary?). Units dropping faster than revenue suggests customers are buying higher-priced variants.
3TACoS (Total Advertising Cost of Sale)
What to check
Yesterday's ad spend divided by total revenue (not just attributed revenue). Compare to your 30-day average.
Investigation trigger
TACoS up 5+ percentage points vs. Average. Either ad spend spiked or organic sales dropped.
Time required: 1 minute
Why it matters: TACoS reveals your advertising efficiency relative to total business performance. High ACoS can be fine if TACoS is healthy. Rising TACoS with flat revenue means you're becoming ad-dependent without growing. Learn more in our complete TACoS guide.
4BSR Changes on Key Products
What to check
Best Sellers Rank movement on your top 5-10 products. Look for significant rank drops (higher number = worse rank).
Investigation trigger
BSR drops 30%+ in 24 hours without stockout. Often signals competitor action or algorithm change.
Time required: 2 minutes
Why it matters: BSR is Amazon's real-time signal of relative sales velocity. A dropping BSR on a product with stable inventory often means a competitor is outperforming you. Track BSR trends with Nova's BSR Tracker for automated monitoring.
5Net Profit Margin Trend
What to check
Yesterday's net profit margin vs. 7-day average. Margin compression often happens gradually and is easy to miss without daily tracking.
Investigation trigger
Margin down 3+ percentage points. Check for fee changes, return spikes, or ad spend increases.
Time required: 1 minute
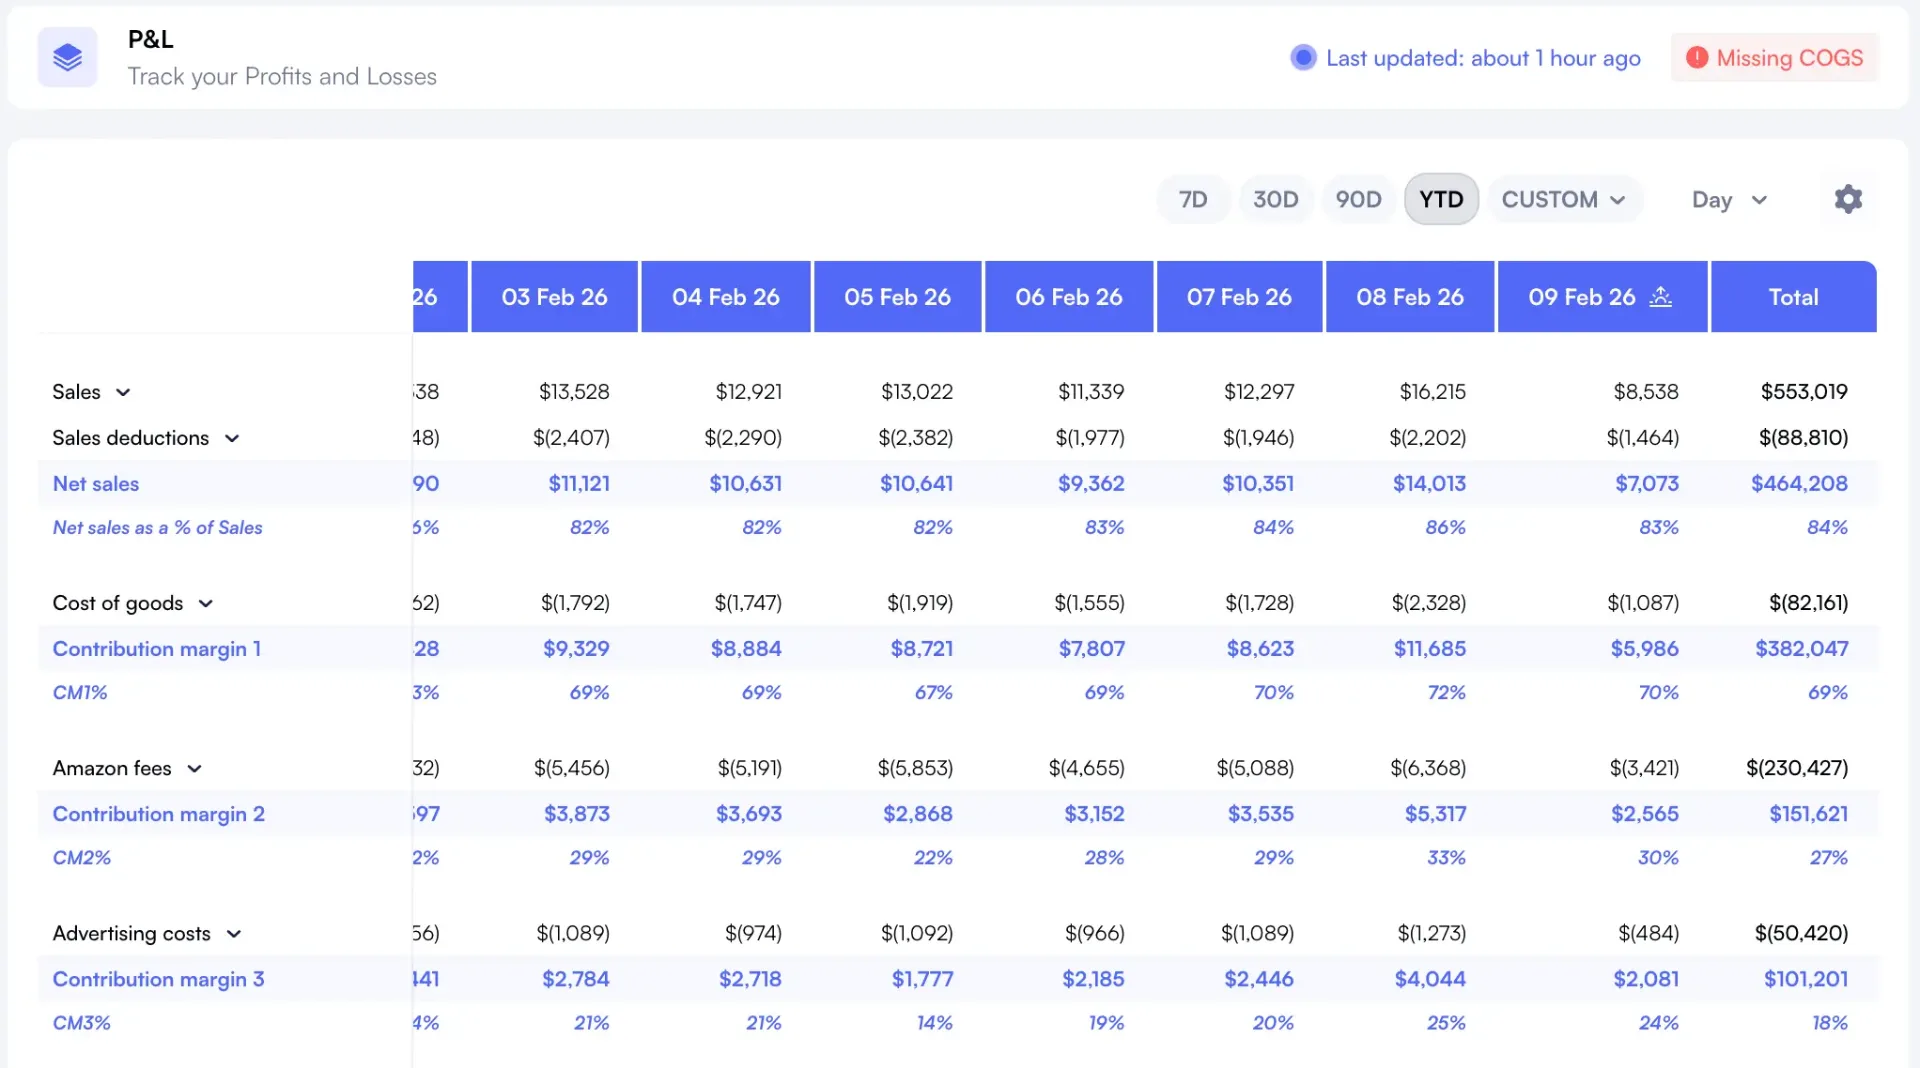
Why it matters: Revenue can stay flat while profit disappears. Fee increases, return rate spikes, and gradual cost creep erode margins invisibly unless you track them daily. Nova's P&L Dashboard shows margin trends alongside revenue.
6Return Rate Anomalies
What to check
Products with return rates significantly above their baseline. Focus on products with 5+ returns in the past week.
Investigation trigger
Return rate doubles baseline OR 3+ returns on same product in 24 hours. Check recent reviews for quality issues.
Time required: 2 minutes
Why it matters: High return rates destroy profitability and can trigger account health reviews. Catching return spikes early lets you investigate before patterns become problems. E-commerce return rates average 17.6%, but category variations are huge. Learn more in our return rate analytics guide.
7Account Health Indicators
What to check
Negative feedback count, A-to-Z claims, listing suppressions, policy violations. Any new issues since yesterday?
Investigation trigger
ANY new suppression, policy warning, or A-to-Z claim. Address immediately to protect account standing.
Time required: 2 minutes
Why it matters: Account health issues escalate fast. A policy violation left unaddressed for a week can become a suspension. Daily checking means same-day response, which Amazon's algorithms favor when evaluating seller performance.
Time budget: the 10-minute morning review
Here's how to complete all seven checks in under 10 minutes. The key is discipline: check, note anomalies, move on. Investigation happens later.
Metric
Time
If Anomaly Detected
Revenue comparison
30 sec
Note for investigation later
Units by top products
1 min
Quick Buy Box check only
TACoS check
1 min
Flag for ad review
BSR changes
2 min
Compare to competitor activity
Profit margin trend
1 min
Check fee or cost changes
Return rate scan
2 min
Review recent feedback
Account health
2 min
Address immediately if critical
Total
~10 min
Pro Tip: Automate the dashboard view
Nova's Day-to-Day Performance dashboard displays all seven metrics on a single screen. You can complete your morning review by scanning one page instead of navigating through multiple Seller Central reports.
Tracking profit alongside performance
Revenue and unit checks only tell part of the story. Pairing your daily metrics with profit visibility ensures you catch margin compression before it costs you.
The P&L Dashboard shows true profitability at the product level, so you can quickly identify which SKUs are contributing to your bottom line.
Red flags that demand immediate action
Most anomalies can wait until your afternoon or weekly review. These five cannot. If you spot any of these during your morning check, address them before doing anything else.
1. Listing suppression on top-10 product
Every hour suppressed is lost sales. Investigate cause immediately. If it's a policy issue you can fix (image, claim, compliance), fix it now. If you need to appeal, start the process within the hour.
2. Account-level policy warning
Any new policy violation notification requires same-day response. Amazon's algorithm tracks response time. Fast acknowledgment and action plan improve resolution outcomes significantly.
3. Buy Box loss on high-velocity product
If you've lost Buy Box on a product selling 20+ units/day, you're losing $hundreds daily. Check if competitor dropped price (can you match?), if there's a listing hijack (report immediately), or if your metrics dropped (address cause).
4. Stockout on top-5 product
If inventory hit zero and you didn't know about it, your inventory tracking failed. Address the immediate issue (expedite shipment, switch to FBM backup) and then fix the process that let this happen.
5. Ad spend spike without corresponding sales
If yesterday's ad spend was 50%+ above average but sales were flat, something is broken. Pause the high-spending campaigns immediately while you investigate. You can always unpause them. You can't un-spend wasted budget.
Weekly vs daily: what belongs where
Not everything needs daily attention. Your morning check is for rapid detection of urgent issues. Deeper analysis belongs in your weekly review. Here's how to divide the work.
Daily Review
Weekly Review
Revenue and units vs. Same day last week
Week-over-week trend analysis
TACoS quick check
Deep PPC efficiency analysis
BSR changes on top products
Competitive positioning review
Margin snapshot
Product-level profitability analysis
Return rate anomalies
Root cause investigation for patterns
Account health scan
Performance improvement planning
Anomaly flagging
Strategic decisions and adjustments
Your daily check identifies problems. Your weekly review solves them and prevents future occurrences. Don't try to do both at once. Keep the morning review fast and focused.
Knowing what to check is easy. Actually checking it every day is the hard part. Here's how to make daily monitoring automatic.
Same time, every day
Pick a time and stick to it. Most sellers find the first 15 minutes of their workday ideal. Before you check email, before you start tasks, you scan your numbers. Make it the trigger for everything else.
One screen, all metrics
If you have to log into five different places to complete your check, you'll skip it. Consolidate your metrics into one dashboard. Nova's Day-to-Day dashboard shows all seven metrics in a single view, with orders and units arriving in real time.
Flag and move on
When you spot something unusual, resist the urge to investigate immediately. Write it down (or tag it in your dashboard) and move to the next metric. Investigate after you've completed the full scan. This prevents 10-minute checks from becoming 2-hour rabbit holes.
Pro Tip: Weekend coverage
Amazon sells on weekends. Problems don't wait until Monday. Do a quick 5-minute dashboard scan on weekend mornings to catch listing suppressions, account warnings, or major revenue drops before they compound.
Frequently asked questions
You don't have time not to. A 10-minute daily check prevents hours of firefighting later. Start with the top 3 metrics (revenue, TACoS, account health) if you're truly pressed. That's 5 minutes. Expand from there.
Start with your primary marketplace. If you have significant business in multiple regions, add a 2-minute scan of secondary marketplaces. Use a unified dashboard that shows all marketplaces to avoid logging in multiple times.
Use percentage thresholds rather than absolute numbers. A 15% revenue drop is significant whether you're doing $1K/day or $100K/day. The triggers listed above (15% revenue drop, 5-point TACoS increase, etc.) work across business sizes.
You can do basic checks in Seller Central, but it's slow and requires multiple reports. A dedicated dashboard like Nova consolidates everything into one view and adds historical context that Seller Central lacks.
Daily checks are for detection. Weekly reviews (typically 45-60 minutes) are for analysis and decision-making. If something in your daily check triggers investigation, schedule time for it later that day or add it to your weekly agenda.
Start your daily check routine tomorrow
Ten minutes a day. Seven metrics. That's all it takes to shift from reactive firefighting to proactive management. The sellers who scale successfully aren't smarter or luckier. They just see problems faster and act sooner.
Tomorrow morning, before you check email, run through the seven metrics. Note anything unusual. Then get on with your day knowing your business is on track. In a week, you'll wonder how you operated without this visibility.