SmartScout + Nova: The Ultimate Amazon Seller Stack in 2026
Most sellers use 5-8 tools. You really only need two. SmartScout for research. Nova for profit analytics. Here's why this stack beats every all-in-one platform.
Most Amazon sellers use 5-8 tools. You really only need two that do their jobs perfectly. One to find what to sell. Another to know if you're actually making money. Here's why SmartScout and Nova are the only stack you need in 2026.
Nova Handles profit analytics: SKU-level P&L, 40+ fee types, custom KPIs, and multi-account consolidation.
Zero overlap. SmartScout answers "what should I sell?" Nova answers "am I making money?"
Combined cost starts at $78/mo ($29 SmartScout + $49 Nova). Less than most all-in-one tools that do neither job well.
The Two-Tool Philosophy
The Amazon tools market is crowded. Helium 10 alone offers 30+ features. Jungle Scout bundles research, tracking, and inventory management. The pitch is always the same: one tool to rule them all.
Here's the problem. All-in-one tools spread thin. Their research is decent but not deep. Their analytics are basic. Their P&L is an afterthought. You end up paying $300/mo for a tool that does 10 things at 60% quality instead of two tools that each do one thing at 100%.
The math is simple. SmartScout Essentials ($29/mo) + Nova Starter ($49/mo) = $78/mo. That's less than Helium 10 Diamond ($279/mo) and you get deeper research AND deeper analytics. No compromise on either side.
This isn't about minimalism for its own sake. It's about using tools built by teams that obsess over one problem. Scott Needham built SmartScout because he wanted the deepest Amazon research data available. We built Nova because we wanted the most accurate P&L on the market. Neither of us tried to do both.
Research Question
"What should I sell?"
SmartScout answers this with subcategory analysis, brand hunting, Traffic Graph, and Keyword Detective.
Profit Question
"Am I making money?"
Nova answers this with SKU-level P&L, 40+ fee types, custom KPIs, and real-time sales.
SmartScout: The Deepest Amazon Research Platform
Founded by Scott Needham. Used by thousands of Amazon sellers for product research and market intelligence.
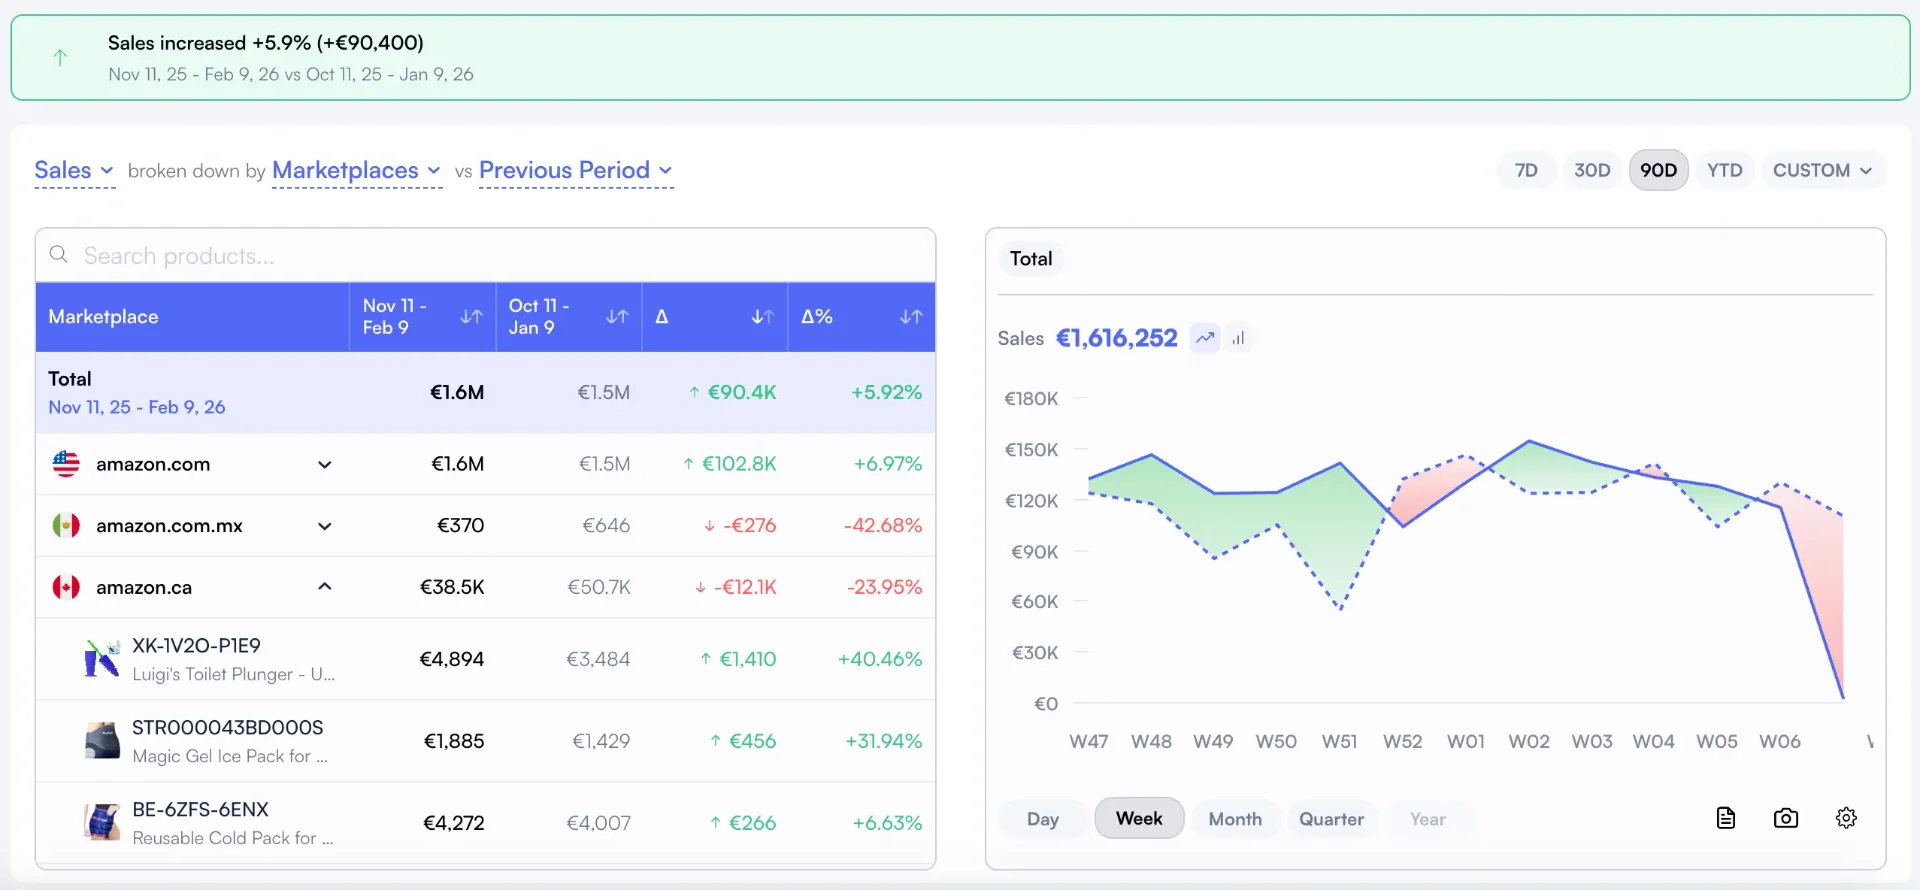
SmartScout isn't a typical keyword tool. It's a market intelligence platform that maps the entire Amazon ecosystem. You can see estimated revenue at the subcategory level, identify underserved niches, spy on competitor ad strategies, and trace traffic patterns between products.
Core Capabilities
Feature
What It Does
Why It Matters
Subcategory Analysis
Breaks Amazon into 40,000+ subcategories with estimated revenue, brand count, and competition levels.
Find niches where demand exceeds competition. Most tools only show top-level categories.
Brand Hunting
Maps every brand on Amazon with estimated revenue, product count, and growth trajectory.
Identify brands ripe for acquisition, wholesale opportunities, or competitive gaps.
Ad Spy
Reveals competitor Sponsored Products, Sponsored Brands, and Sponsored Display placements.
See exactly which keywords competitors bid on and where their ads appear.
Traffic Graph
Visualizes how shoppers move between products, showing "frequently bought together" and "also viewed" connections.
Validate demand by seeing actual traffic patterns, not just search volume estimates.
Keyword Detective
Reverse ASIN lookup plus keyword discovery with click share data.
Find high-intent keywords your competitors rank for that you're missing.
AI Listing Architect
AI-powered listing creation based on keyword data and competitive analysis.
Create optimized listings from day one using data, not guesswork.
Seller Map
Geographic map of all Amazon sellers worldwide with estimated revenue and marketplace data.
Identify regional competition patterns and sourcing hotspots for wholesale or arbitrage.
UPC Scanner
Bulk import product lists (UPC/EAN) to instantly see Amazon pricing, fees, and profitability estimates.
Essential for wholesale and retail arbitrage sellers evaluating large product catalogs quickly.
Search Terms Relevancy
Analyzes search term targeting and relevancy scores for any product or keyword.
Optimize PPC targeting by understanding which search terms actually convert for your category.
FBA Calculator
Built-in ROI calculator that estimates FBA fees, referral fees, and net margin for any Amazon product.
Validate product viability before committing inventory. Quick go/no-go decisions on new ASINs.
Pricing: Essentials at $49/mo, Plus at $97/mo, Business at $187/mo. Annual plans save 30%. All plans include the core research database. Higher tiers add Ad Spy, Traffic Graph, and advanced filters.
Nova: The Most Accurate Amazon P&L on the Market
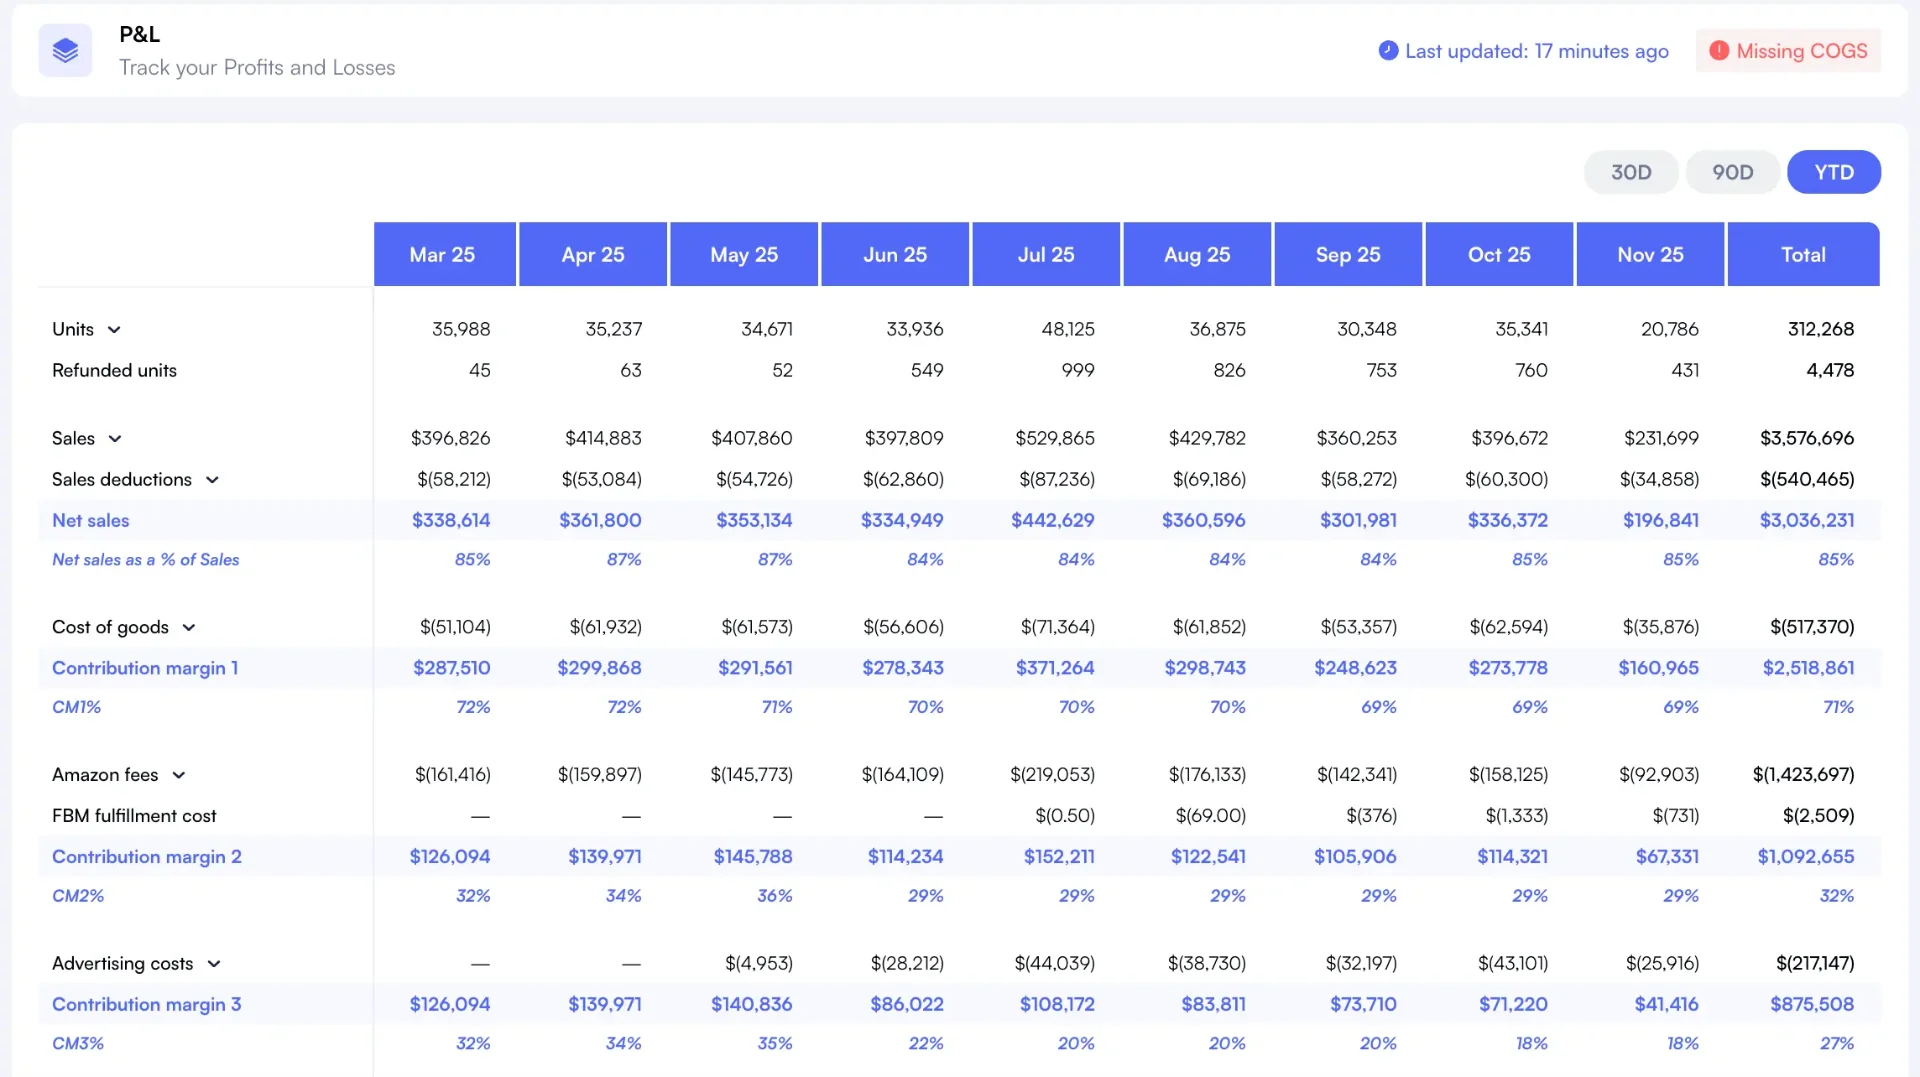
Nova's P&L analytics track every cost Amazon charges or reimburses. Not 15 fee types. Not 25. All 40+ Amazon fee types across 200+ individual report rows, attributed to every SKU. That's 99.9% accuracy, validated against SP-API settlement reports.
Nova's P&L dashboard: every Amazon fee tracked, every SKU profitable or not. See the full P&L →
Accuracy
99.9%
All Amazon fees tracked. None missing.
Data Refresh
30 min
Near real-time. Not daily. Not weekly.
Marketplaces
23
Every Amazon marketplace, one dashboard.
What Makes Nova Different
Unlimited custom KPIs: build any metric you need. Contribution margin per unit, TACoS by brand manager, net margin after returns by marketplace. No limits.
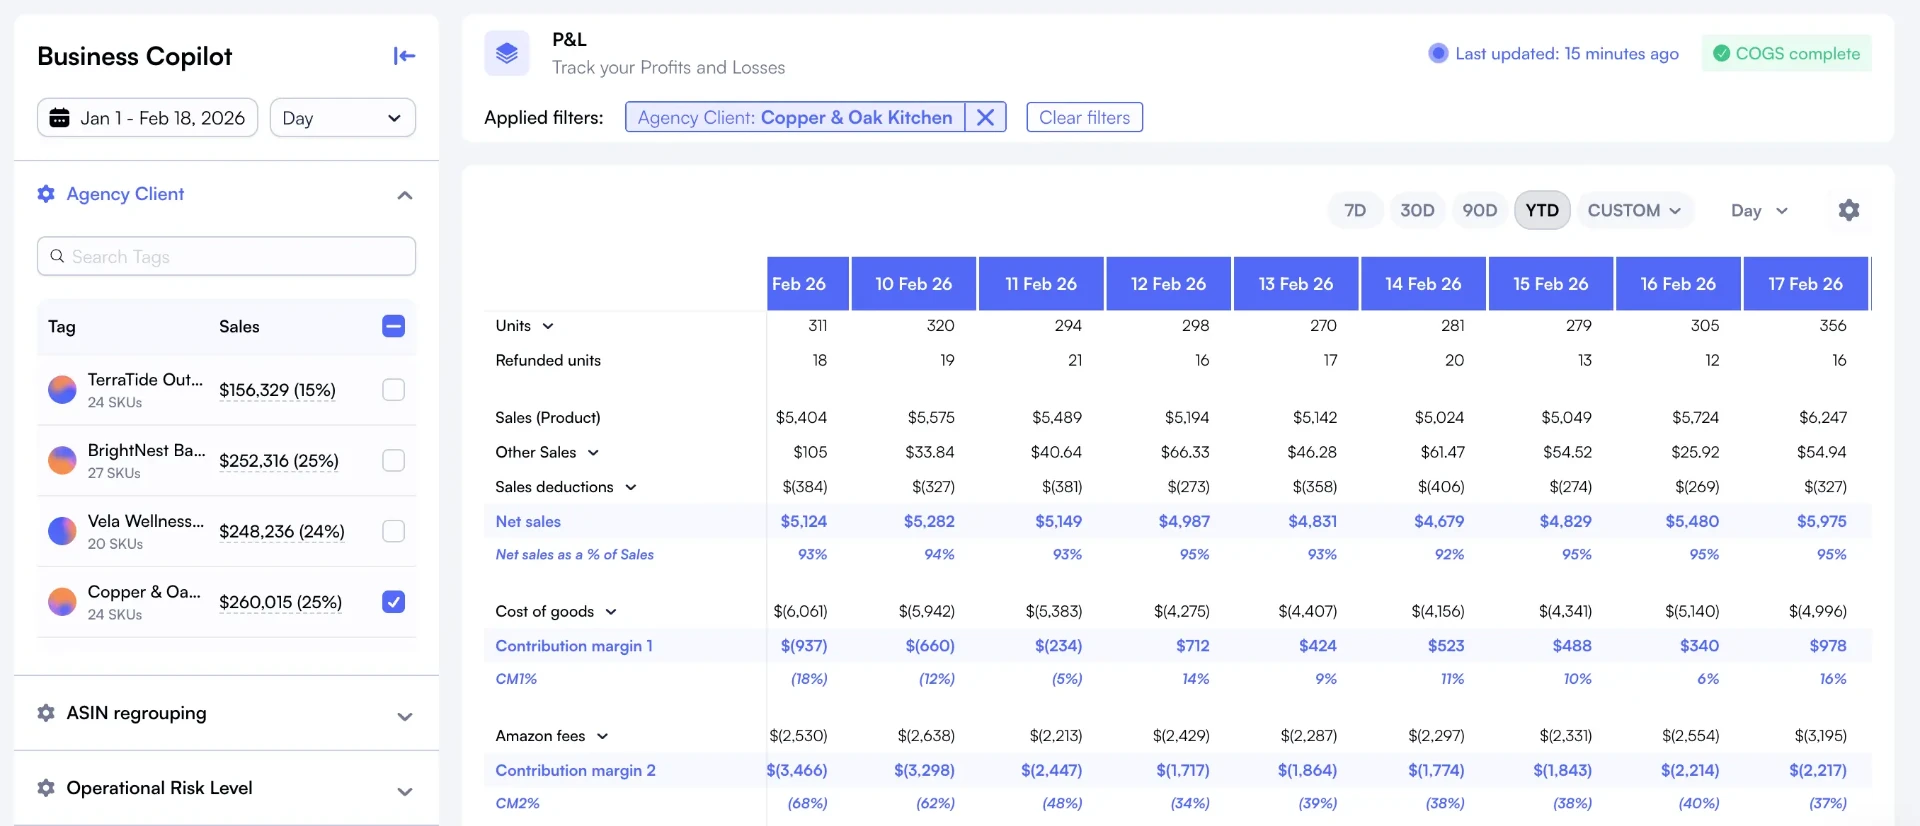
Multi-account consolidation: Roll up 100+ Seller Central accounts into one unified P&L. Agencies and aggregators use this daily.
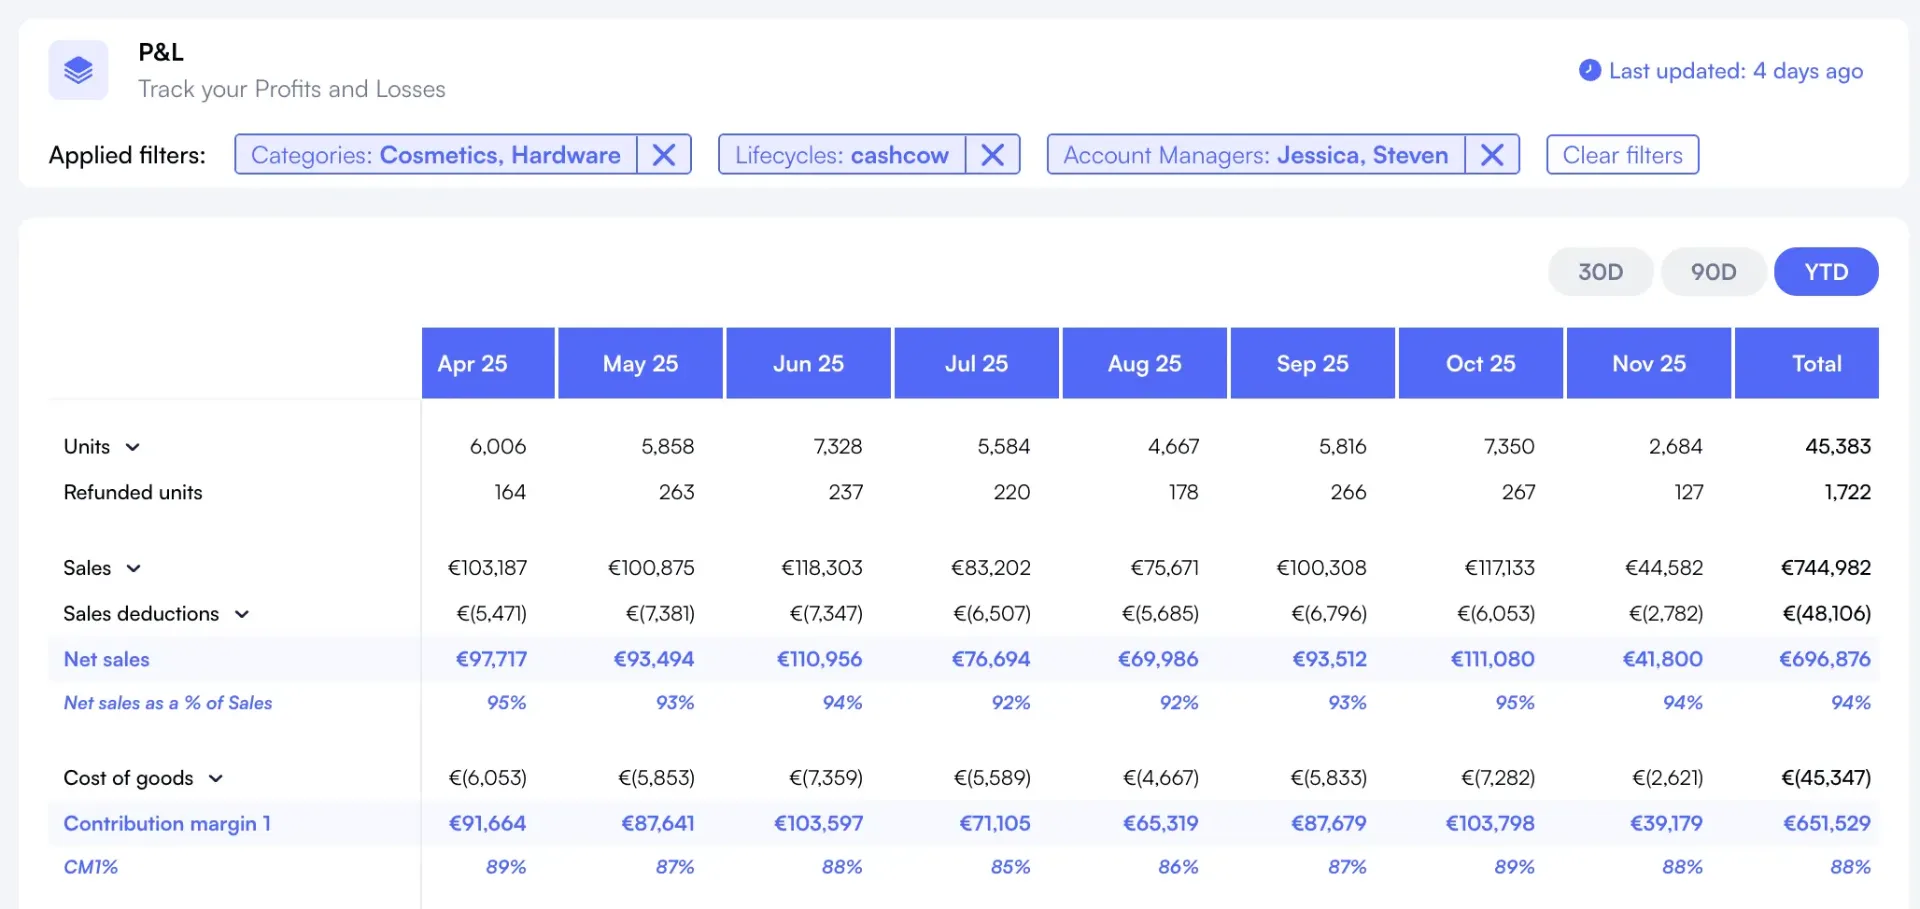
Custom segmentation:Tag products by lifecycle stage, brand manager, price tier, or any custom dimension. Filter your entire P&L by any segment.
Filter your P&L by any dimension: SKU, ASIN, marketplace, brand, lifecycle stage, or custom tags. Explore Product Tagging →
Multi-account consolidation: roll up 100+ Seller Central accounts into one unified view. See Agency Features →
The Workflow: How to Use Both Tools Together
Here's what a complete product lifecycle looks like when you pair SmartScout with Nova. No gaps, no guesswork.
Phase 1: Discovery (SmartScout)
Use SmartScout's subcategory analysis to find niches with high revenue and low brand count. Look for subcategories where the top 10 brands don't dominate more than 60% of revenue.
Example: you find "Kitchen Silicone Baking Mats" with $12M estimated monthly revenue and only 3 brands above $500K/mo. Opportunity confirmed.
Phase 2: Validation (SmartScout)
Run Traffic Graph on the top 5 products in your target niche. Check "frequently bought together" patterns. Use Keyword Detective to identify the top 20 search terms and their click share distribution.
Example: Traffic Graph shows the top product gets 35% of niche traffic. The remaining 65% is split among 40+ products. Room to compete.
Phase 3: Competitive Intel (SmartScout)
Use Ad Spy to see which keywords the top sellers bid on. Map their Sponsored Products and Sponsored Brands placements. Identify gaps where they're not advertising.
Example: Top competitor bids on 45 keywords but ignores long-tail variations. You find 12 keywords with decent volume and zero Sponsored Products competition.
Phase 4: Launch & Track (Nova)
Product is live. Connect your Seller Central to Nova. Within 30 minutes, you see your first P&L data. Every fee tracked. Set up custom KPIs: contribution margin per unit, TACoS, net margin after returns.
Example: Day 1 shows $2,400 revenue, $1,680 in costs (referral + FBA + PPC + inbound placement). Your actual margin is 30%, not the 45% you estimated in your spreadsheet.
Phase 5: Optimize (Nova)
Use Nova's Winners & Losers to identify which SKU variations are profitable and which are bleeding money. Tag products by launch cohort to track profitability over time.
Example: after 60 days, your 3-pack variation has 38% margin. Your single-pack is at 12% margin after PPC. You shift budget to the 3-pack and pause the single.
Worked example: research and profit answer different questions
Illustrative, not a customer. A home goods seller wants to expand into a new subcategory. Research tools tell them how big it is and how contested. Nothing in that answer tells them what a unit will actually earn once it ships.
What research answers
Subcategory size and growth
How concentrated the sellers are
Which brands hold share today
Whether the price point is defensible
What profit tracking answers
Contribution per unit after every fee
Inbound placement and storage, booked to the SKU
What returns actually cost this product
Whether ad spend is funded by the margin
The gap that bites: a margin estimated on referral and FBA fees alone ignores inbound placement, storage and returns. On a launch shipping a few thousand units a month, those three lines are easily a few thousand dollars, which is the difference between a launch that funds itself and one that quietly does not.
Scott is an Amazon veteran who built SmartScout to solve a problem he experienced firsthand: existing research tools showed search volume and reviews, but couldn't map the actual money flowing through Amazon's subcategories. SmartScout was born from the idea that sellers need revenue-level intelligence, not just keyword data.
"Most sellers rely on gut instinct or surface-level data to pick products. SmartScout gives you the revenue map. But finding a great product is only half the battle. You need to know if it's actually profitable after Amazon takes its cut. That's why I recommend pairing research with a dedicated profit tracker."
SmartScout vs Nova: Feature Comparison
This table isn't about which tool is "better." They solve completely different problems. That's the point.
Capability
SmartScout
Nova
Product Research
✓ Core feature
,
Subcategory Revenue Data
✓ 40K+ subcategories
,
Competitor Ad Intelligence
✓ Ad Spy
,
Traffic Pattern Analysis
✓ Traffic Graph
,
Seller Map & Geo Data
✓ Global map
,
UPC/Bulk Product Scanning
✓ UPC Scanner
,
SKU-Level P&L
,
✓ 40+ fee types
Custom KPIs
,
✓ Unlimited
Near Real-Time Refresh
,
✓ 30-min
Multi-Account Consolidation
,
✓ 100+ accounts
Keyword Research
✓ Keyword Detective
,
COGS & Landed Cost Tracking
,
✓ Per SKU
Starting Price
$29/mo
$49/mo
Notice the pattern? Zero overlap. Every checkmark is in one column or the other. That's what makes this stack work. You're not paying for duplicate features.
Try Both Tools
SmartScout and Nova both offer free trials. You don't need a credit card for either. Start with research, then connect your analytics. Want to explore more combinations? Check our directory of 150+ Amazon seller tools to find tools that complement your stack.
Start with SmartScout
Find your next winning product. Subcategory analysis, brand hunting, and competitor intelligence.
Common questions about the SmartScout + Nova stack
They're independent tools that solve different problems. SmartScout connects to Amazon's product catalog for research data. Nova connects to your Seller Central for financial data. No integration needed because they don't overlap.
Absolutely. Each tool works independently. But together, they cover the full product lifecycle from discovery to profitability tracking. Most sellers who try both keep both.
Helium 10 and Jungle Scout are all-in-one platforms that cover research, listing optimization, PPC, and basic analytics. SmartScout goes deeper on research (subcategory revenue data, Traffic Graph). Nova goes deeper on profit analytics (40+ fee types, custom KPIs, multi-account). You get best-in-class at both, for less money.
Correct. If you need PPC automation, add a dedicated tool like Perpetua or Pacvue. But research + profit analytics covers 80% of what most sellers need. PPC tools are the optional third piece, not the foundation.