Amazon International Expansion - Which Marketplace to Launch Next
Amazon runs 23 seller-facing marketplaces. This guide is the framework Nova sellers use to rank candidate countries, model fees and VAT before launch, read the first 90 days in profit data, and pull the plug fast when a market is not working.
Amazon runs 23 seller-facing marketplaces. Most sellers pick their next one on gut feel: the country their friend just launched in, the market with the biggest headline TAM, or the one with the fewest compliance forms. Three months later the P&L tells the truth. This guide is the framework we use with Nova sellers to rank candidate marketplaces, read the first 90 days of profit data, and pull the plug fast when a market is not working.
TL;DR - Key Takeaways
•Rank marketplaces by expected 90-day contribution margin, not by TAM. A smaller market with lower fees and easier compliance often beats a big market with a rough fee structure.
•Fee deltas between marketplaces are larger than most sellers assume. Storage in Germany runs 40-60% higher than the US per equivalent cube in Q4, and Japan uses different weight bands entirely.
•The first 90 days follow a predictable shape: cold-start (0-30 days), diagnostic (31-60), commit-or-cut (61-90). Set the kill criteria before launch, not after.
•In the EU, start with EFN to prove demand. Switch to MCI or Pan-EU only when volume justifies VAT registration in up to 7 countries.
•Currency drag is real. Accepting the Amazon Currency Converter default costs 1-2% on every disbursement. Local-currency accounts remove most of it.
Our take
Before you launch a new marketplace
Build a one-page model per candidate country: gross price after local VAT, referral %, FBA per-unit and monthly storage, expected promo and PPC load, and a 20% cushion for returns and account-level fees. Anything that does not clear 15% contribution margin per unit before COGS is not ready to launch; it is a P&L problem hiding behind a growth story.
Best fit if
•Established sellers in one Amazon marketplace evaluating their next country
•Aggregators and multi-brand operators picking which brand-country pairs to prioritize
•Agencies advising clients on expansion sequencing
Skip if
•First-time Amazon sellers still validating product-market fit in their home marketplace
•Sellers whose home-market P&L is not yet reconciled to bank deposits
The 23 marketplaces, grouped by expansion difficulty
Not every marketplace costs the same to launch into. The compliance and operational lift ranges from "a weekend of admin" (EU-to-EU inside the customs union) to "a six-month project" (Japan, India, Brazil). A useful first pass is to bucket the 23 marketplaces by expansion friction, then rank inside each bucket on demand and fees. The Amazon Global Selling directory is the current source of truth for which marketplaces are open and which require additional approvals.
8-16 weeks. Local entity often needed, category restrictions common
Very high (barrier markets)
JP, IN, BR
12-24 weeks. Local entity, native-language listings, tax counsel required
Nova insight
Do not treat "Europe" as one market. It is not. Germany and the UK together are 80% of EU Amazon revenue; France, Italy, Spain, Netherlands are the next tier; the rest are long tail. If your product only works economically in one or two of them, Pan-EU is a trap because you pay to hold inventory in seven. Model each EU country as its own market first, then decide which fulfillment mode fits.
Demand signals worth checking before you commit
Before running the fee model, confirm the market wants your product. Three signals do most of the work:
Comparable ASINs and their BSR range. Pull the top 30-50 ASINs in your exact subcategory in the target marketplace. If the median BSR is above 100,000, category velocity is thin and Amazon PPC will burn cash keeping you visible.
Review counts on the top 10 competitors. A category where the leader has 500 reviews is enterable in 6 months. A category where the leader has 25,000 reviews is a multi-year commitment or a niche play.
Local search demand. Native-language search volume for your top 5 keywords. Google Trends is the free proxy; a keyword tool with the target country database is the paid one.
A market that fails any two of these signals rarely rescues itself with more launch budget. Move it down the list and come back when the category matures or a competitor exits.
Fee deltas: where the P&L actually breaks
Same product, same price, same weight, wildly different unit economics. FBA fulfillment, monthly storage, referral percentages, and the newer aged-inventory and low-inventory-level fees are all set per marketplace. Two numbers to watch:
Storage per cubic foot equivalent in Q4. This is where German and Japanese storage bills quietly wreck margin on bulky-but-slow SKUs. Model 6 months of storage before you ship the first unit.
Referral percentage in your category. Most categories are 8-15% and consistent across marketplaces, but a few (jewelry, Amazon Devices accessories, some grocery subcategories) differ enough to matter.
VAT and product-safety compliance are the two costs sellers underestimate most. On tax, the UK and each EU country require their own VAT registration if you hold inventory there, and IOSS covers cross-border consignments up to 150 EUR into the EU. HMRC's guidance for overseas sellers is the working reference for UK obligations.
On product safety, the EU General Product Safety Regulation (GPSR) came into force in December 2024 and requires a named EU-based Responsible Person, manufacturer contact details on every listing, and clear traceability information. The text of Regulation (EU) 2023/988 on EUR-Lex lays out the obligations. Amazon suspends listings that fail GPSR compliance, so this is a launch blocker, not a nice-to-have.
Track profit per marketplace, per SKU, in one view
Nova pulls Amazon settlements for all 23 marketplaces and normalizes fees, promos, and FX into a single P&L. 14-day free trial, no card.
In North America and Asia Pacific, the choice is FBA versus FBM per SKU (see the FBA vs FBM guide for the framework). In Europe, there is a third dimension: which countries hold your FBA inventory.
EFN (European Fulfillment Network): inventory in one country, cross-border shipping fees on orders from other EU marketplaces. Slowest delivery, thinnest VAT footprint (one country). Best for testing.
MCI (Multi-Country Inventory): you pick 2-5 countries to hold stock in. Faster delivery, VAT in each. Best for the 60-90 day expansion phase.
Pan-EU: Amazon distributes inventory across up to 7 EU countries automatically. Lowest fulfillment fees, fastest delivery, Prime everywhere, but VAT registration and filings in every storage country. Best for mature multi-market sellers.
Reading the first 90 days in profit data
A launched marketplace tells you whether it is going to work inside 90 days. The signal is in three windows:
Days 1-30: cold-start
Near-zero organic sessions. PPC is 60-90% of sales. ACoS looks terrifying. Unit contribution margin is often negative because you are funding launch promotions and coupons. This window is not diagnostic on its own; it is expected. What matters is that PPC is delivering unit velocity so the Amazon algorithm sees the ASIN as active.
Days 31-60: diagnostic
Is organic session share growing week-over-week without more ad spend. Is unit session percentage within 10-20 points of your home-market benchmark. Is contribution margin per unit trending toward the model (still often negative after PPC but closing the gap). If any of those three lines is flat, the fix is usually not more ad spend; it is a listing, price, or pack-size problem.
Days 61-90: commit or cut
By day 90, contribution margin after Amazon fees (before COGS) should be positive on more than half your active ASINs and organic share of sales should be above 20%. If both are true, invest: broaden the ASIN set, deepen inventory, expand PPC. If either is missing, cut spend, drain inventory, and either delist or move to FBM to test at a lower cost base.
Kill criteria
Write the kill criteria before you launch, not after. A one-line rule works: "If contribution margin per unit is negative on more than half of active ASINs and organic share is under 20% by day 90, we pause the market." Sellers who set this rule up front cut losing markets in months. Sellers who do not can spend a year proving a market that was never going to work.
Currency exposure
Every disbursement Amazon converts from local currency to your home currency at a rate typically 1-2% worse than mid-market. On 100,000 EUR of annual EU revenue that is 1,000-2,000 EUR of quiet margin bleed. Opening a local-currency business account (Wise, Airwallex, Payoneer, or a local bank) and telling Amazon to settle in native currency cuts most of it. Track realized FX as its own line in the P&L; it moves quietly and it compounds.
How Nova reports on all 23 marketplaces
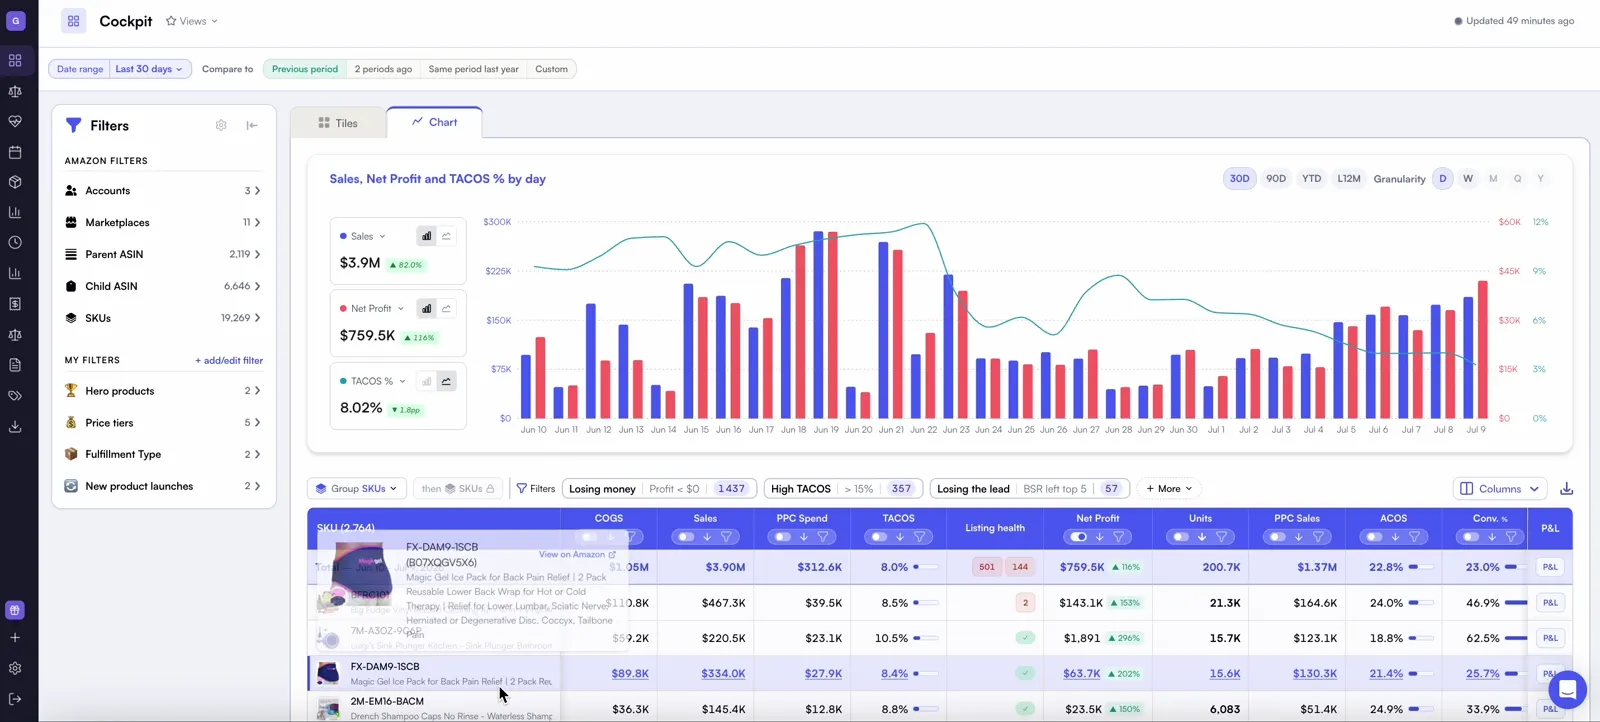
Nova unifies fees, promotions, refunds and FX across every connected marketplace into one P&L.
Nova pulls the settlement report on every cycle for every connected marketplace and normalizes fees, promos, refunds, and reserves into one per-SKU P&L. You can slice by marketplace, tag ASINs into brand or portfolio segments via Custom Breakdowns, and reconcile country-level performance in the same view (see the multi-marketplace analytics guide for the operating flow, and the cross-marketplace reporting guide for the reporting workflow).
For the pre-launch unit-economics model, the unit economics guide is the starting point. For the monthly view once a marketplace is live, the monthly P&L template is the format most finance teams standardize on.
Frequently asked questions
Amazon operates 23 seller-facing marketplaces. Rank candidates by expected 90-day contribution margin: demand for your category (comparable ASINs and BSR range), fee delta versus your current market, and compliance lift.
Days 1-30 are cold-start and PPC-heavy. Days 31-60 diagnose whether organic sessions are compounding. By day 90, if organic share is under 20% and contribution margin is still negative before COGS, the market is not working.
Start EFN to prove demand, switch to MCI or Pan-EU once volume justifies the extra VAT footprint (Pan-EU forces registration in 7 countries).
The bottom line
International expansion is a data problem more than a growth problem. Pick the next marketplace on expected 90-day contribution margin, model the fee and VAT load before you ship a single unit, and write the kill criteria before launch. The sellers who compound across markets are the ones who cut losing markets fastest and reinvest in the ones the data is already telling them are working.
Ready to Transform Your Amazon Business?
Join thousands of successful sellers who use Nova Analytics to make data-driven decisions and maximize their profits.

 Claude
 Gemini
 ChatGPT