Pricing is the highest-leverage profit lever most sellers never revisit. Learn the 4 pricing models, how to A/B test prices, and how to track the actual profit impact of every price change.
•Pricing is the single highest-use profit lever for Amazon sellers. A $2 price increase on a $25 product can add $1.70 net to your margin per unit.
•Most sellers set prices once and forget them. Top performers run quarterly A/B tests using Manage Your Experiments and track the profit impact per SKU.
•Your pricing floor isn't just COGS + referral fee. It includes 40+ Amazon fee types, returns costs, and the 2026 fuel surcharge. Calculate the real number before setting prices.
•Amazon's April 2026 reference pricing crackdown means inflated 'List Prices' will be removed. Only genuine previous selling prices qualify as strikethrough references.
•Price differently across marketplaces. A $24.99 US product isn't EUR 24.99 in Germany. Factor in VAT, local fees, duties, and consumer expectations per market.
Ask most Amazon sellers about their pricing strategy and you'll get one of two answers: "I matched my competitor's price" or "I added a margin to my costs." Both approaches leave money on the table.
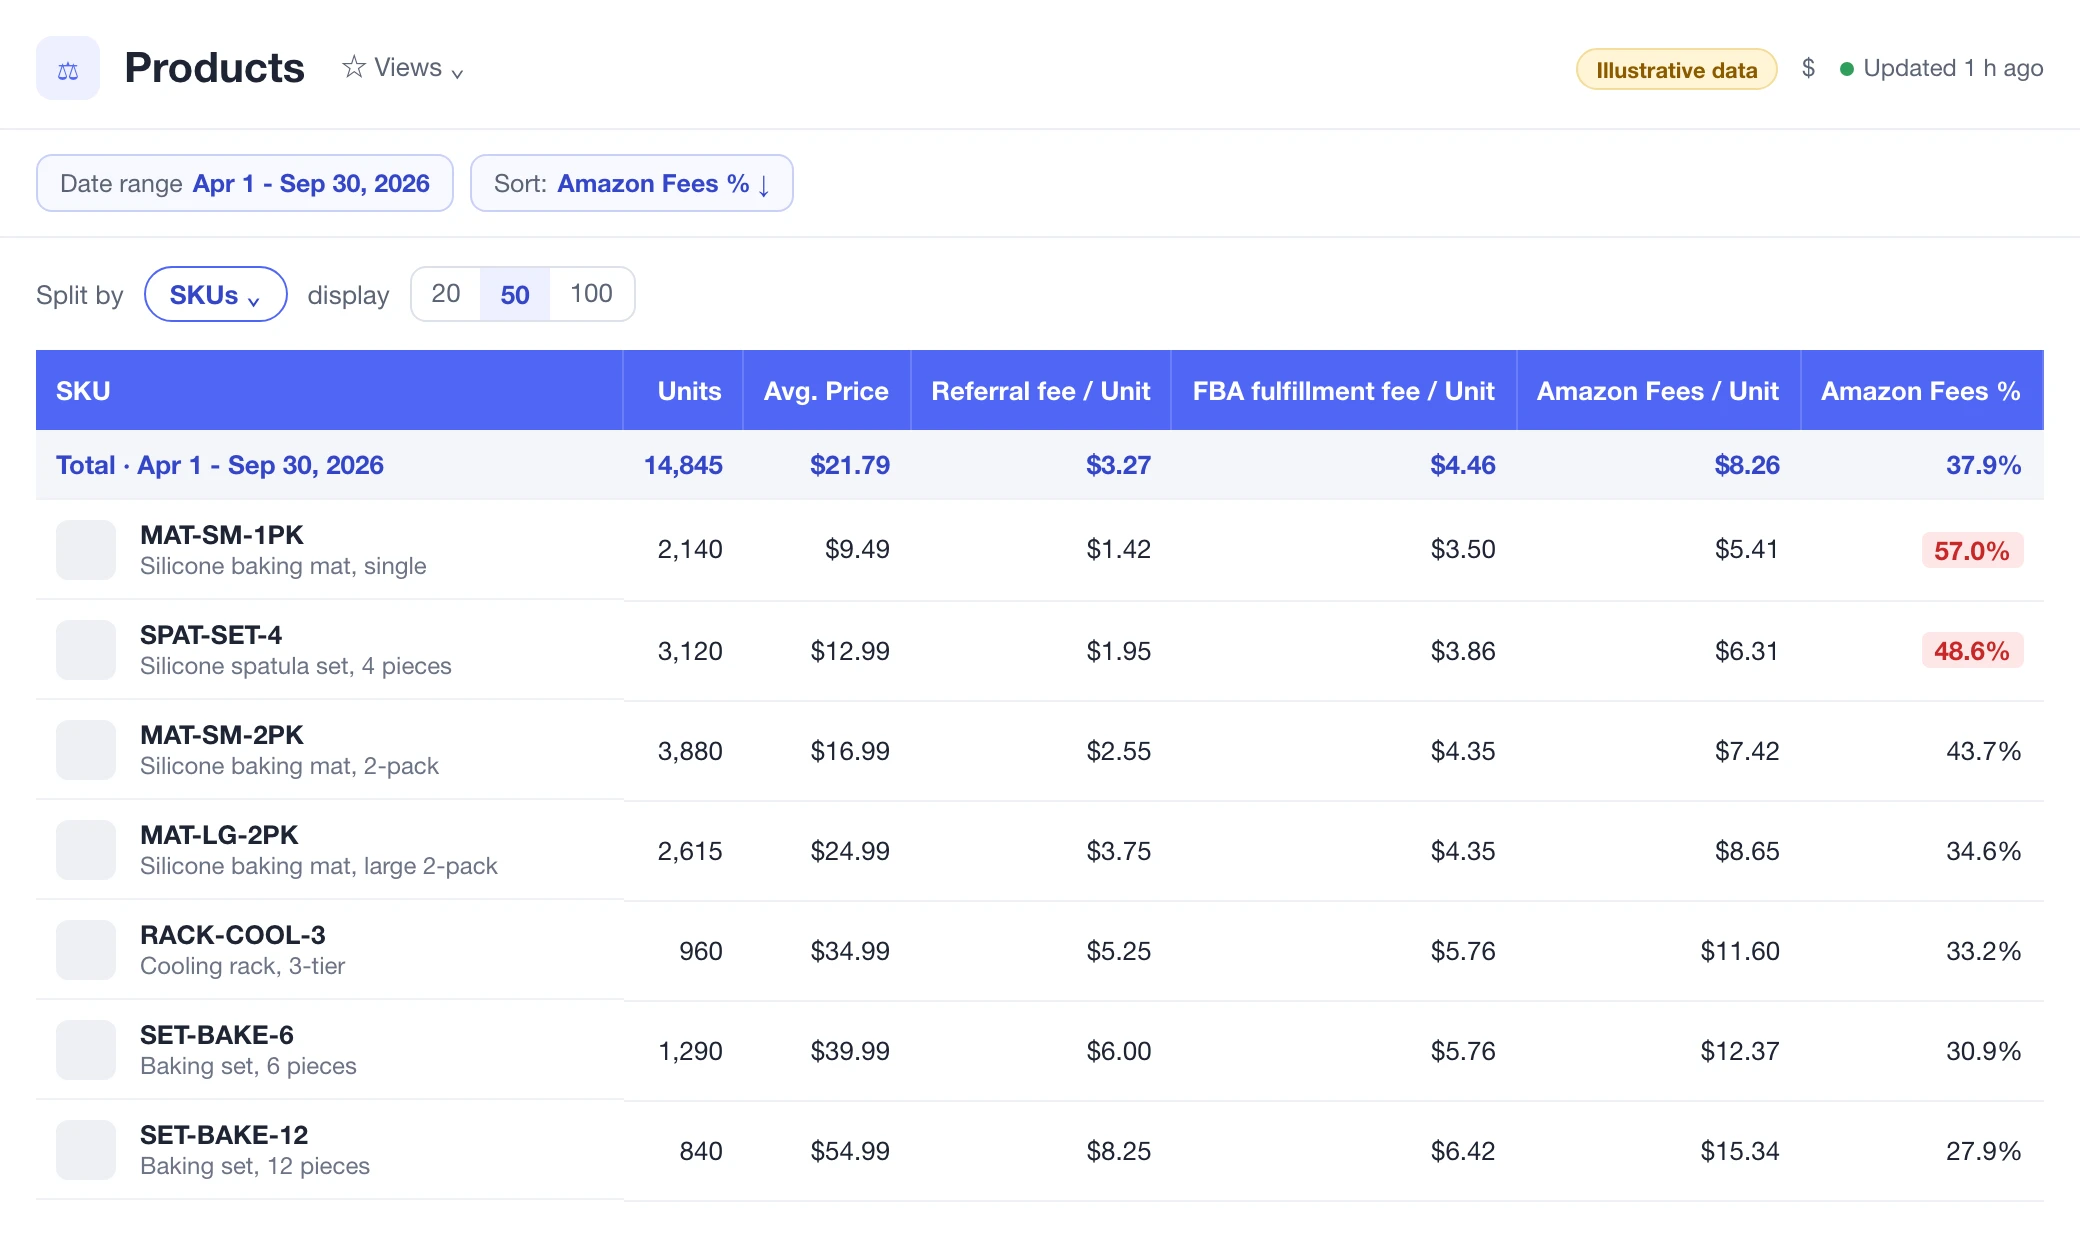
Compare fees per unit with their share of price before judging product profitability.
Pricing is the most powerful profit lever you have. It's the one variable that directly affects both your revenue and your margin on every single unit sold. Yet most sellers spend weeks optimizing listing images and keywords, then set their price in 5 minutes and never revisit it.
This guide covers the four Amazon pricing models, how to calculate your true pricing floor (including all 2026 fees), how to A/B test prices safely, and how to track whether a price change actually improved your profitability. No theory. Just the math, the process, and the data you need to make better pricing decisions.
Why Pricing Is the Highest-Use Decision Most Sellers Never Revisit
Consider two scenarios for a product selling 3,000 units per month at $24.99:
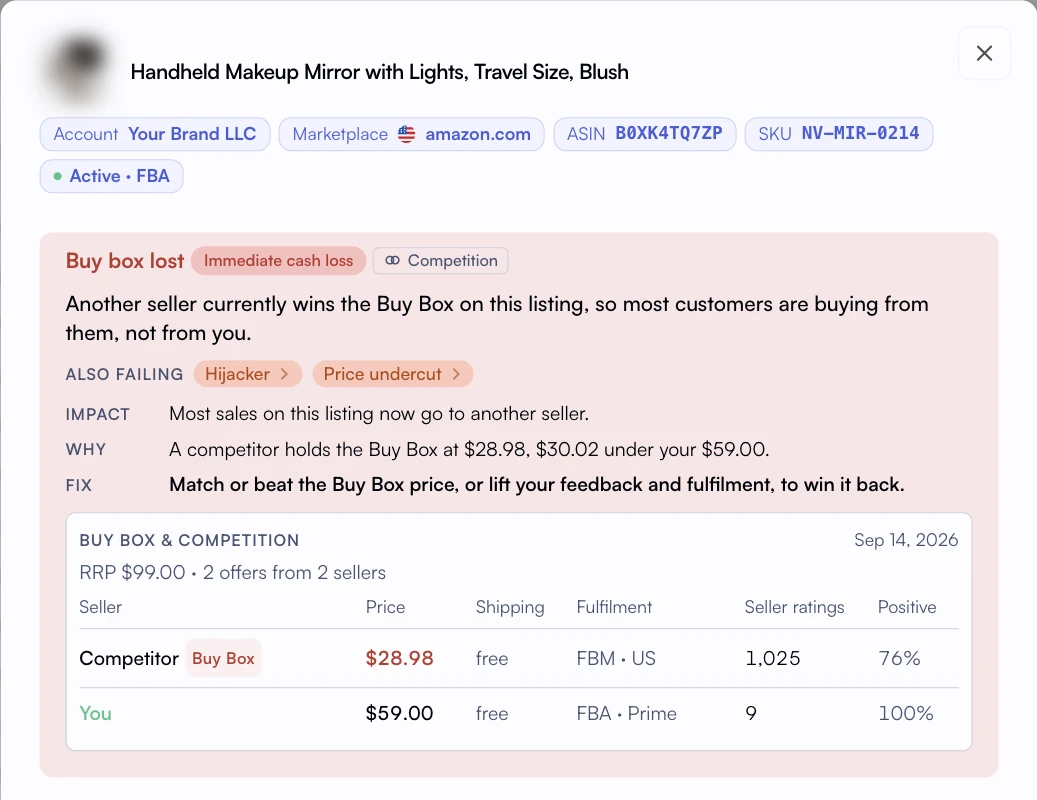
A lost Buy Box alert adds competitive price context to a pricing review.
Scenario A: Optimize PPC
+$1,500/mo
Reduce ACoS from 30% to 25% on $30K monthly ad spend. Saves $1,500.
Scenario B: Increase Price by $2
+$4,590/mo
$26.99 price adds $1.70 net margin per unit (after referral fee). Even with 10% fewer units (2,700), profit increases by $4,590.
The price increase generates 3x more profit than the PPC optimization. And it took zero additional ad spend. That's why pricing deserves more attention than most sellers give it.
According to McKinsey's pricing research, a 1% improvement in pricing yields an average 8-11% improvement in operating profit, more than equivalent improvements in volume, fixed costs, or variable costs.
The 4 Amazon Pricing Models
Every Amazon pricing decision falls into one of four approaches. Most sellers use cost-plus without realizing there are better options. Here's when each model works best.
Model
How It Works
Best For
Risk
Cost-Plus
COGS + fees + target margin = price
Commodity products, price-sensitive categories
Leaves money on the table if customers would pay more
Adjust prices based on demand, inventory, competition
High-volume resellers, seasonal products
Complexity; can trigger Amazon's fair pricing policy
The Hybrid Approach Most Top Sellers Use
Start with cost-plus to set your floor (the minimum price that hits your target margin). Then use value-based thinking to set your ceiling (what customers are willing to pay based on your reviews, images, and brand strength). Finally, A/B test between floor and ceiling to find the optimal point. This gives you the safety of cost-plus with the upside of value-based pricing.
How to Calculate Your True Pricing Floor
Your pricing floor is the absolute minimum price where you still make your target profit. Setting prices below this means you're losing money (or accepting less margin than your business requires).
Most sellers calculate their floor as: COGS + Referral Fee + FBA Fee + Target Profit = Minimum Price. But this misses a significant chunk of costs. The real formula needs to include all the variable costs covered in the Amazon Variable Costs Per Unit Guide. For a quick sanity check on a specific SKU, plug it into our free Amazon FBA calculator before locking in the floor.
Cost Component
Simplified (Wrong)
Complete (Right)
COGS (landed)
$6.50
$6.50
Referral Fee
$3.75
$3.75
FBA Fulfillment
$3.22
$3.22
Storage + Returns + Surcharges + Prep
Not included
$1.92
Total Variable Cost
$13.47
$15.39
Floor Price (at 15% margin target)
$15.85
$18.11
The simplified version suggests you could price as low as $15.85 and still hit your margin target. The complete version shows the real floor is $18.11. That's a $2.26 gap that, if ignored, means you're selling below your intended margin on every unit.
For the full breakdown of every fee Amazon charges in 2026, including the new fuel surcharge and low-inventory fees, see Amazon Seller Fees Explained 2026.
Price Elasticity on Amazon: How a $2 Change Can Swing Units 30%+
Price elasticity measures how much your sales volume changes when you change your price. On Amazon, elasticity varies wildly by category, price point, and competitive density.
Low Elasticity
2-8%
Unit change per $1 price move. Supplements, specialty foods, unique niche products.
Medium Elasticity
8-15%
Unit change per $1 price move. Home goods, kitchen, beauty, pet supplies.
High Elasticity
15-30%+
Unit change per $1 price move. Electronics, phone accessories, commodity products.
These numbers are directional. The only way to know your product's actual elasticity is to test it. But the pattern is clear: differentiated products with strong reviews and brand presence are less price-sensitive than commoditized products with many substitutes.
The Profit Math Behind Price Elasticity
A $2 price increase that causes a 10% drop in units is almost always profitable. Example: 3,000 units at $24.99 with $9.60 margin = $28,800 profit. After increase: 2,700 units at $26.99 with $11.30 margin = $30,510 profit. You sell fewer units but make $1,710 more per month. This is why testing is essential. The fear of losing volume often costs more than the volume you'd actually lose.
Amazon's Reference Pricing Rules (2026 Update)
Amazon uses "List Price" (or "Was Price") to display a strikethrough price next to your selling price. This creates the perception of a deal. When done legitimately, it can increase conversion rates by 10-20%.
In April 2026, Amazon significantly tightened enforcement of reference pricing rules. The reference pricing crackdown means:
Automated validation: Amazon's algorithms now cross-reference List Prices against actual selling history, both on Amazon and competing retailers.
Suppressed strikethroughs: If your List Price can't be substantiated, Amazon removes the strikethrough entirely. No warning, no notification.
Listing risks: Repeated violations can flag your listing for review and potential suppression.
What Not to Do
Don't inflate your List Price to create a fake discount. If your product sells at $24.99, setting a List Price of $49.99 won't work anymore. Amazon's systems will flag it and remove the strikethrough. Worse, if you've been running PPC campaigns that show the strikethrough in ad placements, those campaigns will suddenly convert worse when the reference price disappears. Build your pricing strategy on real value, not fake discounts.
How to A/B Test Prices Using Manage Your Experiments
Amazon's Manage Your Experiments tool lets you run controlled price tests on your listings. Here's the step-by-step process.
Step 1: Choose the Right Products to Test
Start with your top 10 SKUs by revenue. These have enough volume to reach statistical significance within 4-6 weeks. Products selling fewer than 100 units/month take too long to generate meaningful data.
Step 2: Set Your Price Variants
Test a $1-3 increase from your current price. Going too small (under $1) makes it hard to detect a real difference. Going too large (over $5) risks a significant conversion drop that could hurt your organic rank.
Step 3: Run for 4-8 Weeks Minimum
Amazon needs sufficient data for statistical significance. Don't end tests early because of short-term fluctuations. Seasonality, promotions, and competitive changes can all skew short-term results.
Step 4: Measure the Right Metrics
Amazon shows you units and revenue for each variant. But those aren't enough. You need to track profit per variant, not just revenue. A variant that generates 5% less revenue but 12% more profit is the winner. This is where A/B test tracking with P&L data becomes critical.
A/B Test Example: $24.99 vs. $27.99
Control ($24.99): 3,100 units/month, $9.60 margin = $49,760 monthly profit
Result: $3,016 more monthly profit despite selling 380 fewer units
Without per-SKU P&L tracking, you'd see "12% fewer units" and assume the test failed. With profit tracking, you see the $3,016/month gain. Nova's Brand History Inspector overlays experiment dates with daily P&L data so you can see the actual profit impact.
Tracking the Profit Impact of Price Changes
The biggest gap in most sellers' pricing process isn't setting the price. It's measuring what happened after the change. Revenue went up or down, units went up or down. But what about profit?
A proper before/after analysis needs to account for:
Changed return rate (higher prices sometimes attract more returns)
Changed ad economics (higher price means higher revenue per click, changing your ACoS)
Changed organic rank (if units drop enough, BSR and organic position can slip)
Changed contribution margin (the number that actually determines profitability)
This is why tracking pricing decisions against your product-level P&L matters. You're not just comparing revenue. You're comparing the bottom line before and after, with all the secondary effects included.
Pricing Across Marketplaces: US vs. UK vs. DE
If you sell on multiple Amazon marketplaces, your pricing strategy gets more complex. You can't simply convert USD to EUR and call it done.
Factor
US (amazon.com)
UK (amazon.co.uk)
DE (amazon.de)
VAT/Tax
No sales tax in price
20% VAT included
19% VAT included
FBA Fee Level
Baseline
~10-15% higher
~5-10% higher
Return Rate
Category dependent
Similar to US
Higher (14-day mandatory)
Consumer Price Sensitivity
Medium
Medium-High
High (price-conscious market)
Import Duties
Varies by product
Post-Brexit tariffs
EU common tariff
German consumers, for example, are significantly more price-sensitive than US consumers on Amazon. A product positioned mid-range in the US might need to be priced at the lower end in Germany to maintain similar conversion rates. The multi-marketplace analytics guide covers how to analyze performance across markets.
Marketplace Pricing Rule of Thumb
For European marketplaces, calculate your pricing floor per market (including local VAT, duties, and FBA fees), then research the top 5 competitors in that specific marketplace. Don't assume US pricing benchmarks apply. A $29.99 product in the US might need to be EUR 24.99 in Germany to be competitive, even though that's a lower price in USD terms. Use custom segmentation to tag products by marketplace and compare margins side by side.
Repricing Tools vs. Manual Pricing: When Each Makes Sense
Automated repricing tools adjust your prices based on rules you set, usually in response to competitor price changes. They're popular, but they're not always the right choice.
Approach
Best For
Risks
Automated Repricing
Wholesale/reseller models with Buy Box competition on shared ASINs. High SKU counts (500+) where manual pricing is impractical.
Race to the bottom. Can trigger Amazon's fair pricing policy. Doesn't factor in your actual margin per SKU.
Manual + A/B Testing
Private label sellers (you own the listing). Brand-registered products. Catalogs under 200 SKUs.
Slower to respond to competitive changes. Requires quarterly review discipline.
According to Feedvisor's marketplace research, 60% of top Amazon sellers use some form of repricing. But among private label sellers specifically, the percentage drops to under 30%. Private label sellers already own the Buy Box on their listings. An automated repricer optimizing for Buy Box ownership adds no value. What they need is profit-optimized pricing, which requires margin data per SKU.
10 Common Amazon Pricing Mistakes
Mistakes That Cost Real Money
Setting price once and never testing. Your COGS, fees, and competitive landscape change constantly.
Using gross margin for floor calculation. Ignoring 20+ fee types leads to pricing below your real break-even.
Racing to the bottom on price. The cheapest product rarely wins if it has fewer reviews and worse images.
Identical pricing across marketplaces. Each market has different fee structures, tax requirements, and consumer expectations.
Inflating List Price for fake discounts. Amazon's 2026 enforcement will suppress your strikethrough and potentially flag your listing.
Ignoring the referral fee impact. A $2 price increase doesn't add $2 to your margin. It adds $2 minus the incremental referral fee ($0.30 at 15%).
Not tracking profit after price changes. Revenue alone doesn't tell you if the change worked.
Changing prices too frequently. More than twice monthly on the same ASIN can trigger Amazon's algorithms.
Pricing based on competitor with different cost structure. Their COGS might be half yours. Their margin target might be different.
Forgetting seasonal fee changes. Q4 storage fees are 2-3x higher. Your pricing floor shifts during peak season.
Calculate your real pricing floor for your top 10 SKUs, including all fees, returns, and the 2026 surcharge.
Compare current prices to your floor. If any SKU is within 5% of the floor, you have almost no margin for error (or ads).
Pick 3 products to A/B test with a $1-3 price increase. Use Manage Your Experiments.
Set calendar reminders to check results at 4 weeks and 8 weeks.
Track profit, not just revenue. Use per-SKU P&L data to measure the actual impact of each price change.
Pricing isn't a set-it-and-forget-it decision. It's a continuous optimization loop: calculate your floor, test above it, measure the profit impact, and repeat. The sellers who treat pricing as an ongoing experiment consistently outperform those who set a price once and move on.