
Amazon Unit Economics
Revenue tells you how much came in. Unit economics tells you how much you kept. Learn to calculate true per-unit profit with the full waterfall from selling price to contribution margin.
Your Amazon business did $200K in revenue last month. But do you know which products actually made money on a per-unit basis? Most sellers don't. Revenue tells you how much came in. Unit economics tells you how much you kept.
TL;DR - Key Takeaways
- •Revenue-level tracking hides per-unit losses. A $50K/month product can lose money on every single unit sold.
- •Amazon sellers face 8-12 distinct cost lines per unit. Missing even one distorts your true margin.
- •The unit economics waterfall (selling price to CM3) is the only reliable way to evaluate SKU profitability.
- •Category benchmarks vary dramatically: Beauty margins can hit 35% while Electronics struggle past 15%.
- •Recalculate unit economics monthly and after every fee change, COGS shift, or ad spend adjustment.
Why Revenue-Level Thinking Fails Amazon Sellers
Here's a pattern we see constantly. A seller looks at their product catalog and sees a SKU generating $8,000 per month in revenue. They assume it's profitable. They scale ad spend. They order more inventory.
Six months later, they wonder why their bank balance hasn't grown despite 40% revenue growth. The answer is almost always the same: they never looked at what each unit actually costs to sell.
The Revenue Trap
According to Feedvisor's Amazon seller survey, 50% of Amazon sellers operate on net margins below 15%. Many don't realize which specific products are dragging down their overall profitability because they only track revenue at the account level.
Revenue-level thinking is dangerous because it treats all dollars equally. A $30 sale with 25% margin and a $30 sale with 3% margin look identical on a revenue dashboard. Unit economics strips away that illusion. It forces you to answer one question for every SKU: how much money do I keep after every cost is accounted for?
This matters even more in 2026. Amazon's fee structure keeps evolving, ad costs continue climbing, and COGS volatility from tariff shifts makes per-unit visibility essential. If you're making decisions based on top-line revenue, you're flying blind.
The Amazon Unit Economics Waterfall
Unit economics for Amazon sellers follows a waterfall model. You start with the selling price and subtract each cost layer until you reach your contribution margin (CM3). This is the number that tells you whether a product is worth keeping in your catalog.
| Step | Cost Layer | What It Includes | Typical Range |
|---|---|---|---|
| 1 | Selling Price | Your listed price (after any coupons or promotions) | Starting point |
| −2 | Referral Fee | Amazon's commission per category | 8-15% |
| −3 | FBA Fulfillment Fee | Pick, pack, ship, and customer service | $3.22-$6.00+ |
| −4 | Storage Fees | Monthly storage allocated per unit | $0.56-$2.40/cbft |
| −5 | Return Processing | Return rate x per-return cost (refund admin, restocking) | $2-5 per return |
| −6 | Ad Cost per Unit | Total ad spend / units sold (product-level allocation) | $1-8 per unit |
| −7 | COGS | Product cost, packaging, labeling | 20-40% of price |
| = | Contribution Margin (CM3) | Your true per-unit profit | $2-12 per unit |
Each of these layers is tracked separately by Amazon's systems, but Seller Central doesn't combine them into a single per-unit view. That's why most sellers end up building spreadsheets or using analytics tools to piece the picture together.
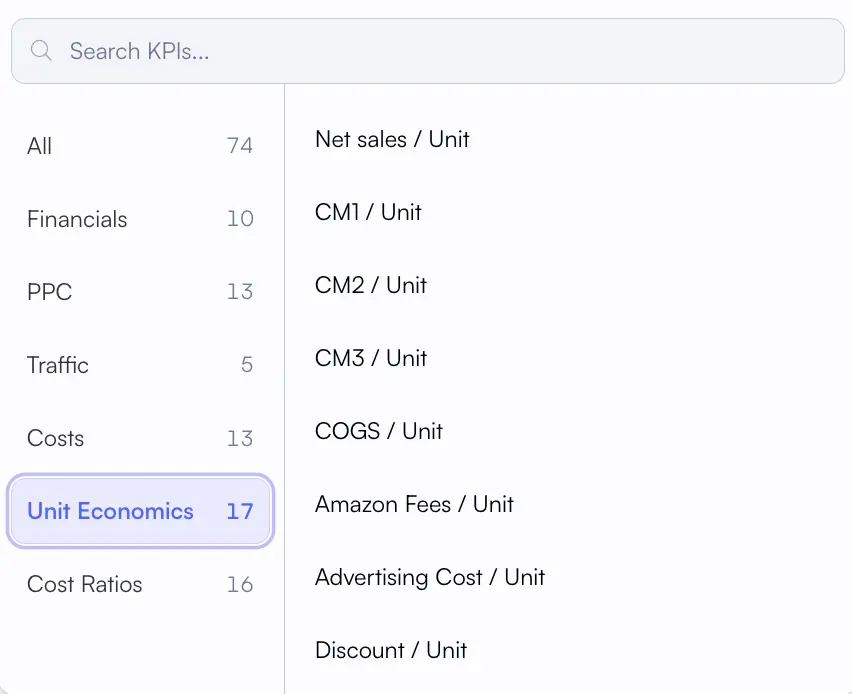
Nova's Unit Economics KPI Browser
Every cost line mapped automatically at the per-unit level. 17 metrics from selling price down to CM3, updated daily across your entire catalog.
Did You Know?
Amazon reports over 40 distinct fee types across its seller ecosystem. Most sellers only track 3-4 of them manually. The gap between what you track and what Amazon charges is where margin disappears.
Cost Lines Per Unit
8-12
Distinct fees and costs on every unit sold
Margin Erosion
60-75%
Of selling price consumed by fees, costs, and ad spend
Sellers Tracking Per-Unit
<20%
Of Amazon sellers calculate true per-unit profitability
Worked Example: $29.99 Kitchen Product
Let's walk through a real-world example. Say you sell a kitchen gadget at $29.99. It's a standard-size item in the Home & Kitchen category with a 15% referral fee. You sell 500 units per month and spend $1,200 on advertising. Your return rate is 8%.
| Line Item | Per Unit | % of Price | Notes |
|---|---|---|---|
| Selling Price | $29.99 | 100% | Listed price |
| Referral Fee | -$4.50 | 15.0% | Home & Kitchen rate |
| FBA Fulfillment | -$3.86 | 12.9% | Standard size, 1.2 lbs |
| Monthly Storage | -$0.42 | 1.4% | Non-peak, allocated per unit |
| Return Cost (8% rate) | -$0.32 | 1.1% | 8% x $4.00 avg return cost |
| Ad Cost per Unit | -$2.40 | 8.0% | $1,200 / 500 units |
| COGS | -$7.50 | 25.0% | Product + packaging + label |
| Contribution Margin (CM3) | $10.99 | 36.6% | Healthy margin |
This kitchen gadget looks healthy at $10.99 per unit (36.6% CM3). But change the return rate to 15% or bump ad spend to $2,500/month, and that margin drops to 28%. Small shifts in any cost line ripple through your entire unit economics.
Pro Tip: The Ad Cost Allocation Problem
Many sellers divide total ad spend across all units sold, but this oversimplifies. Products with different ROAS profiles need product-level ad cost allocation. A tool that tracks ad spend at the product level gives you accurate per-unit ad costs without manual spreadsheet work.
The 5 Cost Lines Most Sellers Miss
After working with hundreds of Amazon sellers, we consistently see the same cost lines getting overlooked. Each one seems small in isolation, but together they can eat 5-10% of your margin.
1. Return Processing Fees
Amazon charges a return processing fee on top of refunding the customer. For categories like apparel (25-40% return rate), this fee alone can destroy margins. You need to track your return rate by SKU and factor the per-unit return cost into your economics.
2. Storage Fee Seasonality
Q4 storage rates jump to $2.40/cubic foot (vs. $0.56-$0.87 off-peak). If you're calculating unit economics using average storage costs, you're underestimating costs during the most critical selling season. Track storage fees by period for accurate per-unit allocation.
3. Refund Administration Fee
When Amazon refunds a customer, you get back most of the referral fee, but not all. Amazon keeps a refund administration fee (the lesser of $5.00 or 20% of the referral fee). On low-price items, this hits hard.
4. Low-Inventory Level Fees
New in 2024 and updated for 2026, this fee penalizes sellers who keep less than 28 days of supply. It ranges from $0.32 to $2.09 per unit. If you're running lean inventory to save on storage, you might be paying more in low-inventory penalties. Check the 2026 low-inventory fee breakdown.
5. COGS Drift
Your supplier quoted $4.50 per unit last year. Currency shifts, tariff changes, and raw material costs have quietly pushed that to $5.20. If you haven't updated your COGS tracking Recently, your unit economics are built on stale data. Update COGS every time you place a new purchase order.
Get More Amazon Seller Tips
Subscribe to our newsletter for weekly insights, strategies, and market updates.
Unit Economics by Category: 2026 Benchmarks
Not all categories are created equal. A healthy margin in Electronics would be outstanding in Beauty. Understanding your category benchmarks helps you set realistic targets and identify where your products stand relative to peers.
| Category | Referral Fee | Avg. Return Rate | Typical Ad Cost/Unit | Target CM3 Range |
|---|---|---|---|---|
| Beauty & Personal Care | 8% | 5-8% | $1.50-3.00 | 25-35% |
| Home & Kitchen | 15% | 8-12% | $2.00-4.50 | 18-25% |
| Electronics | 8% | 10-15% | $3.00-8.00 | 10-18% |
| Grocery & Gourmet | 8-15% | 3-5% | $0.80-2.00 | 8-15% |
| Health & Household | 8-15% | 5-10% | $1.50-3.50 | 20-30% |
| Toys & Games | 15% | 10-18% | $2.50-5.00 | 15-22% |
These benchmarks come from aggregated seller data and industry research from Feedvisor. Your actual margins will depend on product specifics, competition, and how efficiently you manage each cost line. If you're tracking margins by category, compare your numbers against these ranges to spot outliers.
The Category Arbitrage Opportunity
Sellers with products across multiple categories can use unit economics to rebalance their portfolio. Shift ad budget toward high-CM3 products and tighten spend on low-margin SKUs. Your contribution margin data Guides where to double down and where to pull back.
From Spreadsheet to System
Most sellers start tracking unit economics in spreadsheets. You download reports from Seller Central, pull fee breakdowns, manually enter COGS, and calculate margins. It works until it doesn't.
The spreadsheet approach breaks down in three predictable ways:
- Stale data. You're working with last month's numbers. Fees changed, ad spend shifted, COGS updated. Your spreadsheet reflects a reality that no longer exists.
- Scale problems. With 50 SKUs across 3 marketplaces, you're maintaining 150+ per-unit calculations. Miss one fee update and the whole model drifts. Sellers managing large catalogs feel this pain acutely.
- No historical tracking. Spreadsheets show you a snapshot. They don't show you how your unit economics changed over the last 6 months or which cost lines are trending upward.
The alternative is a P&L analytics system that pulls fee data automatically, lets you enter COGS by SKU, and allocates ad spend at the product level. Nova does this across 21 marketplaces with data refreshing hourly. Instead of building spreadsheets, you're analyzing trends.
What to Look for in a Unit Economics Tool
Any analytics tool you consider should track all Amazon fee types automatically (not just referral and FBA), support COGS entry by SKU with period-based pricing, allocate ad spend at the product level, and display your variable costs per unit in a single view. If it can't do all four, you'll still need a spreadsheet alongside it.
When Unit Economics Shift
Unit economics aren't static. They shift constantly, and sellers who treat them as a one-time calculation end up with outdated profitability assumptions. Here are the triggers that should prompt a recalculation.
Recalculation Triggers
Amazon fee changes (January/June): Amazon typically updates FBA fees in January and sometimes mid-year. Every fee change directly impacts your per-unit costs. Track these through the 2026 fee update calendar.
COGS changes: New supplier quotes, currency fluctuations, tariff adjustments, and raw material cost shifts all change your cost basis. Update COGS every purchase order.
Q4 storage surge: October through December storage rates nearly triple. If you're holding excess inventory during peak season, your per-unit storage allocation spikes.
Ad spend scaling: Doubling ad spend doesn't double units sold. As you scale, your per-unit ad cost usually increases due to diminishing returns on higher bids. Monitor your TACoS trend Alongside unit economics.
Return rate spikes: A sudden increase in returns (defective batch, listing mismatch, seasonal returns) can flip a profitable product into a loss-maker. Track return rates by SKU.
The sellers who stay profitable long-term are the ones who treat unit economics as a living metric, not a one-time exercise. Monthly recalculation is the minimum. Weekly is better if you're actively adjusting pricing, ad spend, or inventory levels.
Turning Unit Economics Into Decisions
Knowing your per-unit profit is valuable. Acting on it is where the real gains happen. Here's how unit economics should drive your daily and monthly decisions.
- Keep/kill decisions. Any SKU with negative CM3 for two consecutive months should be reviewed for discontinuation or repricing. Use your product feed to rank all SKUs by contribution margin.
- Ad budget allocation. Shift ad spend toward products with the highest CM3, not the highest revenue. A $15 product with 40% CM3 deserves more ad budget than a $50 product with 5% CM3.
- Pricing adjustments. If your unit economics show a 12% CM3 in a category where the benchmark is 20%, you're either underpriced or carrying costs that competitors aren't. Your pricing strategy should be informed by unit economics, not gut feel.
- Supplier negotiations. When you can show a supplier that their price increase pushed your CM3 from 22% to 14%, you negotiate from data. Unit economics gives you the ammunition for better deals.
- Portfolio rebalancing. Use custom analytics to segment products by CM3 range. Products above 25% CM3 are your growth engine. Products between 10-25% need optimization. Below 10%? That's your watchlist.
Build Your Unit Economics View
Nova tracks every variable cost component per unit: referral fees, FBA fees, storage, return costs, COGS, and ad spend at the product level, across 21 marketplaces. Instead of building spreadsheets, you get a single view of per-unit profitability that updates hourly. See how it works.
Frequently Asked Questions
Ready to Transform Your Amazon Business?
Join thousands of successful sellers who use Nova Analytics to make data-driven decisions and maximize their profits.
Continue Learning
Explore more expert insights to grow your Amazon business
7 Amazon Seller Mistakes That Kill Profit Margins (2026)
Half of all Amazon sellers operate on net margins below 15%. These seven common mistakes silently drain profitability every month. Here's how to diagnose and fix each one.
Amazon Contribution Margin Calculator
Gross profit tells you if a product is viable. Contribution margin tells you if it's worth your time. Learn how to calculate CM1, CM2, and CM3 for Amazon products with category benchmarks and strategic applications.
Why Amazon profit tracking is broken in 2026
Seller Central reports lie by omission, spreadsheets buckle under 40+ fee types, and most analytics tools paper over the gaps. Here is what actually broke and how serious operators are fixing it.