Your UK marketplace might be 18% more profitable than US, but Seller Central won't tell you. Learn how to consolidate analytics across Amazon marketplaces with currency normalization and marketplace-specific cost tracking.
Your UK marketplace might be 18% more profitable than US, but you'd never know from Seller Central. Learn how to track true profitability across Amazon US, UK, Europe, and beyond with consolidated analytics that account for currency, fees, and marketplace-specific costs. The plateau usually shows up first in lax measurement of the items below; the symptoms come later.
You're selling in Amazon US, UK, and Germany. Revenue totals $640K monthly across all three. But here's what Seller Central doesn't show you: after normalizing for currency and marketplace-specific fees, your German operations run at 27% contribution margin while US sits at 19%. You're funding the wrong marketplace with inventory capital because the data is scattered across three dashboards in different currencies.
This is the multi-marketplace data challenge. Brands selling in 3+ marketplaces grow 2.3x faster than single-marketplace sellers [1]. But 68% lack unified analytics to make smart allocation decisions.
The result: you're flying blind on which marketplaces deserve more inventory, where to cut ad spend, and which expansion opportunities actually make money. Without consolidated profitability tracking, you can't compare apples to apples.
The Multi-Marketplace Data Challenge
Amazon Seller Central gives you separate dashboards for each marketplace. US data in dollars. UK in pounds. Germany in euros. To understand consolidated performance, you'd need to export reports from each marketplace, convert currencies, normalize fee structures, and build your own comparison framework. By hand. Every week.
The problems compound fast:
Currency conversion timing: Static conversion rates in spreadsheets don't reflect actual settlement rates Amazon uses
Fee structure differences: FBA fees vary by marketplace and change quarterly. US referral fees differ from UK
VAT complications: European marketplaces have VAT built into price. US doesn't. Comparison breaks without adjustment
Storage fee disparities: Long-term storage fees hit different thresholds in EU vs US
PPC cost variations: ACoS of 18% in US might be 24% in Germany for identical products due to competition differences
Why Large Sellers Struggle Here
Aggregators, multi-brand sellers, and large FBA operations managing multiple marketplaces face exponential complexity. Three brands across US, UK, and Germany means nine marketplace-brand combinations. Without automated consolidation, financial reporting takes 15+ hours weekly. Unified analytics cuts this to 20 minutes.
Brands with unified multi-marketplace analytics make expansion decisions 4x faster and with 67% higher success rates than those relying on manual reporting [2].
Multi-Marketplace Sellers
2.3x
Faster growth vs single marketplace
Without Unified Analytics
68%
Can't compare profitability accurately
Manual Reporting Time
15+ hrs
Weekly for multi-marketplace brands
Key Metrics to Compare Across Marketplaces
You can't manage what you don't measure. Here are the essential KPIs for multi-marketplace comparison, all normalized to a single currency (typically your home currency or USD).
Contribution Margin by Marketplace
CM3 (contribution margin after product cost, Amazon fees, PPC, and storage) is the core profitability metric. Calculate this separately per marketplace, then normalize to single currency. This reveals which marketplace is actually most profitable.
CM1: Revenue minus product cost and Amazon fees (marketplace-specific referral + FBA rates)
CM2: CM1 minus advertising costs (watch for PPC efficiency differences by marketplace)
CM3: CM2 minus storage, returns, and other variable costs
TACoS (Total Advertising Cost of Sales)
TACoS measures ad spend as a percentage of total revenue. Expected TACoS varies by marketplace maturity. New marketplace: 25-35% is normal. Established: 12-18%. Compare TACoS trends over time to identify when a marketplace becomes sustainably profitable.
Velocity Per Marketplace
Units sold per day, normalized by marketplace size. A SKU selling 12 units daily in US might only do 3 in UK, but UK has 5x smaller total market. So relative velocity is actually higher in UK. This indicates stronger product-market fit.
Fee Burden Comparison
Total Amazon fees as % of revenue varies significantly. US typically 35-42%. UK and Germany 38-46% due to higher fulfillment costs. France often highest at 40-48%. Know your fee burden per marketplace to set accurate margin expectations.
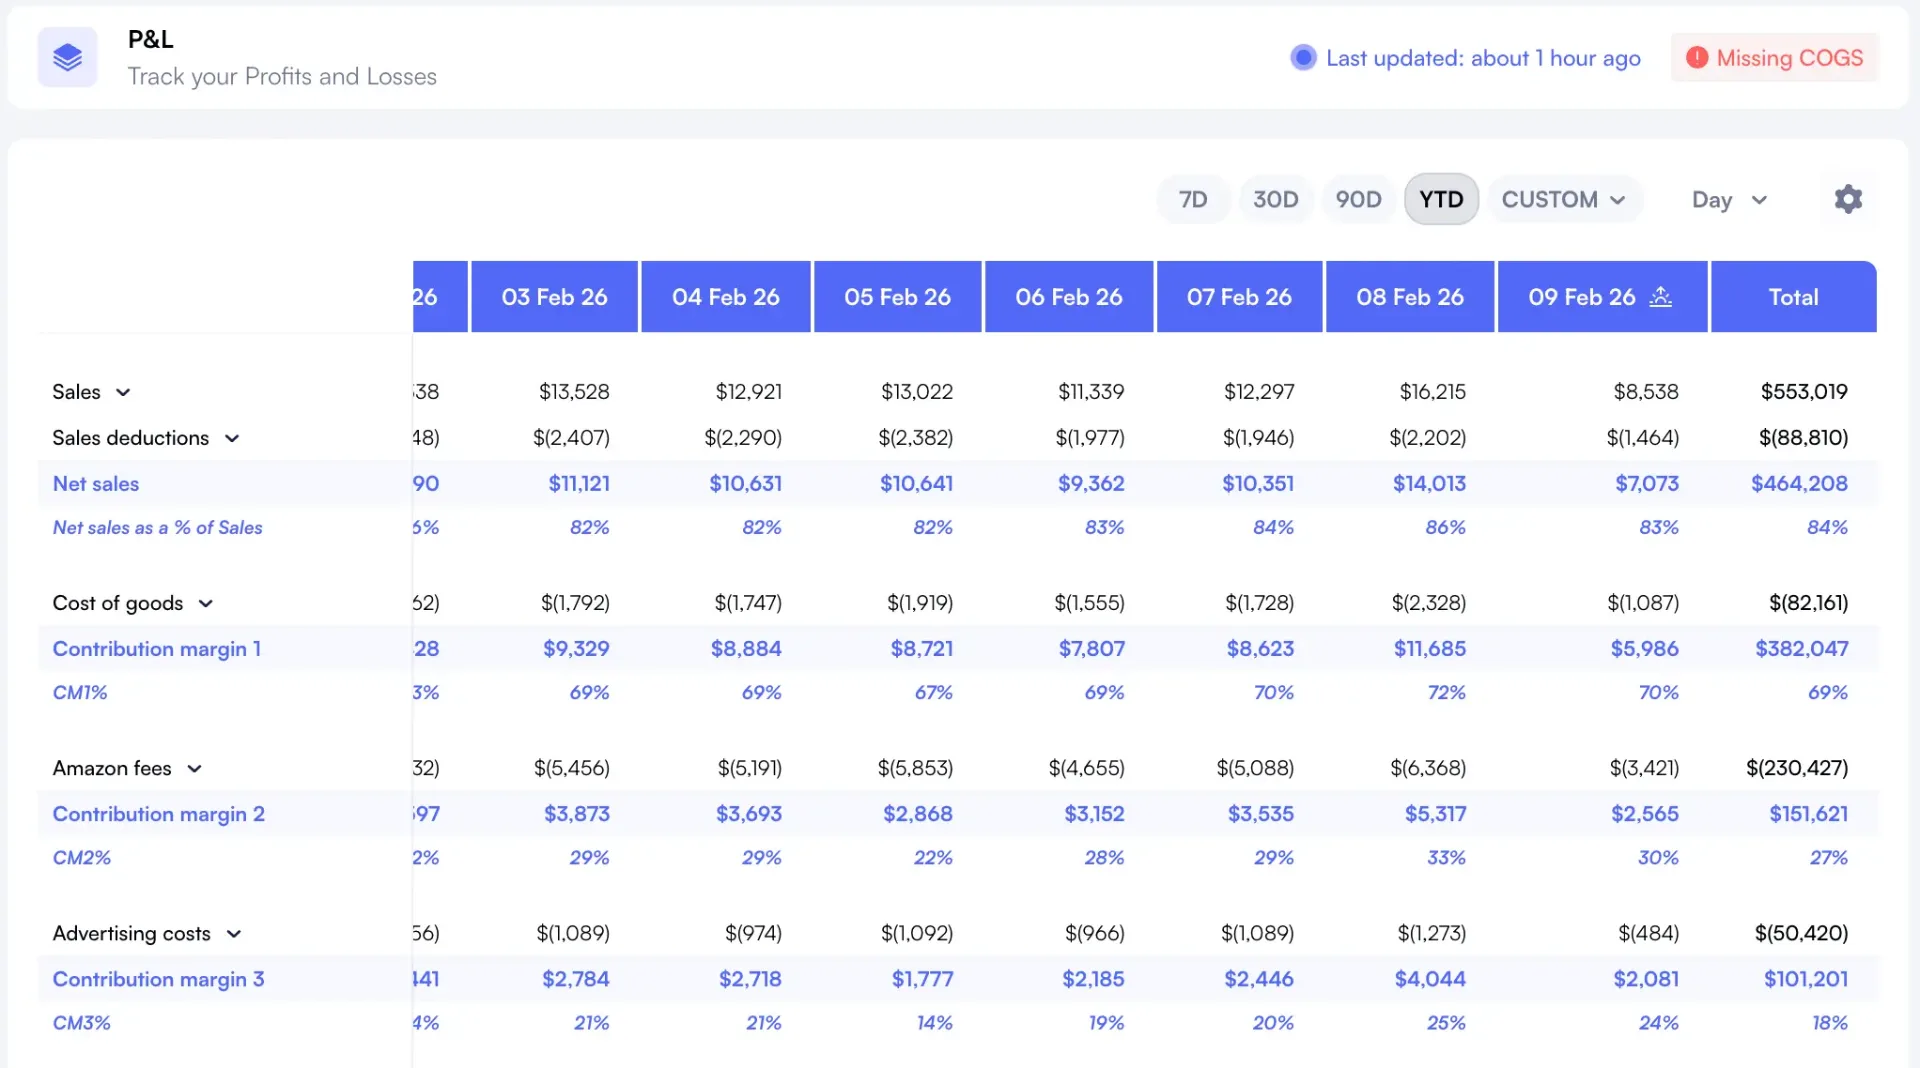
Nova's consolidated P&L showing profitability across multiple Amazon marketplaces
Automated P&L analytics calculate these metrics continuously across all connected marketplaces with real-time currency conversion and marketplace-specific fee structures. No manual exports. No spreadsheet errors.
Building Your Consolidated Dashboard
The goal is a single view where you can compare marketplace performance side-by-side. Nova's dashboard provides this out-of-the-box with automatic currency normalization and marketplace-specific cost adjustments.
Essential Dashboard Components
Revenue by marketplace: Normalized to single currency (USD, EUR, or GBP)
CM3% comparison: Side-by-side profitability showing true bottom line
TACoS trends: 90-day rolling average per marketplace to spot efficiency changes
Top products per marketplace: your winners might differ by geography
Inventory allocation view: Capital tied up in each marketplace vs. Velocity
Fee burden analysis: Total fees as % of revenue to understand marketplace economics
Brands that track profitability by marketplace can optimize pricing strategies to capture 8-15% additional margin by adjusting for local competition and willingness to pay [3].
Marketplace Profitability Deep Dive
Let's analyze real performance data from a home goods brand selling identical products in US, UK, and Germany. All numbers normalized to USD for comparison.
Metric
US
UK
Germany
Monthly Revenue
$380,000
$165,000
$142,000
Amazon Fee %
37.2%
41.8%
43.1%
TACoS
16.4%
22.7%
28.3%
CM3 %
19.1%
14.6%
8.2%
CM3 Dollars
$72,580
$24,090
$11,644
Decision
Optimize & grow
Fix PPC efficiency
Consider exit
Key Insights from This Data
US is the clear winner. Highest revenue, lowest fees, best TACoS efficiency. UK has potential. Revenue is decent but TACoS at 22.7% needs work. Germany is struggling. Despite $142K revenue, only 8.2% falls to CM3 because of 43.1% fees plus 28.3% TACoS.
Without this consolidated view, you might allocate equal inventory capital to all three. But Germany is barely profitable. Better to reallocate that capital to US expansion or fix UK's PPC efficiency.
Case Study: Brand Discovers 18% Margin Gap Between US and DE
Large seller with 150+ SKUs selling in US, UK, Germany, and France. Total revenue $920K monthly across all marketplaces. They assumed France was their second-best marketplace because revenue ranked #2. Consolidated analytics revealed a different story.
Before Unified Analytics:
France: $215K revenue, assumed strong
Germany: $178K revenue, deprioritized
Inventory split equally across markets
PPC budgets based on revenue rank
Overall margin: 16.8%
After Marketplace Analysis:
France: 9.2% CM3 (losing money on fees)
Germany: 27.4% CM3 (most profitable!)
Reallocated inventory to US & Germany
Cut France PPC 60%, raised Germany 80%
Overall margin: 21.3% (4.5 points higher)
Actions Taken Over 4 Months:
Germany Investment: increased inventory 140%, raised PPC budget from $11K to $19.8K monthly. Revenue grew $178K to $264K with 26.1% sustained CM3.
France Pullback: Stopped replenishing slow SKUs, cut PPC 60%. Revenue dropped $215K to $147K but CM3 improved 9.2% to 13.8% by eliminating inefficient spend.
UK Optimization: Fixed PPC targeting, reduced ACoS from 26.4% to 19.1%. Margin improved without revenue loss.
US Protection: Ensured top-performing marketplace never ran low on inventory. Increased safety stock 25%.
The breakthrough insight: France looked strong on revenue but had 44.7% fee burden plus expensive PPC competition. Germany had lower revenue but much better unit economics. Reallocating capital to Germany generated 3x ROI vs. France expansion.
This brand used Nova's custom analytics to build marketplace comparison views that updated in real-time. Every Monday, leadership reviewed a single dashboard showing all four marketplaces side-by-side. Decision-making went from quarterly strategic planning to weekly tactical optimization.
When to Expand vs. When to Consolidate
Multi-marketplace selling is trendy. But more marketplaces don't automatically mean more profit. Use this decision framework to evaluate expansion opportunities and when to pull back.
Expand to New Marketplace When:
CM3 above 22% in existing markets: you've proven unit economics work
Category demand validated: Research shows meaningful search volume in target marketplace
Inventory capital available: can fund 90-day supply without starving existing winners
Operations capacity: can handle customer service in local language or timezone
TACoS under 15% in home market: you've achieved PPC efficiency that can translate
Exit Marketplace When:
CM3 below 8% for 6+ months: Unit economics don't work despite optimization attempts
Fee burden above 45%: Marketplace structure makes profitability nearly impossible
TACoS stuck above 30%: can't achieve PPC efficiency due to competition or search volume
Slow inventory velocity: Products sitting 120+ days tie up capital better deployed elsewhere
Revenue under $50K monthly after 12 months: Not enough scale to justify complexity
Industry research shows that sellers in 2+ marketplaces earn 67% higher revenue but only if they actively manage profitability per marketplace. Those who expand without tracking performance often see revenue growth but profit decline.
Setting Up Multi-Marketplace Tracking in Nova
Getting started with consolidated analytics takes under 30 minutes. Here's the implementation roadmap that works for brand managers, large sellers, and aggregators running global operations:
Step 1: Connect All Marketplace Accounts (10 minutes)
Navigate to Settings → Integrations → Amazon Accounts. Add each marketplace account (US, CA, UK, DE, FR, IT, ES, etc). Nova automatically handles authentication for each region.
North America: amazon.com, amazon.ca, amazon.com.mx
Choose which currency you want all data normalized to. Typically your home currency or USD. Nova uses real-time exchange rates from your actual Amazon settlement reports, not static conversions. This ensures accuracy.
Nova auto-detects fee structures per marketplace, but you can override if you have special arrangements (e.g., negotiated FBA rates, referral fee discounts). Set cost of goods if it varies by marketplace due to different suppliers.
Product cost per marketplace (if sourcing differs)
Shipping cost to FBA centers by region
Any fixed costs allocated to specific marketplaces
Step 4: Build Your Marketplace Comparison Dashboard (8 minutes)
Use custom analytics to create views comparing your KPIs side-by-side. Save this as your default dashboard.
Revenue by marketplace (normalized currency)
CM3% comparison table
TACoS trends per marketplace (90-day rolling)
Top 10 products per marketplace
Fee burden analysis by region
[Demo widget coming soon]
Products Feed filtered by marketplace showing performance variations across regions
Once configured, your dashboard updates hourly with fresh data from all connected marketplaces. No manual exports. No currency conversion errors. No wondering which marketplace deserves more inventory capital.
Advanced Multi-Marketplace Strategies
Price Optimization by Marketplace
Don't use the same price across all marketplaces. UK customers might pay 12% more for identical product compared to Germany due to competition and willingness to pay. Test pricing independently per marketplace. Track CM3 impact. A/B testing different price points can reveal 5-15% margin improvements.
Strategic Loss Leaders
Some brands intentionally run one marketplace at break-even to establish presence while focusing profit generation on 1-2 core markets. This works if: break-even marketplace builds brand recognition, you have clear timeline to profitability (18 months max), and profitable marketplaces subsidize expansion. Document this strategy explicitly so team knows it's intentional.
Product Line Variation by Region
Not all SKUs need to sell in all marketplaces. Your top 10 products in US might be different from top 10 in Germany. Use Winners & Losers analysis per marketplace to identify which SKUs to prioritize regionally. This lets you focus inventory where it performs best.
According to eMarketer's global e-commerce research, brands that customize product mix and pricing by marketplace see 23% higher profitability than those using identical strategies across all regions.
Frequently asked questions
Nova's P&L automatically adjusts for VAT by using revenue net of VAT (what you actually receive). This makes EU marketplaces comparable to US. In your comparison dashboard, you're seeing true top-line after tax obligations. Don't manually subtract VAT; the system handles this based on Amazon's reporting.
Use the actual rates from your Amazon settlement reports, not spot market rates. Nova pulls these automatically. Amazon's conversion timing (when they actually pay you) differs from daily exchange rates. Using settlement rates ensures your P&L matches your bank account. Variance is typically 1-3%, but it matters for accurate profitability tracking.
$50K monthly is the practical minimum for established marketplaces. Below that, complexity costs exceed profit potential. For new marketplace testing, budget 6-12 months at lower revenue if CM3% looks strong. But if you're not hitting $50K monthly by month 12 despite optimization, consider reallocating capital.
Allocate based on CM3 dollars generated, not percentage. A marketplace with 18% CM3 on $300K revenue ($54K profit) deserves more inventory than one with 24% CM3 on $80K revenue ($19.2K profit). Use day-to-day performance tracking to monitor velocity and adjust allocations monthly.
Yes. Large sellers with multiple brands, agencies using Nova, and aggregators can connect unlimited brands and marketplaces. Each brand's data stays isolated. Build brand-specific dashboards showing their multi-marketplace performance.
Tools and Resources for Global Expansion
Successful multi-marketplace selling requires the right infrastructure. Here's what leading brands use:
P&L Analytics - Consolidated profitability with currency normalization
Multi-marketplace selling amplifies both opportunities and risks. Done right, you're 2.3x more likely to hit aggressive growth targets. Done wrong, you're spreading capital thin across marginally profitable markets while missing opportunities in your strongest regions.
The difference is visibility. When you can see true profitability per marketplace (normalized for currency, fees, and costs), allocation decisions become obvious. Invest in Germany. Fix UK. Pull back from France. These aren't guesses. They're data-driven conclusions from consolidated analytics.
Most large Amazon sellers delay implementing multi-marketplace tracking because they assume it's complex. In reality, setup takes under 30 minutes. Connect accounts, set reporting currency, build comparison dashboard. Done. From there, you're making weekly optimization decisions instead of quarterly strategic plans based on incomplete data.
The opportunity cost of not tracking is massive. Every month you operate without marketplace-level profitability visibility, you're misallocating inventory capital. You're funding weak marketplaces that could be starving strong ones. You're making expansion decisions based on revenue when contribution margin tells the real story.