Complete P&L template with every Amazon line item, where to find each number in Seller Central, and a 30-minute walkthrough. Plus: where spreadsheets break down past 20 SKUs.
Every Amazon seller needs a monthly P&L. Not the "I think I'm making money" gut feeling, but a real, line-by-line breakdown of where your revenue comes from and where it goes. The problem? Amazon doesn't give you one. You have to build it yourself from 6+ different reports scattered across Seller Central.
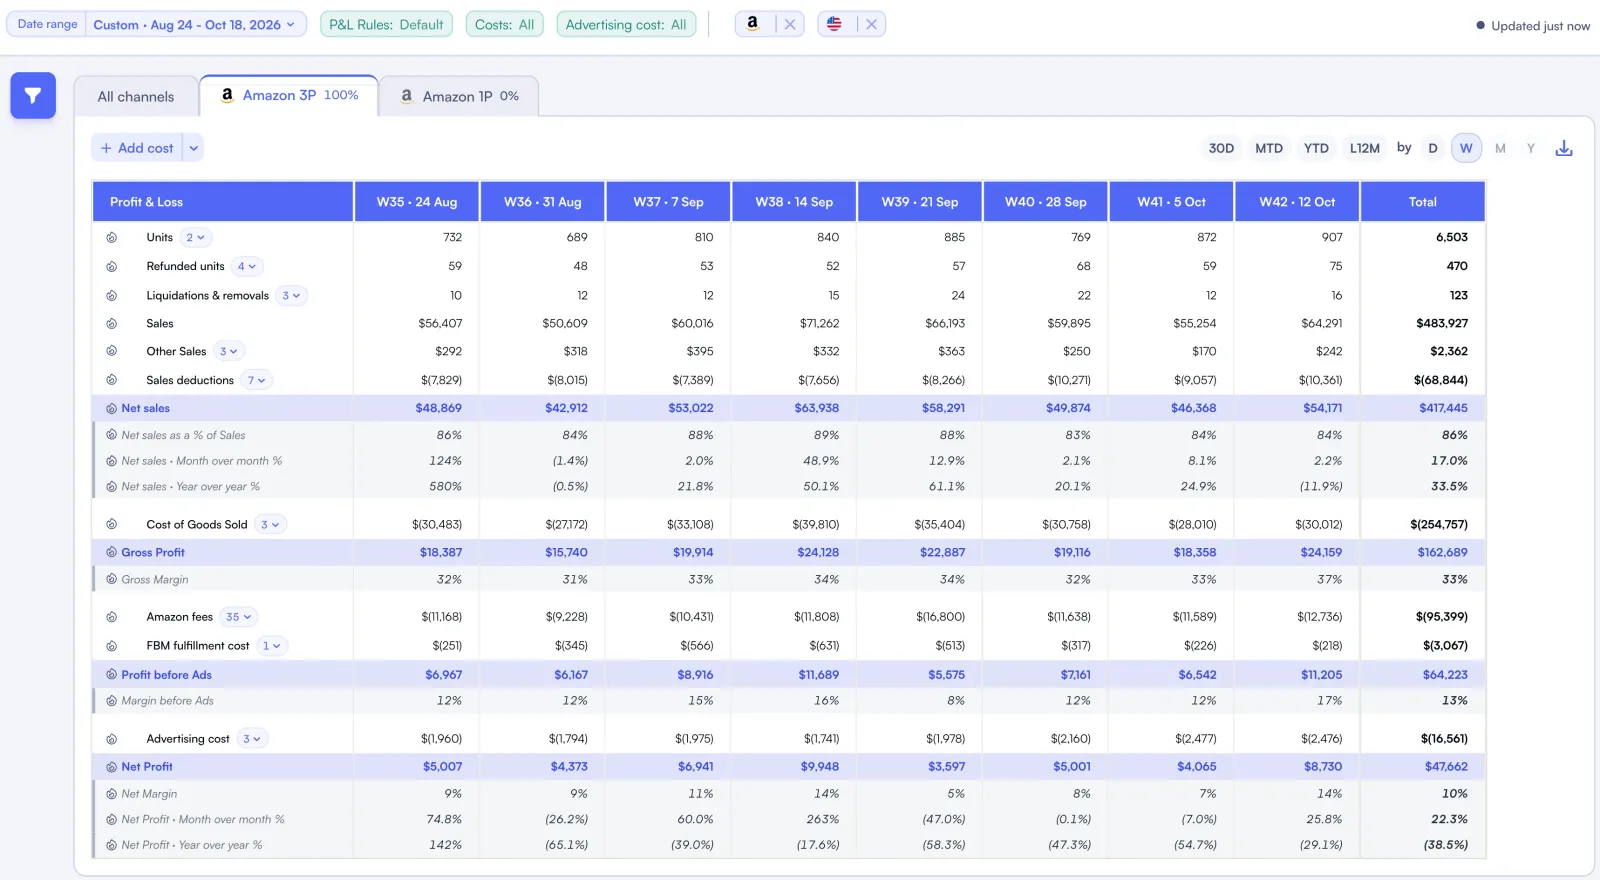
Read sales alongside every cost layer to see how much profit remains.
This guide gives you a complete P&L template with every line item you need, shows you exactly where to pull each number in Seller Central, and walks you through building your first monthly report in about 30 minutes. You'll also learn where this manual approach hits its limits and what to do when your catalog outgrows a spreadsheet.
The Complete Amazon P&L Template
Here's the full P&L structure every Amazon seller should use. It covers all revenue adjustments, Amazon-specific fees, COGS, marketing costs, and overhead. Each line item includes the Seller Central report where you find that number.
Line Item
Source Report
Example ($)
REVENUE
Gross Product Sales
Business Report > Sales Dashboard
$85,000
Shipping Credits Received
Payments > Transaction View
$1,200
Gift Wrap Credits
Payments > Transaction View
$150
(-) Customer Refunds
Payments > Transaction View
-$4,250
(-) Promotional Discounts
Payments > Transaction View
-$2,550
= Net Revenue
$79,550
COST OF GOODS SOLD (COGS)
Product Cost (supplier invoice)
Your records / purchase orders
-$25,500
Inbound Shipping to FBA
Shipping invoices / carrier bills
-$3,400
Customs & Import Duties
Customs broker invoices
-$1,700
Prep, Labeling & Packaging
Prep center invoices / your records
-$850
= Gross Profit (CM1)
$48,100 (60.5%)
AMAZON FEES
Referral Fees
Payments > Transaction View
-$12,750
FBA Fulfillment Fees
Payments > Transaction View
-$8,500
Monthly Storage Fees
Payments > Transaction View
-$1,100
Inbound Placement Fees
Payments > Transaction View
-$680
Returns Processing Fees
Payments > Transaction View
-$425
Refund Administration Fees
Payments > Transaction View
-$212
ADVERTISING
Sponsored Products
Advertising > Campaign Manager
-$8,500
Sponsored Brands
Advertising > Campaign Manager
-$2,200
Sponsored Display
Advertising > Campaign Manager
-$800
= Contribution Margin (CM3)
$12,933 (16.3%)
OPERATING EXPENSES
Software & Tools
Your subscription records
-$450
VAs / Contractors
Payroll / invoices
-$2,000
Professional Services
Accounting / legal invoices
-$500
= NET PROFIT
$9,983 (12.6%)
Contribution Margin Layers Explained
CM1 (Gross Profit) shows profitability before Amazon touches your money. CM2 adds Amazon fees. CM3 includes advertising. This layered approach tells you exactly where margin gets consumed. If your CM1 is strong but CM3 is weak, your Amazon fees or ad spend are the problem, not your product cost. For a deeper dive into contribution margin analysis, check our contribution margin optimization guide.
How to Pull Each Number from Seller Central
The hardest part of building a monthly P&L isn't the math. It's finding the right numbers in Seller Central's maze of reports. Here's exactly where to go for each section:
Revenue Numbers
Start with Payments > Date Range Reports. Generate a report for your target month. This gives you a consolidated view of all transactions: sales, refunds, fees, and adjustments. For gross sales broken down by SKU, use the Business Report > Detail Page Sales and Traffic by Child Item Report.
Watch Out for Date Mismatches
Amazon posts fees on settlement dates, not order dates. A sale on March 28 might have its referral fee settled on April 3. If you're building a March P&L, you need to decide: do you use order date (accrual accounting) or settlement date (cash accounting)? Most sellers use settlement date because it matches the Payments reports. Just be consistent. For more on this distinction, see our Amazon accounting fundamentals guide.
Amazon Fee Breakdown
The Date Range Report lumps fees together. To get granular breakdowns (referral vs FBA vs storage), download the Transaction View from Payments and filter by transaction type. You'll see each fee category separately. For a $1 to all available Seller Central reports, check our Seller Central reports guide.
Reports to Download
6+
Different Seller Central reports needed monthly
Manual Processing Time
4-8 hrs
For a 50-SKU catalog monthly P&L
Common Fee Categories
12+
Distinct fee types in a typical month
Advertising Spend
Pull PPC data from Advertising > Campaign Manager > Reports. Download the "Campaigns" report for your date range. This gives you total spend by campaign type (Sponsored Products, Brands, Display). For SKU-level ad allocation, you'll need the "Advertised Product" report. This is essential if you want to build a per-product PPC ROI view.
COGS (The Part Amazon Can't Tell You)
This is where most sellers struggle. Amazon has no idea what you paid your supplier. You need to maintain your own COGS records with:
Supplier invoices: per-unit product cost for each SKU
Shipping records: Freight/courier costs divided by units shipped
Customs documentation: Duty rates applied to each product category
Prep costs: Labeling, polybagging, bundling costs per unit
The cleanest approach is maintaining a COGS spreadsheet per SKU with a landed cost per unit that you update every time you place a new purchase order. Multiply that by units sold (from the Business Report) to get total COGS for the month.
Building Your First Monthly P&L: 30-Minute Walkthrough
Here's the exact sequence to build your first P&L. Set aside 30 minutes and have Seller Central open in another tab.
Minutes 1-5: Download Reports
Go to Payments > Date Range Reports. Generate a report for last month. Then go to Business Report > Detail Page Sales and Traffic. Download both. Open Advertising > Campaign Manager and download the Campaigns report for the same date range.
Minutes 5-15: Revenue Section
From the Date Range Report, pull: total product sales, shipping credits, promotional rebates (negative), and refunds (negative). Sum these for Net Revenue. Cross-check against the Business Report's ordered product sales total. They should be within 2-3% of each other (differences come from timing).
Minutes 15-22: Amazon Fees & Ad Spend
From the Date Range Report, the fees section shows: FBA fees, referral fees, storage fees, and other transaction fees. Copy each into your template. From the Campaign Manager report, sum total ad spend across all campaign types.
Minutes 22-28: COGS & Operating Expenses
Pull units sold from the Business Report. Multiply by your per-unit COGS for each SKU. Add your monthly operating expenses: software subscriptions, VA costs, professional services. If you don't have exact COGS, use 30-35% of net revenue as a starting estimate and refine over the next month.
Minutes 28-30: Calculate Margins
Subtract each cost layer to get your contribution margins (CM1, CM2, CM3) and net profit. Calculate each as a percentage of Net Revenue for benchmarking. Your margin targets should be: CM1 above 55%, CM3 above 15%, net profit above 10%.
The 30-Minute Reality Check
That 30-minute timeline works for your first month with 10-15 SKUs and a single marketplace. By month three, you'll know the process well enough to do it in 20 minutes. But the time scales linearly with SKU count. A 100-SKU catalog? That's 3-4 hours of report downloading, data matching, and formula checking. Every month. According to a Practical Ecommerce analysis, most mid-size sellers spend 6-10 hours monthly on financial reporting.
Where Spreadsheet P&Ls Break Down
Manual P&Ls work until they don't. Here are the five failure points that push sellers from spreadsheets to automated solutions:
1. Multi-SKU Attribution
When you have 50+ SKUs, attributing shared costs (storage, advertising, overhead) to individual products becomes a nightmare. Which product "owns" the Sponsored Brands campaign that advertises three ASINs? How do you split the monthly storage fee across 200 units of Product A and 50 units of Product B? Spreadsheets can do this math, but maintaining the formulas across 50+ rows with changing inventory levels is where errors creep in.
2. Daily or Weekly Granularity
Monthly P&Ls tell you what happened. They don't help you react in time. If a fee increase hits on the 3rd and you don't build your P&L until the 1st of next month, you've lost 27 days of potential optimization. The daily metrics that matter for operational decisions require daily P&L updates, which manual spreadsheets simply can't sustain.
3. Multi-Marketplace Complexity
Selling on Amazon US, UK, and DE? Each marketplace has different fee structures, different currencies, and different settlement schedules. Your P&L needs currency conversion at the transaction level, not just an end-of-month exchange rate. That's a separate data source you need to integrate. Our multi-marketplace analytics guide covers this complexity in detail.
4. Delayed Fee Posting
Amazon can post fees weeks after the associated transaction. Long-term storage fees appear quarterly. Returns processing fees hit when the return is processed, not when the original sale occurred. A Seller Central help article on payments timing notes that some adjustments can post 45+ days after the original transaction. Your monthly P&L is always a moving target until these delayed entries settle.
5. Fee Structure Changes
Amazon updates its fee schedule regularly. The 2026 FBA fee changes included new inbound placement fees, adjusted storage rates, and updated size tier thresholds. Each change means updating your spreadsheet formulas. Miss one, and your P&L is silently wrong for months.
SKU Threshold
~20
Where manual P&Ls start breaking down
Error Rate (Manual)
5-12%
Typical spreadsheet P&L inaccuracy
Time Savings (Automated)
90%+
Reduction in monthly reporting time
Manual Template vs Automated P&L: Honest Comparison
There's no shame in using spreadsheets. Every seller starts there. But it's worth understanding the tradeoffs so you can make an informed decision about when to upgrade.
Factor
Spreadsheet P&L
Automated P&L (e.g., Nova)
Setup Time
30-60 minutes
15 minutes (connect store)
Monthly Time
2-8 hours depending on SKU count
0 hours (updates automatically)
Accuracy
88-95% (formula errors, missed fees)
99%+ (direct API data)
Granularity
Monthly (daily is impractical)
Daily or hourly
SKU Limit
Practical up to 15-20 SKUs
Unlimited
Multi-Marketplace
Requires separate sheets + FX rates
Consolidated automatically
Fee Updates
Manual formula changes
Updated automatically
Cost
Free (your time excluded)
$49-199/mo depending on plan
The inflection point for most sellers is around 20 SKUs or $50K/month in revenue. Below that, a well-maintained spreadsheet works fine. Above it, the time cost of manual reporting usually exceeds the cost of an analytics subscription. If you're at that point, explore what a dedicated P&L dashboard looks like in practice.
P&L Analysis: What to Look For Each Month
Building the P&L is step one. Reading it correctly is where the value lives. Here are the key patterns to watch:
Margin Trend Analysis
Compare CM1, CM2, and CM3 month over month. If CM1 is stable but CM3 is declining, your Amazon fees or ad spend are growing faster than revenue. If CM1 is declining, your COGS or return rate is worsening. Each margin layer isolates a different cost center so you know exactly where to investigate. Your weekly business review should track these trends.
Cost Ratio Benchmarks
Express every cost as a percentage of net revenue. Industry benchmarks from Marketplace Pulse suggest: referral fees 13-15%, FBA fees 8-12%, ad spend 10-18%, COGS 25-40%. If any ratio is outside these ranges, dig into that category. Your custom analytics can break these down by product group to find outliers.
Product-Level Profitability
Your total P&L might show 12% net profit, but that average hides the reality: some products run at 25% margins while others lose money. Breaking down P&L by product (or at least by parent ASIN) reveals which SKUs to scale, which to optimize, and which to discontinue. This is the foundation of SKU rationalization.
Frequently asked questions
Most profitable Amazon sellers operate between 10-20% net profit margin after all costs. According to Marketplace Pulse seller margin data, the median is around 15%. Below 10% signals you need to optimize pricing, reduce costs, or cut unprofitable SKUs. Above 20% is excellent and often means you have pricing power or exceptional COGS efficiency.
For internal decision-making, accrual accounting (recording revenue when orders are placed, not when Amazon pays you) gives a more accurate picture. Cash accounting is simpler and matches Seller Central's payment reports. Most sellers use cash accounting for monthly P&Ls and switch to accrual for annual tax reporting. Our accounting fundamentals guide covers both methods in detail.
Record reimbursements as a separate revenue line item, not as a reduction of fees. This keeps your fee ratios accurate and shows you how much you're recovering from Amazon's errors. For sellers not actively claiming reimbursements, our reimbursement guide outlines the process and typical recovery amounts (1-3% of annual revenue).
Yes, but it's practical only up to about 15-20 SKUs. Beyond that, the data matching between sales reports, fee reports, and ad reports becomes error-prone and time-consuming. The challenge is that Amazon's reports use different identifiers (ASIN vs SKU vs FNSKU), so matching requires careful lookup formulas. Tools that connect directly to Amazon's API handle this matching automatically at any scale.
Your Next Step
Download your Seller Central reports for last month and build your first P&L using the template above. Even an imperfect P&L with estimated COGS is better than flying blind. Once you see your actual margins, you'll know immediately whether to focus on cost reduction, pricing optimization, or ad spend efficiency.
If you're past the spreadsheet stage and want automated P&L tracking with daily updates, explore how a connected analytics platform handles the heavy lifting. The goal is the same: clear financial visibility. The method just scales better.