


Amazon Sales Analytics
Revenue is vanity, profit is sanity. Amazon sales analytics connects your top-line numbers to actual profitability. Learn the 5 metrics that matter, why Seller Central falls short, and how to build a sales analytics stack that catches problems the same day.
 Gemini
 ChatGPT
Amazon sales analytics is how you turn raw transaction data into growth decisions. Whether you're tracking revenue trends across 5 SKUs or 5,000, the principle is the same: sellers who measure the right metrics at the right frequency consistently outperform those relying on Seller Central's delayed, surface-level reports. This guide breaks down what to track, how to track it, and the mistakes that cost sellers thousands in missed revenue.
Here's the uncomfortable truth. Revenue is vanity. A $200K month means nothing if your margins are 3% after Amazon's 40+ fee types eat into every order. Sales analytics done right connects your top-line numbers to actual profitability so you can grow what works and cut what doesn't.
TL;DR - Key Takeaways
- •Amazon sales analytics tracks revenue, units, and trends. But revenue without profit context is dangerous.
- •Seller Central updates every 24 to 72 hours. Hourly refresh catches problems the same day.
- •The best sellers track five metrics daily: revenue by SKU, units sold, conversion rate, Buy Box percentage, and TACoS.
- •Custom segmentation (by brand, lifecycle, or margin tier) reveals patterns that flat reports hide.
- •Most sellers discover 2 to 3 unprofitable products within their first week of proper analytics setup.
Data Refresh
Hourly
Catch revenue shifts the same day, not 48 hours later
Fee Types Tracked
40+
Every FBA, referral, storage, and removal fee included
Marketplaces
23
Unified sales view across every Amazon marketplace
What Is Amazon Sales Analytics?
Amazon sales analytics is the systematic tracking and analysis of your revenue, units sold, order patterns, and conversion metrics across your Amazon business. It transforms scattered Seller Central data into a coherent picture of what's selling, what's slowing down, and where your next growth opportunity lives.
There's a critical distinction between sales data and sales analytics. Seller Central gives you data: tables of numbers you can download and scroll through. Analytics adds context. It tells you "revenue dropped 18% on Tuesday because your top SKU lost the Buy Box at 2 PM" instead of just showing you a number.
According to McKinsey research, data-driven organizations are 23 times more likely to acquire customers. For Amazon sellers, that advantage compounds. You spot demand shifts faster, adjust pricing earlier, and allocate ad spend to products that actually convert.
The 5 Sales Metrics That Actually Matter
You could track 200 metrics. Most sellers should focus on five. These are the numbers that drive every meaningful business decision, from daily operations to quarterly strategy.
1. Revenue by SKU
Total revenue is a headline number. Revenue by SKU is where decisions happen. You need to see which products drive your business and which ones coast on volume without contributing margin. A $30K product doing 2% net margin is worth less than a $5K product at 25%.
Track this daily. Sort by revenue contribution, then cross-reference with profitability. Most sellers are surprised to find their "best seller" isn't their most profitable product. Our Amazon sales tracker Ranks every SKU by both revenue and actual profit contribution.
2. Units Sold and Velocity
Units sold tells you demand. Velocity (units per day or per week) tells you momentum. A product selling 50 units per day that drops to 35 is a problem. A product jumping from 20 to 40 is an opportunity. The trend matters more than the absolute number.
Watch for velocity changes that don't match your actions. If units drop without a price change or stock issue, something external shifted. A new competitor, a listing suppression, a Best Seller Rank algorithm change. According to industry seller surveys, 67% of sellers experienced unexpected sales drops that took more than a week to diagnose.
3. Conversion Rate (Unit Session Percentage)
Your conversion rate connects traffic to sales. Amazon's average conversion rate across all categories is around 10 to 15%, but this varies wildly. Consumer electronics might see 5%. Consumables often hit 20%+.
Track your conversion rate per product, not as an account average. A single low-converting product can drag down your account's perceived health. If conversion drops below your category baseline, investigate your listing quality, pricing, and reviews before increasing ad spend. More traffic to a broken listing just burns money faster.
4. Buy Box Percentage
If you don't have the Buy Box, you don't have sales. It's that simple. Industry research shows that over 80% of Amazon sales go through the Buy Box. Tracking your Buy Box percentage by SKU and by hour reveals when you're losing it and why.
Common causes: a competitor drops price by 2%, your fulfillment metrics dip, or Amazon's own retail arm joins the listing. Hourly tracking catches these shifts before they cost you a full day of sales.
5. TACoS (Total Advertising Cost of Sale)
TACoS measures your ad spend against total revenue, including organic sales. It's the single best indicator of whether your advertising is building your business or just sustaining it. A healthy TACoS for established products is 10 to 15%. During launches, 25 to 35% is acceptable.
If TACoS is rising while total revenue stays flat, your organic sales are declining and ads are compensating. That's a warning sign. If TACoS is falling while revenue grows, your ads are generating organic momentum. That's the goal. For a deeper breakdown, read our complete TACoS guide.
Get More Amazon Seller Tips
Subscribe to our newsletter for weekly insights, strategies, and market updates.
Why Seller Central Falls Short for Sales Analytics
Seller Central wasn't built for analytics. It was built for account management. The reporting tools are functional for compliance and basic tracking, but they fail at the analytical depth that growing businesses need.
| Capability | Seller Central | Dedicated Analytics Tool |
|---|---|---|
| Data refresh | 24 to 72 hours | Hourly or near real-time |
| True profit per SKU | Not available (missing COGS, PPC per product) | Full P&L per SKU with all fee types |
| Custom segmentation | None | Tag by brand, lifecycle, margin tier |
| Cross-marketplace view | Switch between accounts manually | Unified dashboard across 21 marketplaces |
| Trend detection | Manual chart reading | Automated anomaly alerts |
| Historical data | Limited retention, varies by report | Full history from day one |
The biggest gap is speed. When your top product loses the Buy Box at 10 AM, Seller Central might not reflect the revenue impact until the next morning. By then you've lost a full day of sales. With hourly refresh, you catch the problem before lunch. For a detailed look at every native report type, see our Seller Central reports guide.
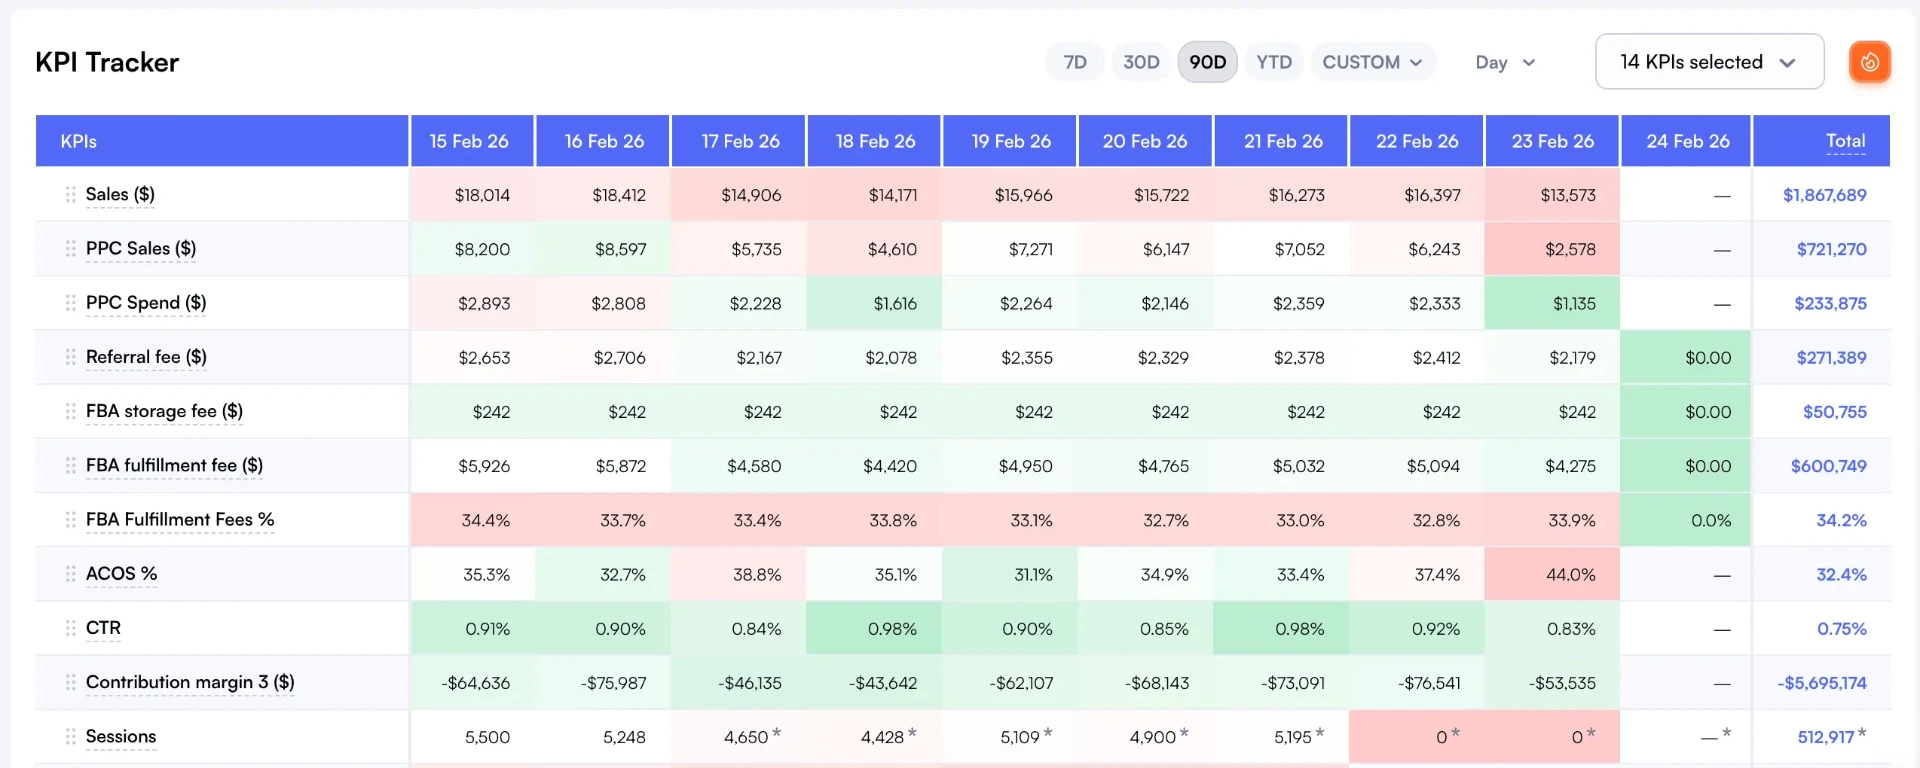
Revenue vs. Profit: The Analytics Trap
The most dangerous mistake in Amazon sales analytics is optimizing for revenue without understanding profit. We've seen it hundreds of times. A seller celebrates a $500K month, then discovers their actual take-home was $12K after Amazon's fee stack.
Amazon charges over 40 distinct fee types. FBA fulfillment, referral fees (6% to 45% depending on category), storage fees (monthly and long-term), removal fees, return processing, advertising, and promotional costs. Each one chips away at your margin. A product with a 30% gross margin on paper might be running at 5% net after all fees.
Pro Tip
Don't track revenue in isolation. Every sales analytics view should show revenue alongside contribution margin. If you can't see profit per SKU next to revenue per SKU, your analytics are incomplete. Nova's P&L dashboard shows both in a single view with 99.8% accuracy.
According to the Amazon Seller Central blog, FBA fee structures change multiple times per year. If your analytics don't automatically incorporate these updates, your margin calculations drift further from reality with every fee adjustment. For a full breakdown of what this looks like in practice, read our profit audit guide.
Custom Segmentation for Deeper Sales Insights
Flat reports treat every product the same. Custom segmentation reveals the patterns hiding inside your catalog. When you tag products by brand, lifecycle stage, margin tier, or sourcing method, you start seeing trends that aggregate data obscures.
For example, a seller with 200 SKUs might discover that their "premium" tier (top 20% by price) generates 60% of profit despite being only 15% of unit volume. Or that products in their "decline" lifecycle stage are consuming 30% of ad spend while contributing 8% of margin. These insights only emerge when you segment.
Nova's Custom Breakdowns let you create unlimited tags and filter every metric by your custom categories. You can slice revenue, profit, ad spend, and returns by any combination of tags. This is how portfolio-level sellers manage complexity without drowning in spreadsheets.
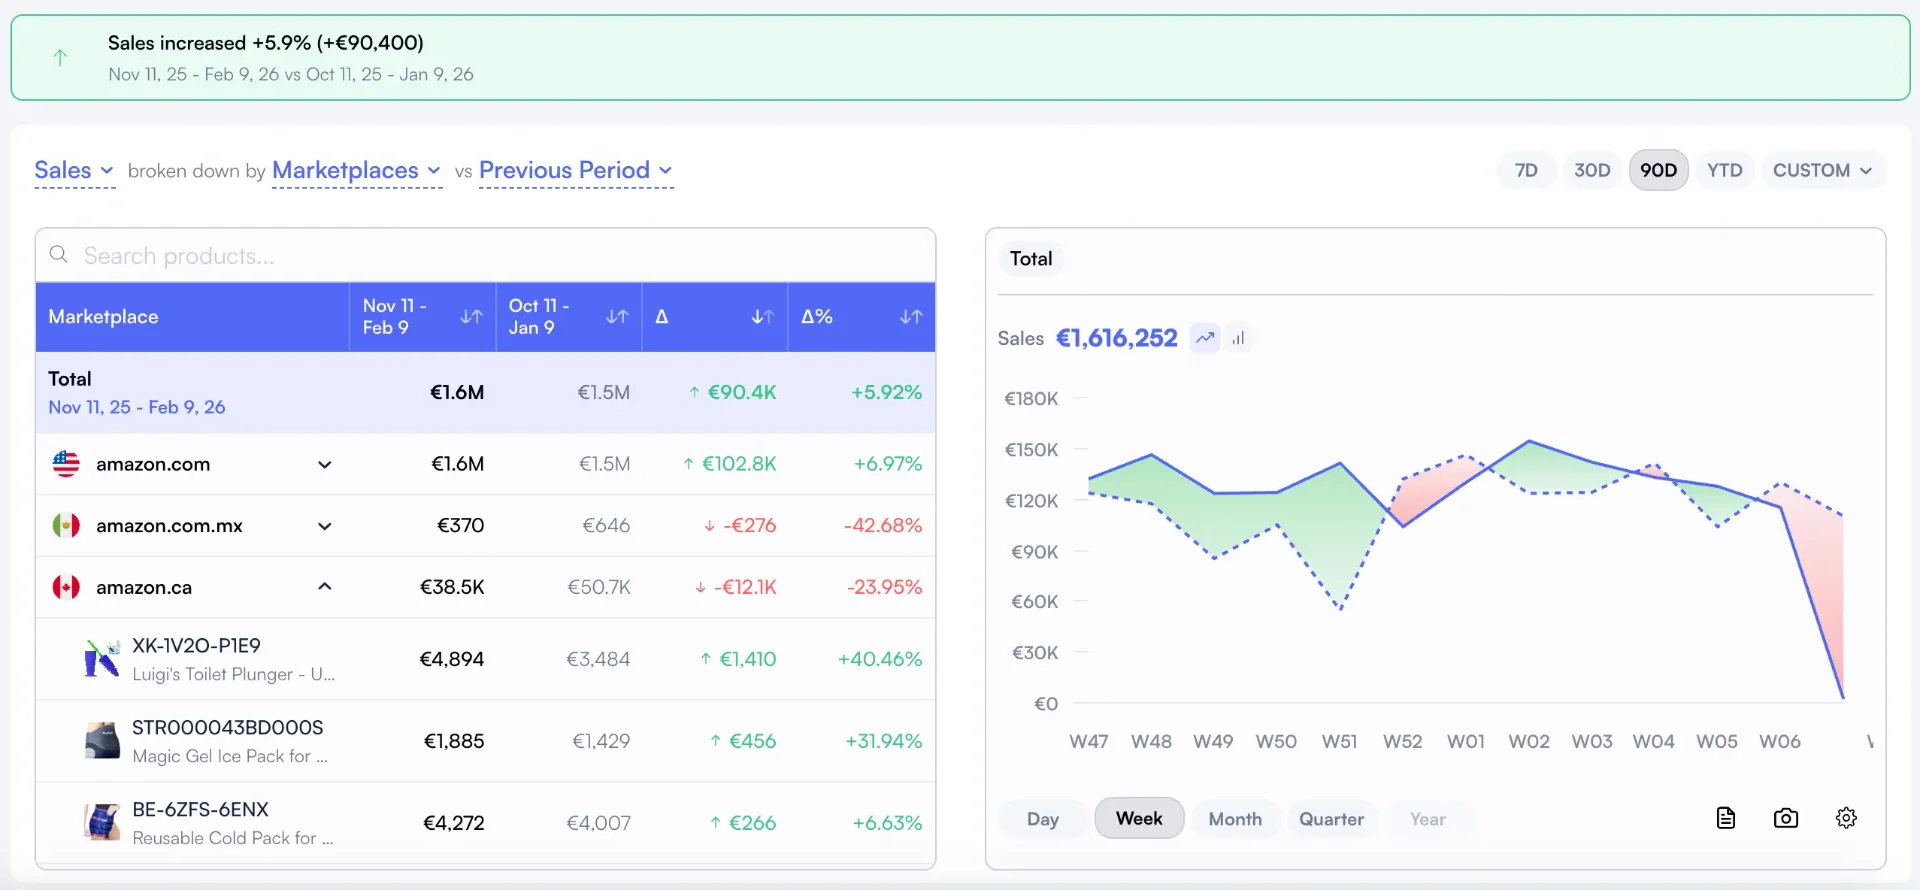
Multi-Marketplace Sales Tracking
If you sell on more than one Amazon marketplace, your sales analytics need to handle currency conversion, marketplace-specific fee structures, and unified reporting. Seller Central forces you to log into each marketplace separately. You can't see total global revenue in a single view.
Amazon now operates in 23 countries, and cross-border selling has grown by over 25% year-over-year. Sellers managing 3 or more marketplaces need consolidated analytics to avoid blind spots.
The challenge isn't just data aggregation. Fee structures differ between marketplaces. FBA fees in Germany aren't the same as the US. Referral percentages vary by category and country. Your analytics tool needs to apply the correct fee schedule for each marketplace automatically. Nova handles this across all 21 marketplaces with marketplace-specific fee calculations. See our cross-marketplace reporting guide for details.
Building Your Sales Analytics Stack
The best Amazon sellers don't rely on a single tool. They build a stack where each component handles what it does best. Here's what that looks like in practice.
The Recommended Stack
- Sales and profit analytics: A dedicated tool with hourly refresh, SKU-level P&L, and custom segmentation. This is your daily operating system.
- Product research: A separate research tool for finding new opportunities, tracking competitors, and estimating market demand.
- PPC management: Campaign-level tools that connect ad spend to actual profitability, not just ACoS.
- Data warehouse (optional): for sellers doing $5M+ annually who need raw data in BigQuery or Snowflake for custom models.
Nova covers the sales and profit analytics layer with 99.8% P&L accuracy, hourly refresh, and built-in PPC analytics that ties ad spend to product-level profit. For a detailed comparison of the full tool landscape, see our best Amazon analytics tools guide.
Common Sales Analytics Mistakes (and How to Avoid Them)
Mistake 1: Tracking revenue without profit
Revenue growth feels good. But if your costs grow faster than revenue, you're scaling a loss. Every sales dashboard should show contribution margin alongside revenue. If it doesn't, you're flying blind.
Mistake 2: Relying on 24-hour-old data
Seller Central's batch reporting means you're always looking at yesterday's problems. A Buy Box loss, a pricing error, or a listing suppression can cost you thousands before you even know it happened. Hourly refresh is the minimum for serious sellers.
Mistake 3: No custom segmentation
Looking at aggregate account metrics hides what matters. A $300K account can have 50 profitable SKUs subsidizing 15 losers. Without segmenting by brand, lifecycle, or margin tier, you'll never find them. Nova's Custom Breakdowns Solve this.
What the best sellers do differently
They check five metrics every morning in under 10 minutes: revenue by top SKUs, Buy Box percentage, TACoS, conversion rate, and yesterday's profit margin. They tag products by lifecycle stage. They set alerts for anomalies. And they review their full P&L weekly, not monthly. Learn the exact routine in our weekly business review checklist.
Getting Started with Amazon Sales Analytics
You don't need to overhaul everything at once. Start with these three steps and build from there.
Step 1: Connect your data
Link your Seller Central account to an analytics tool that pulls data automatically. Manual CSV exports don't scale. Authorization takes about 5 minutes. Historical data loads within 2 to 24 hours depending on the tool.
Step 2: Set up your daily dashboard
Configure a single-screen view with the five metrics that matter: revenue by SKU, units sold, conversion rate, Buy Box percentage, and TACoS. Nova's Day-to-Day dashboard comes pre-configured with these.
Step 3: Tag your products
Create at least three tag categories: brand (or supplier), lifecycle stage (launch, growth, mature, decline), and margin tier (high, medium, low). This takes 30 minutes for most catalogs and immediately reveals patterns your aggregate data hides.
Frequently Asked Questions
Frequently Asked Questions
Find answers to common questions about our platform
Sources
- [1] Marketplace Pulse, "Amazon Seller Data & Trends." marketplacepulse.com
- [2] Amazon Seller Central, "FBA Fee Changes and Updates." sell.amazon.com
Ready to Transform Your Amazon Business?
Join thousands of successful sellers who use Nova Analytics to make data-driven decisions and maximize their profits.
Related read
Amazon BSR Guide: track Best Sellers Rank by ASIN
Continue Learning
Explore more expert insights to grow your Amazon business
Ecommerce Profit Analytics: Why Amazon Is Your Blind Spot
Ecommerce teams track Shopify margins in 2 clicks. Amazon's 40+ fee types make profit invisible. Learn how to close the visibility gap and stop flying blind on your biggest channel.
Amazon Seller Analytics: The Complete 2026 Guide
Five types of analytics every Amazon seller needs, how to choose the right tools, and the mistakes that cost thousands in missed profit. A comprehensive guide for sellers at every stage.
Why Amazon profit tracking is broken in 2026
Seller Central reports lie by omission, spreadsheets buckle under 40+ fee types, and most analytics tools paper over the gaps. Here is what actually broke and how serious operators are fixing it.