
Ecommerce Profit Analytics: Why Amazon Is Your Blind Spot
Ecommerce teams track Shopify margins in 2 clicks. Amazon's 40+ fee types make profit invisible. Learn how to close the visibility gap and stop flying blind on your biggest channel.
Ecommerce profit analytics is how brands figure out where money actually goes across their sales channels. If you're running a Shopify store alongside Amazon, you already know the difference. Shopify shows your margins in two clicks. Amazon? You'll need to decode 40+ fee types, reconcile delayed settlement reports, and somehow connect PPC spend to individual SKUs before you get anything close to a real profit number.
That gap is the problem. Amazon represents over 37% of US ecommerce sales, making it the single largest channel for most multi-channel brands. Yet it's also the channel where profit visibility is the worst. This guide explains why Amazon is your analytics blind spot, what ecommerce teams consistently get wrong, and how to build the profit visibility you already have on every other channel.
TL;DR - Key Takeaways
- •Shopify margins show up in 2 clicks. Amazon's 40+ fee types make true profitability invisible without dedicated tools.
- •Most ecommerce teams overestimate Amazon margins by 15 to 25 percentage points because they only track CM1 (revenue minus COGS).
- •Amazon isn't just another sales channel. Its fee complexity demands a specialized analytics layer.
- •Contribution margin analysis (CM1, CM2, CM3) is the framework that closes the visibility gap.
- •Brands that add Amazon-specific profit tracking typically find 2 to 4 products losing money within the first week.
Global Ecommerce Market
$6.3T
2024 worldwide ecommerce revenue
Amazon Fee Types
40+
Distinct fee categories affecting seller margins
Margin Visibility Gap
15-25%
How much teams overestimate Amazon margins
The Ecommerce Profit Visibility Problem
Every ecommerce brand tracks profitability. The question is how accurately. On your DTC channels, it's straightforward. Shopify gives you revenue minus payment processing minus product cost. Your margins are visible in real time. Google Analytics 4 tracks conversion costs. Your email platform shows campaign ROI.
Then there's Amazon. The largest ecommerce marketplace in the world, and the one where your profit data is the most opaque. Here's what that looks like in practice:
| Channel | Margin Visibility | Data Delay | Fee Complexity | SKU-Level P&L |
|---|---|---|---|---|
| Shopify / DTC | Built-in | Real-time | Low (2-3 fee types) | Native |
| Google Ads / Meta | ROAS built-in | Near real-time | Low | Campaign-level |
| Amazon | Requires assembly | 24-72 hours | Very high (40+ types) | Not native |
| Walmart | Partial | 24 hours | Medium (10-15 types) | Limited |
The pattern is obvious. Amazon is the outlier. It's the only major channel where you can't see your real margins without building (or buying) a dedicated analytics layer. And for most ecommerce brands, Amazon is also their largest or second-largest channel by revenue. That combination creates a dangerous blind spot.
Why Amazon Is Your Blind Spot
It's not that Amazon hides data from you. The data exists. The problem is how it's structured. Amazon distributes profit-relevant information across at least seven different reports, each with its own format, time range, and update cadence.
Here's what makes Amazon fundamentally harder to analyze than any other ecommerce channel:
- 40+ distinct fee types. Referral fees, FBA pick-and-pack, storage fees (monthly and long-term), inbound placement fees, return processing fees, removal order fees, advertising fees, and more. Each one varies by category, product size, and season.
- Fees change without notice. Amazon adjusts FBA rates, storage surcharges, and referral percentages multiple times per year. Your January margins can disappear by March if you're not tracking fee changes at the SKU level.
- PPC attribution is fragmented. Sponsored Products, Sponsored Brands, and Sponsored Display each have separate reporting structures. Connecting ad spend to actual product-level profitability requires joining multiple data sources. Tracking PPC ROI per product is a solved problem, but it doesn't happen automatically.
- Settlement reports lag 24 to 72 hours. By the time you see final numbers in Seller Central, the problem (a stock-out, a fee spike, a PPC budget blow-up) has already cost you money.
- Returns impact profit retroactively. A return on Day 30 changes the profitability of a sale from Day 1. Without retroactive recalculation, your margin snapshots are always wrong.
The Hidden Cost Problem
The real cost isn't the fees you know about. It's the fees you don't see until settlement day. Inbound placement fees, long-term storage surcharges, and return processing costs are the three most commonly missed line items. Together, they can shave 3 to 8 percentage points off your gross margin without appearing in any standard revenue report.
For ecommerce teams accustomed to Shopify's clean margin reports, Amazon feels like stepping back a decade in analytics capability. That's not an exaggeration. Research on data-driven organizations shows that companies that can't measure profitability at the unit level consistently make worse allocation decisions. Amazon's reporting gaps force exactly that kind of blindness.
What Ecommerce Teams Get Wrong About Amazon Analytics
Most ecommerce teams don't ignore Amazon analytics. They apply the wrong framework. Here are the three mistakes we see repeatedly:
Mistake 1: Treating Amazon Like Shopify
Your Shopify analytics workflow doesn't transfer. On Shopify, revenue minus COGS minus payment processing gives you a close approximation of margin. On Amazon, that same calculation ignores 35+ cost categories. Teams that apply their DTC analytics framework to Amazon consistently overestimate margins by 15 to 25 percentage points.
Mistake 2: Ignoring Contribution Margin
Revenue is not profit. A product doing $80K per month in Amazon revenue might be generating $4K in actual contribution margin after all fees and ad spend. Or it might be losing $2K. You won't know until you calculate CM3 (revenue minus COGS minus all Amazon fees minus advertising). Learn more in our contribution margin guide.
Mistake 3: Monthly Reviews Instead of Daily Tracking
Monthly P&L reviews are table stakes for DTC. On Amazon, they're not enough. Fee changes, PPC spend spikes, and competitor actions can erode margins within days. Teams that review daily dashboard metrics Catch problems 5 to 10 days faster and recover thousands in profit per quarter.
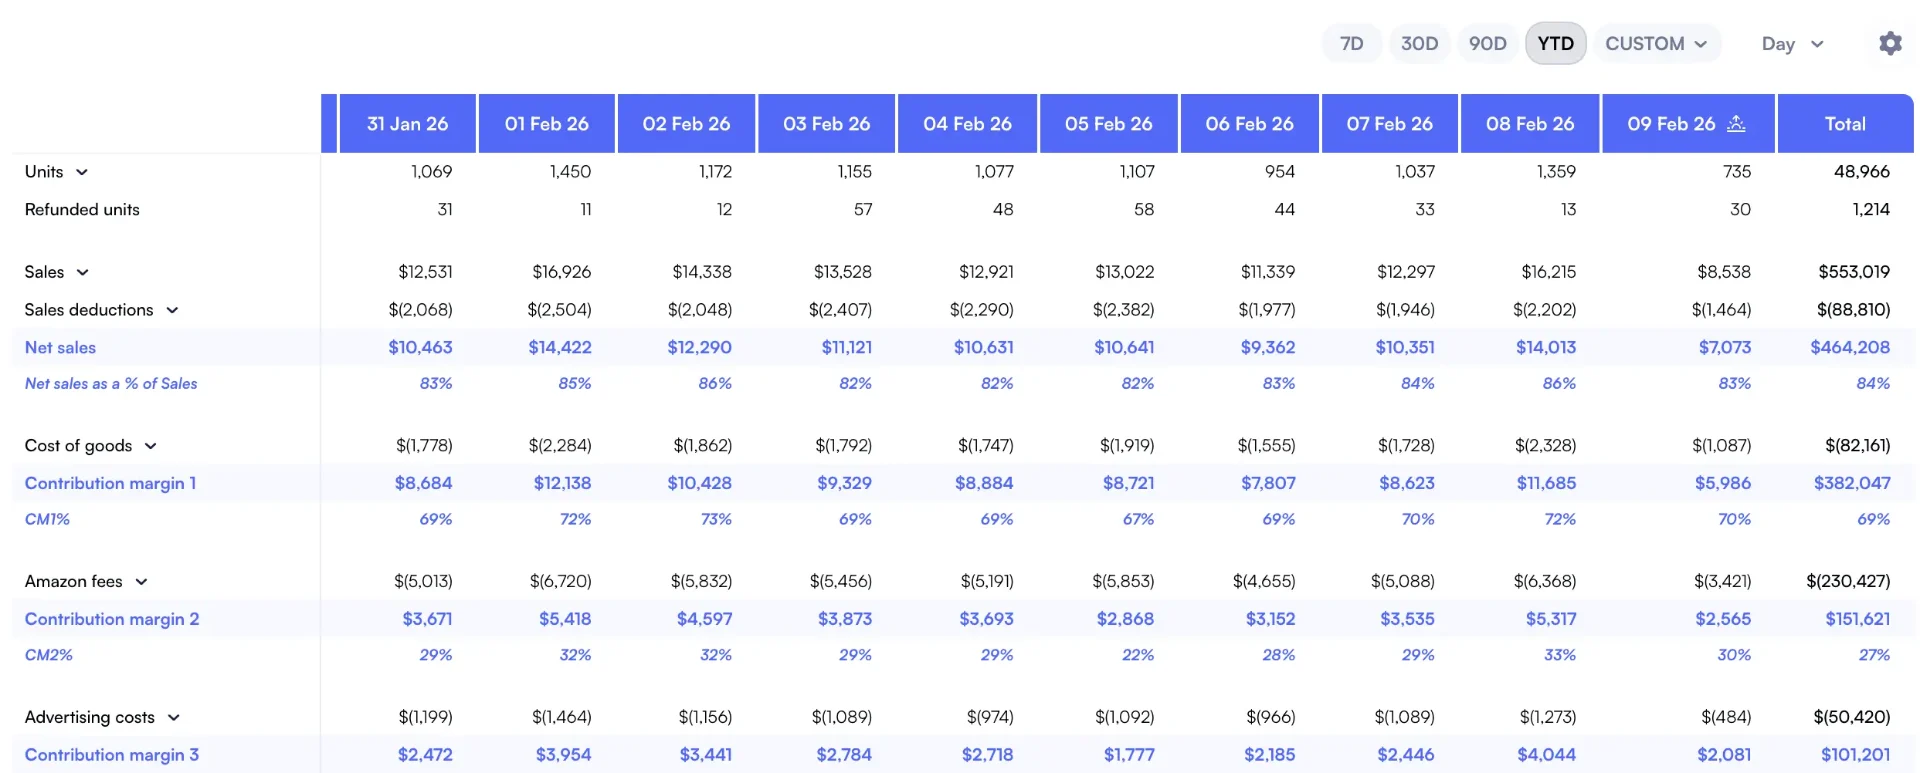
Nova's Profit & Loss dashboard Breaks down all 40+ Amazon fee types at the SKU level
Get More Amazon Seller Tips
Subscribe to our newsletter for weekly insights, strategies, and market updates.
Building Your Amazon Profit Analytics Stack
Your ecommerce analytics stack probably looks something like this: Shopify for DTC, Google Analytics 4 for website behavior, a BI tool for cross-channel reporting. That stack has a massive gap where Amazon should be. Here's how to close it.
A proper Amazon analytics layer needs to handle four things that no general ecommerce tool can:
- Fee disaggregation. Breaking Amazon's bundled charges into 40+ individual fee types so you can see exactly what's eating your margin on every SKU. This is what a dedicated P&L analytics tool does.
- COGS allocation at the SKU level. Connecting your landed cost data to each product so contribution margin calculations are accurate. Learn how in our COGS tracking guide.
- PPC-to-product attribution. Mapping advertising spend to the specific products it generates sales for, not just campaign-level ROAS. This is where TACoS tracking becomes essential.
- Daily refresh cadence. Amazon data that's 72 hours old is already too late for operational decisions. Tools with hourly or near-real-time refresh give you the speed to react. See our guide on near real-time analytics value.
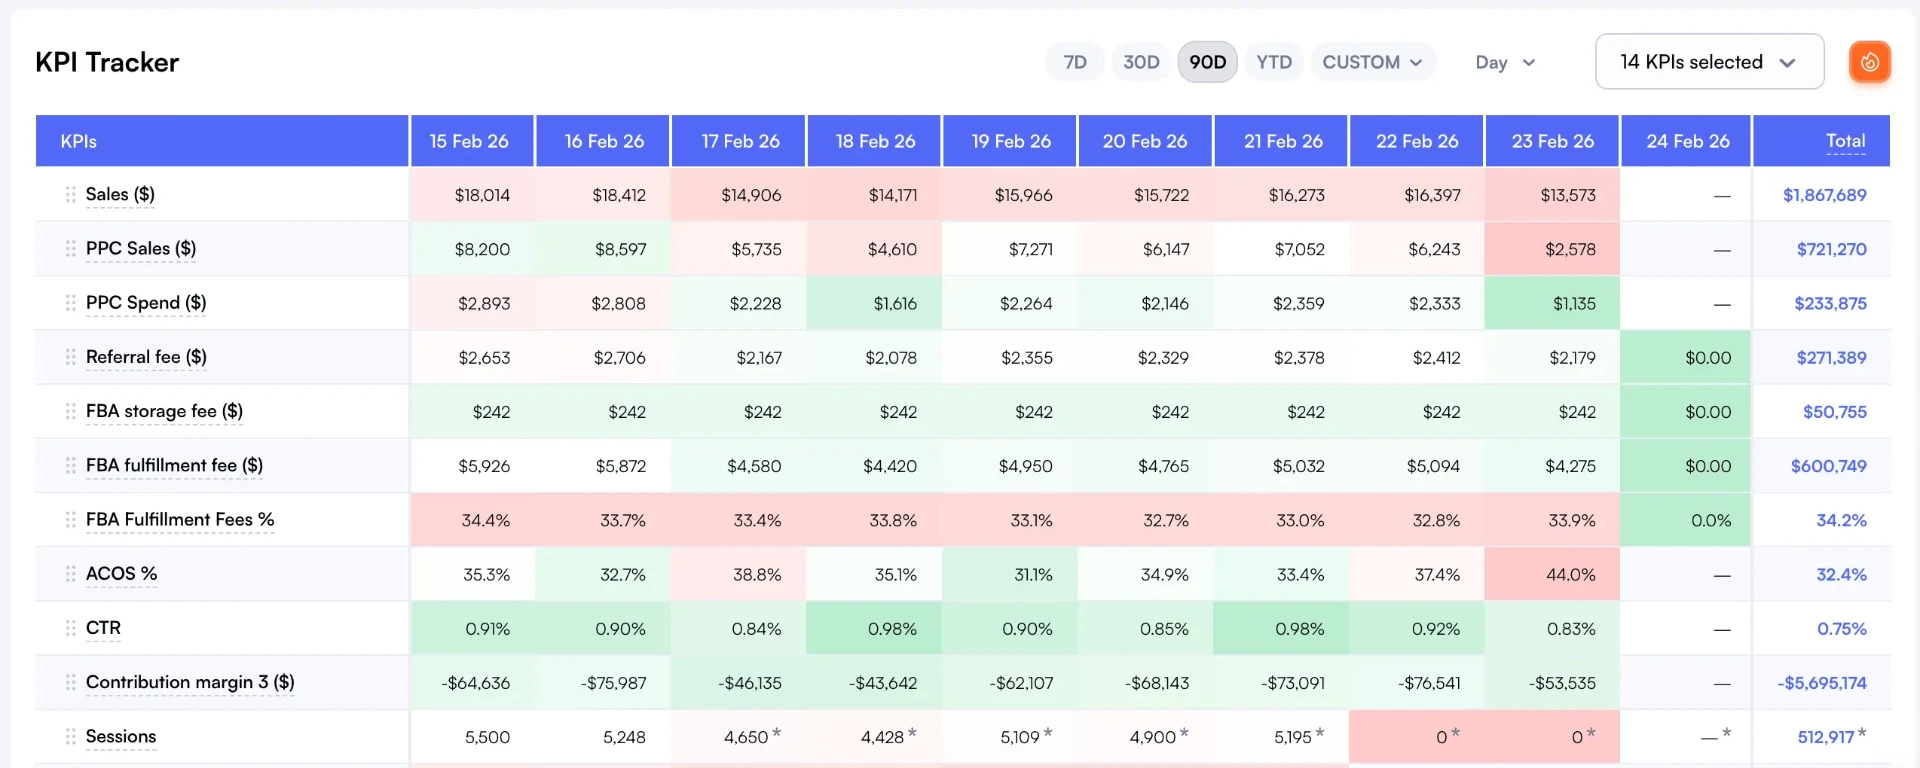
Nova's Day-to-Day dashboard gives ecommerce teams daily visibility into Amazon performance alongside their other channels
What to Look for in an Amazon Analytics Layer
Not all Amazon analytics tools solve the ecommerce team's specific problem. When evaluating options, prioritize these capabilities:
- Multi-marketplace support. If you sell on Amazon US, UK, DE, and JP, you need consolidated reporting across all marketplaces. Check our cross-marketplace reporting guide.
- Custom segmentation. The ability to tag and segment products by brand, category, lifecycle stage, or margin tier.
- Exportable data. Your BI team needs to pull Amazon data into their existing dashboards. Look for custom analytics and API access.
- Historical depth. You need at least 12 months of historical data for seasonality analysis and year-over-year comparison.
For a comprehensive comparison of available tools, see our best Amazon analytics tools comparison.
Contribution Margin Analysis: The Missing Metric
If you're running ecommerce analytics without contribution margin analysis, you're making decisions with incomplete data. Here's the framework that closes the gap:
| Level | Formula | What It Tells You | Typical Amazon Result |
|---|---|---|---|
| CM1 | Revenue - COGS | Gross product margin | 50-70% |
| CM2 | CM1 - Amazon Fees | Margin after marketplace costs | 15-30% |
| CM3 | CM2 - Ad Spend | True profit per unit | 5-15% |
The jump from CM1 to CM3 is where most ecommerce teams lose visibility. A product with 60% CM1 looks fantastic. That same product at 8% CM3 is barely worth selling. And at -2% CM3, it's actively burning cash every time someone orders it.
Research on margin optimization shows that companies tracking profitability at the unit level grow margins 2 to 3x faster than those using aggregate-level analysis. For Amazon sellers, unit-level means SKU-level. Not category-level. Not brand-level. Every individual product.
For a deeper dive into the contribution margin framework, read our complete Amazon contribution margin guide. And for building the full P&L view, see the Amazon P&L statement guide.
How Ecommerce Brands Use Nova for Amazon
Nova fills the Amazon-shaped hole in your ecommerce analytics stack. Here's what that looks like for a typical multi-channel brand:
Case Study: Home Goods Brand Finds Hidden Losses
A home goods brand doing $2.4M annually across Shopify and Amazon connected Nova in their first week. Their Shopify margins were healthy at 42%. They assumed Amazon was similar.
Reality: Amazon CM3 was 7% across their catalog. Three SKUs (representing 28% of Amazon revenue) were running at negative CM3 after accounting for FBA fees, long-term storage, and PPC spend. They'd been losing roughly $4,200 per month on those three products for over a year.
Within 60 days of implementing Nova's P&L analytics, they cut the three loss-making SKUs, reallocated ad budget to their top performers, and improved overall Amazon CM3 from 7% to 14%. That's $12,600 per month in recovered profit.
This pattern repeats across ecommerce brands of every size. The visibility problem isn't unique to small sellers. Brands doing $10M+ on Amazon have the same blind spots. Sometimes bigger ones, because the complexity scales with catalog size.
Nova is built for exactly this problem. Whether you're a brand manager running Amazon alongside DTC, or an agency Managing Amazon for multiple brands, the need is the same: real profit data at the SKU level, refreshed daily, with all 40+ fee types disaggregated. You can explore the full platform at our Amazon analytics software page.
Cross-Channel Profit Comparison
According to Google's omnichannel research, brands selling on three or more channels grow revenue 190% faster than single-channel brands. But growth without profit visibility is dangerous. The brands that win aren't just multi-channel. They're the ones that know exactly how much profit each channel generates per product, per day. That's what ecommerce profit analytics is really about.
For more context on how Amazon analytics connects to broader ecommerce operations, check out our Amazon sales analytics guide and the profit audit for hidden leaks.
Ecommerce Profit Analytics FAQ
Common questions about tracking Amazon profitability within your ecommerce analytics stack
Ready to Transform Your Amazon Business?
Join thousands of successful sellers who use Nova Analytics to make data-driven decisions and maximize their profits.
Continue Learning
Explore more expert insights to grow your Amazon business
Amazon Sales Analytics
Revenue is vanity, profit is sanity. Amazon sales analytics connects your top-line numbers to actual profitability. Learn the 5 metrics that matter, why Seller Central falls short, and how to build a sales analytics stack that catches problems the same day.
Why Amazon profit tracking is broken in 2026
Seller Central reports lie by omission, spreadsheets buckle under 40+ fee types, and most analytics tools paper over the gaps. Here is what actually broke and how serious operators are fixing it.
Amazon Contribution Margin Calculator
Gross profit tells you if a product is viable. Contribution margin tells you if it's worth your time. Learn how to calculate CM1, CM2, and CM3 for Amazon products with category benchmarks and strategic applications.