Top 1% sellers don't have more time. They have better review habits. Learn the exact 15-minute daily check, 45-minute weekly deep dive, and 30-minute monthly review that elite Amazon sellers use to catch problems early and spot opportunities others miss.
Top 1% sellers don't have more time. They have better review habits. While most sellers scramble through Seller Central reacting to problems after they've cost thousands, elite performers catch issues in their first 48 hours using structured weekly business reviews. This perspective comes from sitting next to brand managers during weekly P&L reviews.
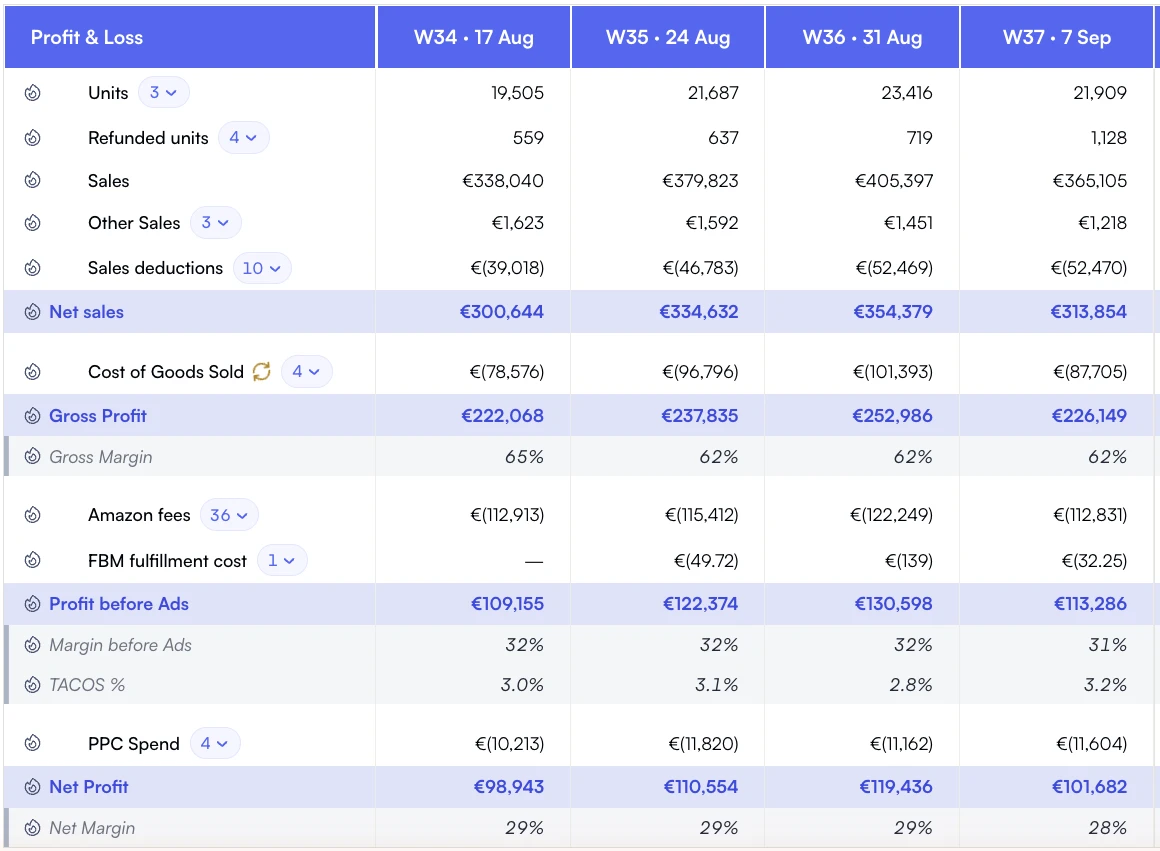
A weekly P&L puts margin changes and advertising pressure in the same review.
According to Harvard Business Review research on data-driven decision making1, companies using structured analytics reviews outperform competitors by 5-6% in productivity and profitability. For Amazon sellers managing $500K to $5M annually, that's $25K to $300K in additional profit from better review processes alone.
This guide breaks down the exact 15-minute daily check, 45-minute weekly deep dive, and 30-minute monthly strategic review that top sellers use. No fluff. Just the specific metrics you need to track and the decisions each metric should trigger.
Why weekly reviews beat monthly reports
Monthly reviews are autopsies. Weekly reviews are health checks. When you discover a problem 30 days after it started, you've already lost a month of potential profit. Weekly reviews catch issues in their first week, limiting damage to 7 days instead of 30.
Research from McKinsey on operational analytics2 shows that reducing decision latency (time between data generation and action) by 75% can improve operational efficiency by 15-25%. Weekly reviews cut your decision latency from 30 days to 7 days, an 77% reduction.
Problem Detection Speed
7 days
Weekly reviews vs 30+ days with monthly reports
Cost of Delayed Action
$2-8K
Average loss from catching inventory issues 30 days late
Decision Quality
34% better
Improvement in strategic choices with weekly data reviews
Here's the compound effect: A weekly review takes 45 minutes. That's 3 hours per month. A monthly review takes 2-3 hours. Same time investment, but weekly reviews give you four opportunities to catch problems versus one. Nova's Day-to-Day Analytics makes these reviews faster by pre-calculating the metrics that matter.
The 15-minute daily check (foundation)
Your daily check isn't about deep analysis. It's about catching fires while they're still small. You're looking for red flags that need immediate attention, not strategic insights. Think of this as your morning health check, not your annual physical.
Here are the five daily metrics that catch 80% of critical issues before they become expensive problems:
1. Units sold vs. Yesterday
Look for drops exceeding 15% on products that typically sell 5+ units daily. A 20% drop on a product moving 8 units per day means you've lost 1-2 sales. That might signal a Buy Box loss, competitor price drop, or listing suppression.
Action trigger: 15%+ drop → Check Buy Box status, verify listing is live, review competitor pricing in your niche.
2. Ad spend vs. Sales (quick TACoS check)
You're looking at ad spend as a percentage of total revenue. If your typical TACoS is 12% and today you're at 19%, something's wrong. Either ad spend spiked or organic sales dropped. Both need investigation.
Action trigger: TACoS up 5+ percentage points → Review yesterday's ad changes, check for organic sales decline. Learn more about tracking TACoS effectively.
3. Inventory days remaining (top 10 SKUs)
Check your top 10 revenue-generating products. Any product below 21 days of inventory needs action. Below 14 days is critical. According to Amazon's inventory management guidelines3, maintaining 30+ days of stock optimizes IPI score and prevents stockouts.
Action trigger: below 21 days → Initiate reorder process. Below 14 days → Expedite shipping if possible.
4. Return rate anomalies
Your baseline return rate might be 8%. If any product jumps to 15%+ in daily returns, investigate immediately. High return rates can trigger Amazon account health reviews and destroy product profitability.
Action trigger: Return rate doubles baseline → Check recent reviews, inspect inventory for defects, verify product match listing.
5. Negative feedback or reviews
One 1-star review on a product with 47 reviews is annoying. One 1-star review on a new product with 8 reviews is catastrophic. Daily monitoring lets you respond fast and mitigate damage before conversion rates tank.
Action trigger: any 1-2 star review → Respond within 24 hours, investigate root cause, update listing if needed.
Pro Tip: Dashboard automation
Don't manually calculate these metrics. Use Nova's daily performance dashboard which surfaces these five critical metrics automatically every morning. What takes 15 minutes manually takes 3 minutes with the right dashboard.
The 45-minute weekly deep dive
This is where strategic decisions happen. Your weekly review digs into the "why" behind your daily observations. You're not just catching fires, you're identifying patterns that prevent future fires and spotting opportunities that others miss.
Block 45 uninterrupted minutes every Friday or Monday. Use the same day weekly for consistency. Here's the exact framework:
1. Profitability health check (12 minutes)
Start with total profit, then drill down to product-level margins. You're looking for three things: overall trend direction, products that moved significantly, and margin compression signals.
Week-over-week profit change
Compare this week's net profit to last week. Growth is good, but dig into why. If profit grew 18% but units only grew 8%, your margins improved. That's a strategy worth understanding and repeating. Nova's P&L dashboard breaks down profit drivers automatically.
Product-level profit shifts
Sort products by profit change. Which 5 products gained the most profit this week? Which 5 lost the most? Winners might warrant increased ad spend. Losers need root cause analysis, did fees increase, returns spike, or organic ranking drop?
Margin compression indicators
Calculate gross margin (revenue minus COGS and fees, before ad spend) for each product. Healthy margins are 35%+ for most categories. Below 25% is concerning. If margins compressed week-over-week, identify whether it's rising costs or falling prices.
According to Gartner research on financial planning4, businesses conducting weekly profit analysis reduce budget variance by 30% compared to monthly reviews. You catch margin erosion at $2K, not $8K.
2. Product performance analysis (15 minutes)
This is your "winners and losers" analysis. You're identifying which products deserve more investment and which products need intervention or retirement.
Performance Tier
Criteria
Action
Winners
Growing revenue + 35%+ margin + in stock
Increase ad budget 15-25%, consider expanded keyword targeting
Watch List
Stable revenue but declining margin OR high revenue but stockout risk
Investigate margin compression causes, expedite inventory if needed
Losers
Declining revenue + below 25% margin OR negative profit
Reduce/pause ad spend, evaluate discontinuation, test price adjustment
Use Nova's Winners & Losers report to segment products automatically. Tag winners for increased investment. Tag losers for review meetings. This categorization should drive your Q2 planning decisions.
Research from Forrester on analytics best practices5 shows that businesses using systematic product performance reviews identify optimization opportunities 40% faster than ad-hoc reviewers.
3. Inventory and cash flow review (10 minutes)
Inventory problems are cash flow problems. Every dollar sitting in excess inventory is a dollar not available for winning products. Your weekly inventory review prevents both stockouts (lost sales) and overstock (tied-up cash).
Stockout risk assessment
List all products with fewer than 30 days of inventory based on weekly sales velocity. Prioritize by revenue contribution. Your top 20% revenue generators should never drop below 45 days of stock.
Overstock identification
Any product with 120+ days of inventory is a cash flow liability. Calculate total capital tied up in overstock. If you have $40K in products with 180+ days of inventory, that's $40K unavailable for growth opportunities or urgent reorders.
Weekly cash deployment plan
Review this week's settlement amount. Allocate capital to three buckets: urgent reorders (products below 30 days), growth investments (winners that need more inventory), and reserve (minimum 15% for unexpected opportunities or costs). Use Nova's Seller Cockpit to monitor portfolio performance across your catalog.
4. Advertising efficiency audit (8 minutes)
You're not optimizing individual campaigns weekly, that's a daily task. Your weekly ad review looks at portfolio-level trends and identifies systematic problems that daily checks miss.
TACoS trend analysis
Compare this week's TACoS to your 8-week average. TACoS rising while revenue is flat means you're becoming dependent on ads without growing total business. TACoS falling while revenue grows is the ideal scenario, organic momentum.
Campaign profitability check
Calculate profit per campaign (not just ACoS). A campaign with 25% ACoS might look efficient, but if the product only has 30% total margin, you're making 5% on advertising and losing money on stockouts caused by demand you can't fulfill.
Budget allocation adjustments
Shift 10-15% of budget from underperforming campaigns to overperforming ones. Look for campaigns that consistently hit daily budget caps with strong ROAS. Those deserve more investment. For detailed PPC tracking strategies, see our guide on tracking PPC ROI per product.
Review Frequency
Focus
Outcome
Daily (15 min)
Fire detection: immediate issues requiring action
Prevent small problems from becoming expensive disasters
Weekly (45 min)
Pattern recognition: trends and optimization opportunities
Strategic adjustments that compound over time
Monthly (30 min)
Strategic planning: portfolio decisions and goal tracking
Align operations with quarterly business objectives
Monthly strategic review (30-minute framework)
Your monthly review is different from your weekly reviews. You're zooming out to assess progress toward quarterly goals, evaluate portfolio strategy, and make bigger decisions that weekly data doesn't support.
Schedule this on the same day each month (first Monday or last Friday works well). Here's what to cover:
Monthly profitability trends
Compare month-over-month net profit, gross margin, and operating margin. Look for 3-month trends. Is profit growing faster than revenue (margin expansion) or slower than revenue (margin compression)? This trend determines your pricing and cost strategy for next quarter.
Product portfolio health
Calculate what percentage of revenue comes from your top 20% of products. Healthy diversification is 60-70% from top products, 30-40% from the rest. Over 80% concentration is risky. Under 50% might signal lack of clear winners. Use Nova's Custom Breakdowns to segment products by strategic importance.
Customer acquisition cost trends
Calculate blended CAC: total ad spend divided by new customers acquired (first-time purchasers). If CAC is rising while customer lifetime value stays flat, your business is becoming less profitable over time. This is the metric that predicts sustainability.
Operational efficiency metrics
How many SKUs did you manage this month? What was revenue per SKU? Top performers typically generate $4K-$8K monthly revenue per SKU. Below $2K per SKU suggests product proliferation without profitability. Consider SKU rationalization. Learn more about SKU optimization strategies.
Strategic goal progress check
Review progress toward quarterly targets. If your Q1 goal was $300K revenue and you did $82K in January, you're 27% to goal with 66% of quarter remaining. That's behind pace. Identify which strategic initiatives need acceleration.
According to BCG research on strategic planning6, companies that conduct monthly strategic reviews alongside weekly operational reviews achieve 23% higher goal attainment rates than those using only monthly or only weekly reviews.
Setting up your review dashboard
The right dashboard makes your reviews 3-5x faster. You're not hunting for data, it's already organized around decision-making. Here's what metrics to surface based on your business stage:
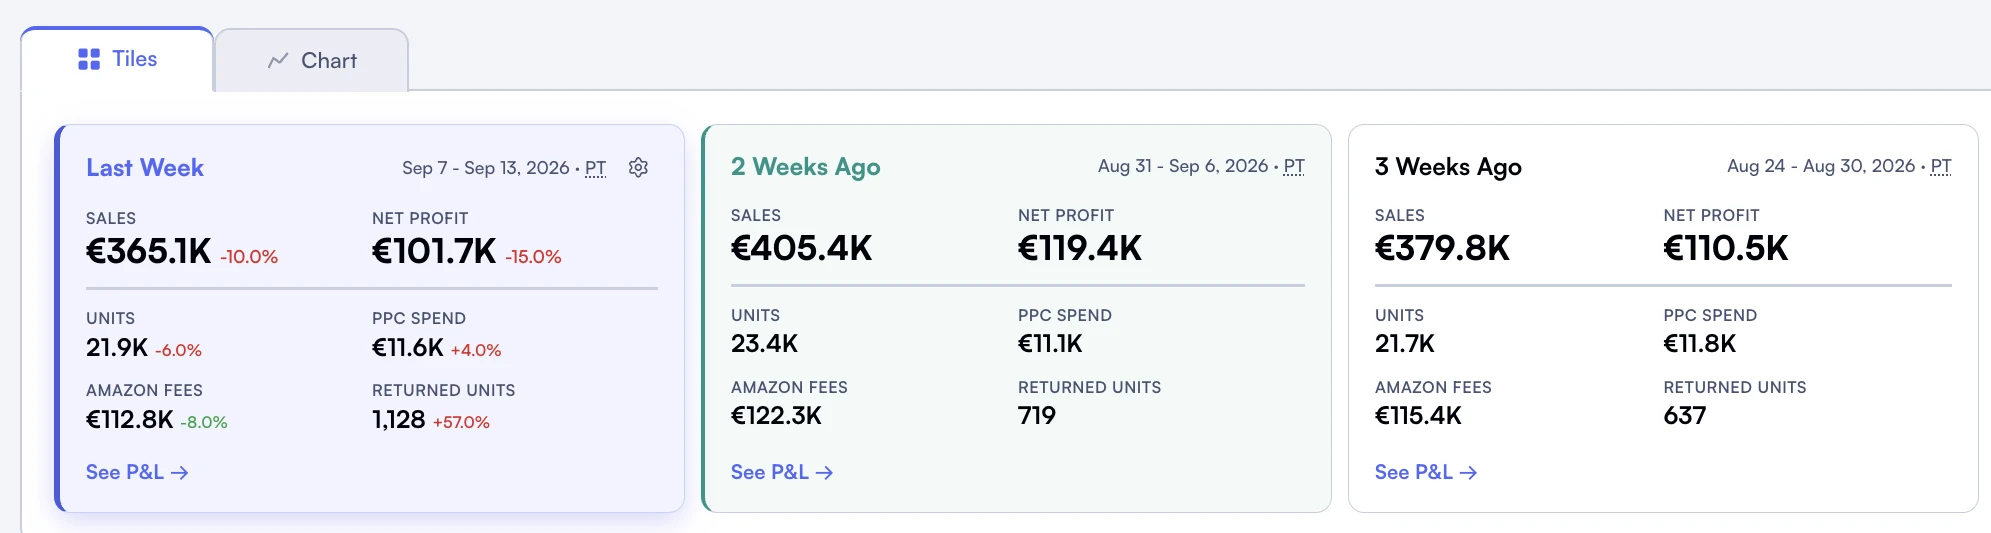
Period tiles provide a starting point for investigating changes in performance.
Business Stage
Revenue Range
Priority Metrics
Launch Phase
$0-$100K annual
Units sold, organic ranking, TACoS, cash runway
Growth Phase
$100K-$1M annual
Revenue growth rate, product-level profit, inventory turnover, ad efficiency
Scale Phase
$1M-$5M annual
Operating margin, portfolio concentration, customer LTV, CAC payback period
Optimization Phase
$5M+ annual
EBITDA margin, market share trends, team efficiency, strategic initiatives ROI
Configure Nova's Custom Analytics to surface your stage-appropriate metrics in daily, weekly, and monthly views. What takes 45 minutes with manual spreadsheets takes 12 minutes with pre-configured dashboards.
Dashboard automation saves 16 hours monthly
Manual data gathering for weekly reviews: 25 minutes per week × 4 weeks = 100 minutes monthly. Automated dashboards: 8 minutes per week × 4 weeks = 32 minutes monthly. That's 68 minutes saved weekly, or 272 minutes (4.5 hours) monthly. Scale across a team of 4, and you've saved 18 hours of productive capacity.
Common review mistakes that cost sellers money
Most sellers do weekly reviews. Few do them correctly. Here are the five mistakes that turn reviews from valuable to wasteful:
1. Reviewing vanity metrics instead of decision metrics
Page views don't matter. Sessions don't matter. Unless you're making specific decisions based on these metrics, they're vanity metrics. Focus on metrics tied to actions: profit per product (informs investment decisions), inventory days (triggers reorders), TACoS (adjusts ad strategy). Effective Amazon analytics tools prioritize actionable metrics over vanity metrics.
2. Inconsistent review timing
Doing your weekly review on Monday one week and Friday the next week breaks trend analysis. A Monday review captures weekend sales. A Friday review doesn't. Your week-over-week comparisons become meaningless. Pick one day, same time, every week. Consistency matters more than perfect day choice.
3. Analysis without action
Identifying that Product X lost 22% profit this week is useless unless you take action. Every insight should end with a decision: increase price, reduce ad spend, investigate quality issues, order more inventory. Reviews that don't trigger actions waste time.
4. Comparing wrong time periods
Comparing this week to last year's same week is misleading during growth phases. Compare to 8-week rolling average for trend analysis. Compare to last week for operational issues. Compare to same week last year only for mature, stable products. According to Google's guidance on analytics best practices7, rolling averages provide more actionable insights than year-over-year comparisons for growing businesses.
5. Solo reviewing without team input
If you manage product, advertising, and inventory alone, solo reviews work. If you have a team, involve them. Your PPC manager knows why ad spend spiked. Your inventory planner knows why stockout risk increased. Collaborative reviews catch problems you'd miss alone. For teams managing multiple brands, see how Nova supports brand manager workflows.
Warning: The "deeper analysis" trap
When you spot an issue in your weekly review, resist the urge to spend 90 minutes analyzing root causes. Schedule deeper analysis separately. Your weekly review is for identification, not investigation. Spending 2 hours on weekly reviews defeats the purpose of weekly cadence.
Worked example: what weekly cadence actually buys you
The figures below are an illustration of the mechanism, not a customer result. Take a brand reviewing monthly whose margin has drifted down over three quarters without anyone being able to say why. Monthly snapshots are not wrong, they are just too coarse to show the week the drift started.
Run the same catalogue weekly and three things surface that a monthly view averages away:
1. The bestseller that is not profitable
A product that is a third of revenue can still be near break-even once ad spend is allocated to it properly. Seller Central will not tell you, because it never charges the ad spend back to the SKU. A weekly profit view does, and it does so in week two rather than in quarter three.
2. Slow decline hiding inside "still selling"
A product losing a tenth of its velocity each month still looks alive in every monthly snapshot. Six months of that is half the velocity and a pile of aged stock. Week-over-week trend catches the slope while the inventory is still worth something.
3. Ad budget spread too thin
Spend spread across twenty-odd products usually concentrates its return in a handful of them. Ranking products by ad-attributed contribution rather than by spend tells you which ones to fund. Concentrating the same budget on the products that earn it raises profit without raising spend.
The arithmetic of the time cost
Forty-five minutes a week plus half an hour a month is about 36 hours a year. Against that, one bestseller repriced correctly, or one liquidation made two months earlier, is usually worth several thousand dollars on its own. The review does not create the opportunity, it finds it while it is still cheap to act on.
The key insight: weekly reviews don't create new optimization opportunities. They reveal existing problems weeks earlier than monthly reviews would have. Earlier detection means smaller fixes with bigger impact. For FBA sellers specifically, see how structured analytics support FBA operations.
Your weekly review template (copy this)
Here's your ready-to-use framework. Copy this checklist and complete it every week at the same time. Most sellers finish in 35-45 minutes once they've done it twice.
45-Minute Weekly Business Review Checklist
Profitability Check (12 min)
☐ Compare this week's profit to last week
☐ Identify top 5 profit gainers and top 5 profit losers
☐ Calculate gross margin for products showing margin compression
☐ Note any products below 25% gross margin for review
Product Performance (15 min)
☐ Tag winners (growing revenue + 35%+ margin + in stock)
☐ Tag watch list (stable revenue but declining margin)
☐ Tag losers (declining revenue + below 25% margin)
☐ Schedule strategy meeting for any products moving from winner to watch list
Inventory & Cash Flow (10 min)
☐ List products with fewer than 30 days inventory
☐ Calculate total capital in overstock (120+ days inventory)
☐ Allocate this week's settlement to reorders, growth, and reserve
☐ Flag any top-20% products at stockout risk
Advertising Audit (8 min)
☐ Compare this week's TACoS to 8-week average
☐ Calculate profit per campaign (not just ACoS)
☐ Identify campaigns hitting budget caps with strong ROAS
☐ Reallocate 10-15% budget from underperformers to overperformers
Action Items
☐ List 3-5 specific actions to take this week based on review
☐ Assign owner and deadline for each action
☐ Schedule any necessary deeper analysis sessions separately
Want to automate this framework? Nova's Custom Analytics provides pre-built templates for daily, weekly, and monthly reviews. Set up takes 15 minutes. Time saved per review: 25-30 minutes.
The most successful Amazon sellers aren't necessarily the best operators. They're the most consistent reviewers. Weekly business reviews turn good operators into exceptional ones by catching small problems before they become expensive disasters and spotting small opportunities before competitors do.
Ready to streamline your weekly business reviews?
Nova Analytics automates the metrics that matter. Stop spending 45 minutes gathering data. Start spending 45 minutes making decisions.