Seller Central reports lie by omission, spreadsheets buckle under 40+ fee types, and most analytics tools paper over the gaps. Here is what actually broke and how serious operators are fixing it.
By MaxPublished Apr 24, 2026Updated Oct 8, 202612 minAnalytics
Amazon profit tracking is broken in 2026, and most sellers do not realize it until the numbers stop matching. Seller Central shows one figure, the spreadsheet says another, the accounting tool produces a third, and none of them line up with what actually hit the bank account. This is not a tooling problem. It is a structural one.
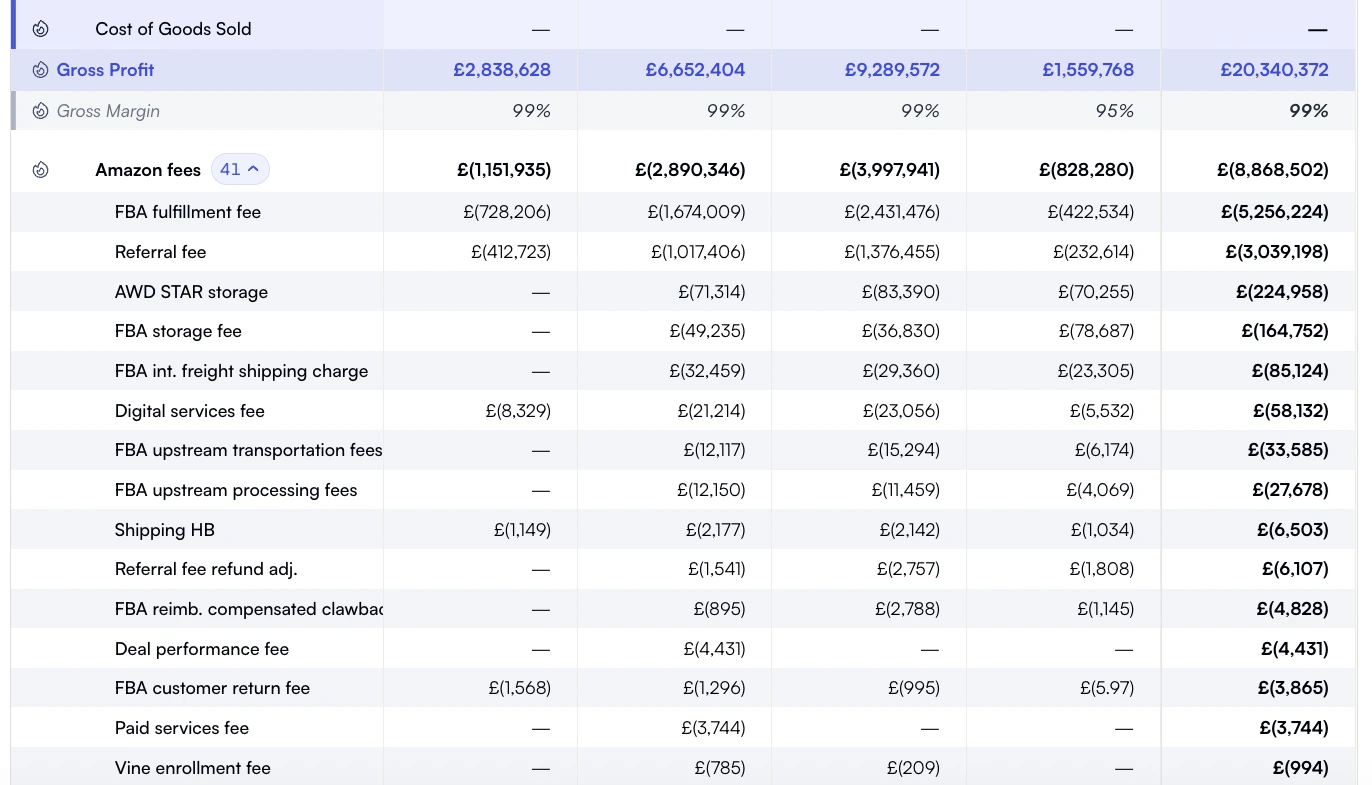
Opening the Amazon fee lines makes the costs behind your margin visible.
TL;DR - Key Takeaways
•Amazon now charges 40+ distinct fee types across FBA, AWD, Multi-Channel Fulfillment, and Buy with Prime.
•The gap between Seller Central reported profit and actual net profit averages 8 to 22 percent of revenue.
•Spreadsheets stop scaling at three predictable breakpoints: 50 active SKUs, second marketplace, second brand/account.
•Contribution margin per SKU, refreshed daily or faster, is the operational KPI that separates winners.
•The shift in 2026 is from 'analytics tool' to 'analytics operating system': one source of truth.
Our take
If you only do one thing this quarter
Run a 30-day fee leakage audit on your top 20 SKUs. Compare every fee Amazon charged against the published fee schedule and your inbound shipment receipts. Most brands recover 1 to 3 percent of revenue this way.
Best fit if
•Brands above $500K annual revenue still relying on Seller Central for profit decisions
•Operations leads who suspect the P&L numbers but cannot prove where the gap is
•Aggregators and agencies running 5+ accounts on patchwork tooling
Skip if
•New sellers under $50K revenue, where Seller Central plus a simple spreadsheet is still adequate
•Pure 1P Vendor Central operations (different fee model, different tooling)
Five years ago, calculating Amazon profit was tedious but tractable. You had referral fees, FBA fulfillment, monthly storage, and maybe long-term storage at year end. Subtract those plus COGS and PPC, and you had a workable margin per unit.
That model is dead. Since 2024, Amazon has layered in inbound placement service fees, low-inventory-level fees, AWD storage and processing, Multi-Channel Fulfillment surcharges, fuel and inflation surcharges, oversize and dangerous-goods surcharges, returns processing fees on apparel and other categories, and aged-inventory surcharges starting at 181 days instead of 271. Total Amazon fees now consume more than 50% of seller revenue on average, up from 40% in 2018.
What Seller Central shows vs what your real P&L looks like
Cost line
Visible in Seller Central
Hidden or partial
Referral fees
FBA fulfillment fee
Monthly storage
Inbound placement service
Aggregated
Low-inventory-level fee
Aggregated
Returns processing fee
Aged inventory surcharge (181-365 days)
Lumped with storage
AWD storage and processing
Separate report
MCF and Buy with Prime fees
Separate report
PPC spend attributed per SKU
DSP spend allocation
COGS, inbound freight, duties
Coupon and promotion costs
Partial
Chargebacks and SAFE-T claims
Nova insight
A complete profit calculation must include every fee, COGS, advertising spend, refunds, and other variable costs before contribution margin is evaluated.
Why spreadsheets and Sellerboard-style tools stop scaling
The three breakpoints where spreadsheets break
~50 active SKUs. Manual cost entry becomes a part-time job. One missed COGS update on a fast-mover throws the whole P&L off for weeks.
Second marketplace. Currency conversion, per-marketplace fee schedules, and VAT or sales tax add a layer of formula complexity that few spreadsheets survive without errors.
Second brand or account. Consolidation logic breaks. You end up with three spreadsheets, three sources of truth, and no consolidated number you trust.
How modern brands actually track profit across portfolios
The shift over the past 18 months has been from "analytics tool" to "analytics operating system". The distinction matters. A tool answers a question. An operating system gives every team in the company the same answer to the same question.
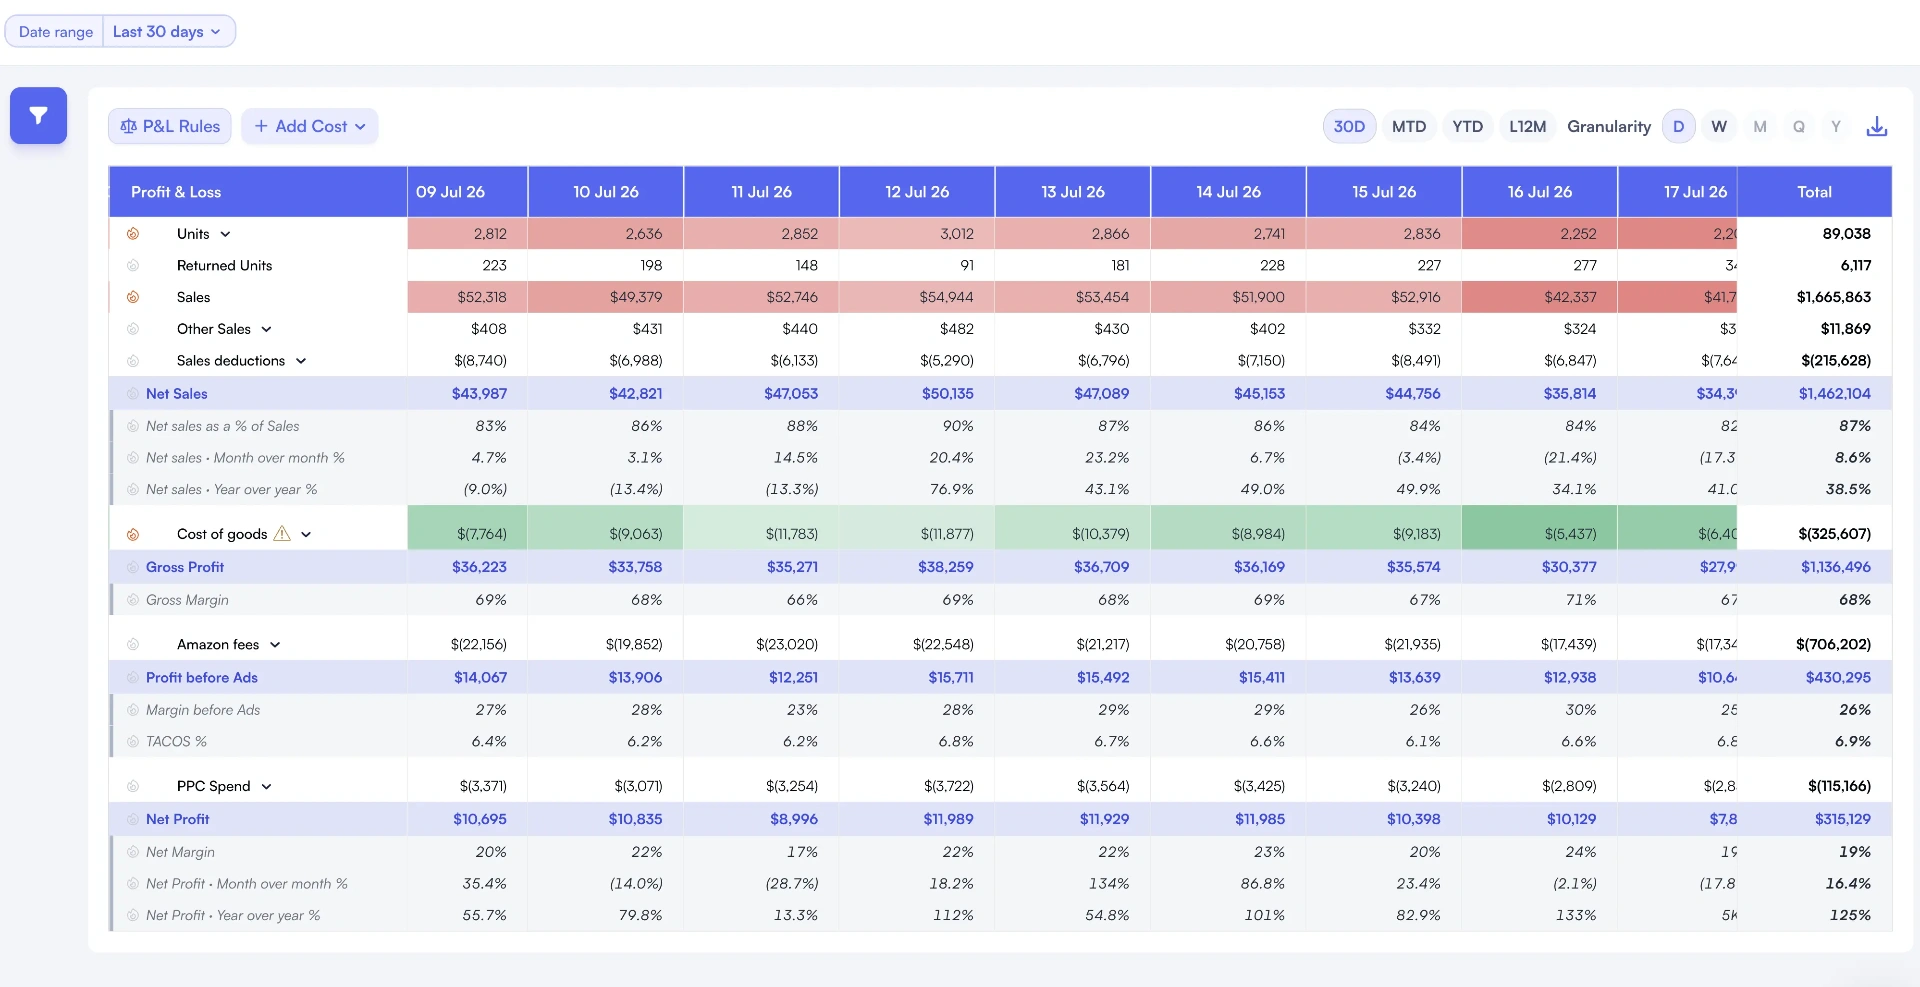
A daily profit view helps locate the days behind a change in period results.
One ingestion layer. Settlements, advertising, inventory, returns, and COGS land in one place with consistent identifiers.
One definition of every metric. "Net profit" means the same thing in finance's quarterly review and the ad team's bid optimizer.
One refresh cadence fast enough to act on. Hourly to half-hourly is the standard now.
Case study·First 30 days on Nova
Multi-brand aggregator, 12 Amazon accounts across US and EU
Aggregator with $48M annual revenue spread across 12 acquired brands. Pre-Nova stack was Sellerboard for 8 accounts, custom Google Sheets for the EU brands, and Helium 10 for ad reporting.
Hidden fee leakage found
Unknown$842K / yr
Time to consolidated P&L
4-6 weeksReal time
Fee types tracked per acct
~2240+
Reconciliation hours / mo
320
How: The single biggest finding was duplicate inbound placement fees on two brands that had been live for nine months. Both were eligible for reimbursement.
What KPIs actually matter for profit in 2026?
Vanity metrics vs profit metrics
What most dashboards show
What you should track instead
Why it matters
GMV / gross revenue
Contribution margin per SKU
Reveals which products actually pay for themselves
ACoS
TACoS + organic share
Shows whether ads grow the business or just rent traffic
Units sold
Profit per unit, net of returns
Adjusts for category-specific return rates
Sessions
Sessions to contribution dollar
Connects traffic quality to bottom-line outcomes
Inventory on hand
Days of inventory + holding cost
Storage fees compound fast on slow movers
Total ad spend
Spend per parent ASIN, allocated
Surfaces hero SKUs subsidizing dead weight
Where do you start if your current setup is broken?
Week 1 - Connect. Plug in SP-API and your ad accounts. The goal is to get a true profit number sitting next to your existing one.
Week 2 - Reconcile. Pick three SKUs and trace the variance.
Week 3 - Audit. Run the 30-day fee leakage audit on the full catalog.
Week 4 - Operationalize. Move your weekly business review off Seller Central screenshots.
The bottom line
Amazon profit tracking did not break because tools got worse. It broke because Amazon's fee structure expanded faster than the tooling category. The fix is a single operating system with line-item visibility into every fee, refreshed fast enough to act on, and unified across every account, brand, and marketplace you operate.
Frequently asked questions
Seller Central reports show gross sales, deducted referral fees, and a subset of fulfillment fees, but they do not include your COGS, inbound shipping, advertising spend allocated to the right SKU, returns processing fees, long-term storage surcharges, or chargebacks. The gap between what Seller Central reports and your real net profit is typically 8 to 22 percent of revenue, depending on your category and ad mix.
Not on their own. QuickBooks and Xero are excellent general ledgers, but they sync settlement deposits as a single line item per payout cycle. To get true product-level profit, you need a layer above accounting that explodes each settlement into the underlying 40+ fee types and attributes them back to the SKU and order.
A fee leakage audit is a 30 to 90 day review of every fee Amazon charged you against the fee schedule that should have applied. It surfaces overcharges and lost SKUs. For most brands, recoverable amounts run 1 to 3 percent of revenue and are reimbursable.
Reasonably accurate for traffic, units, and gross sales numbers, but the figures lag by 24 to 72 hours and exclude all cost lines beyond Amazon's own fees. Treat Business Reports as a top-line dashboard, never as a profit source of truth.
Spreadsheets fail at three breakpoints: when you cross roughly 50 active SKUs, when you add a second marketplace, and when you onboard a second brand or account. Most operations teams retire the spreadsheet between $1M and $5M annual revenue.
Contribution margin is what is left after you subtract every variable cost a SKU incurs: COGS, fulfillment, storage, returns, ad spend allocated to that SKU, and refunds. Brands that switch to contribution margin as their primary KPI typically discontinue 10 to 20 percent of their catalog within the first quarter.
Daily at minimum for operational decisions. Hourly is the standard most enterprise-grade tools target in 2026. Anything slower than 24 hours means you are reacting to issues two days late.
It replaces the patchwork most sellers run today: Seller Central tabs for sales, a spreadsheet for COGS, an ad platform for spend, an accounting tool for settlements, and a separate dashboard for inventory. A single operating system unifies these into one source of truth.
Ready to Transform Your Amazon Business?
Join thousands of successful sellers who use Nova Analytics to make data-driven decisions and maximize their profits.