
Amazon Seller Analytics: The Complete 2026 Guide
Five types of analytics every Amazon seller needs, how to choose the right tools, and the mistakes that cost thousands in missed profit. A comprehensive guide for sellers at every stage.
Amazon seller analytics is the difference between guessing and growing. Whether you call it amazon selling analytics, amazon sale analytics, or simply tracking your numbers, the principle is the same: sellers who measure the right metrics at the right frequency consistently outperform those relying on Seller Central's built-in reports. This guide breaks down the five types of analytics every seller needs, how to choose the right tools, and the mistakes that cost thousands in missed profit.
Whether you're doing $30K or $30M per month, your analytics stack determines how fast you spot problems, how accurately you measure profitability, and how confidently you make decisions. At Nova Analytics, we've worked with hundreds of sellers across 21 marketplaces. Here's what the best ones get right.
TL;DR - Key Takeaways
- •Amazon seller analytics covers five categories: sales, profitability, PPC, product performance, and operational metrics.
- •True profitability requires tracking all 40+ Amazon fee types, not just revenue.
- •Hourly data refresh catches problems the same day. Daily or weekly batch reports cost you money.
- •The best analytics stacks are specialized, not all-in-one. Use dedicated tools for P&L, PPC, and research.
- •Most sellers discover 2 to 3 unprofitable SKUs within their first week of proper analytics setup.
P&L Accuracy
99.8%
All 40+ Amazon fee types tracked automatically
Data Refresh
Hourly
Catch problems the same day, not 48 hours later
Fee Types Tracked
40+
FBA fees, referral, storage, removals, and more
What Is Amazon Seller Analytics?
Amazon seller analytics is the practice of collecting, organizing, and interpreting your Amazon business data to make better decisions. It goes beyond raw numbers. True analytics connects your sales, advertising, fees, returns, and costs into a unified picture that reveals what's actually profitable and what's quietly draining margin.
There's an important distinction between analytics and reporting. Seller Central gives you reports: tables of data you can download and scroll through. Analytics adds context. It answers "why did profit drop 12% last Tuesday?" not just "revenue was $14,200 last Tuesday." The difference is actionable insight versus raw export.
Research from McKinsey found that companies using analytics to guide decisions are 23 times more likely to acquire customers and 6 times more likely to retain them [1]. For Amazon sellers, that translates directly to better product launches, smarter ad spend, and fewer costly surprises.
The 5 Types of Amazon Seller Analytics
Not all analytics serve the same purpose. The strongest Amazon businesses track five distinct categories. Each one answers different questions and requires different tools.
1. Sales Analytics
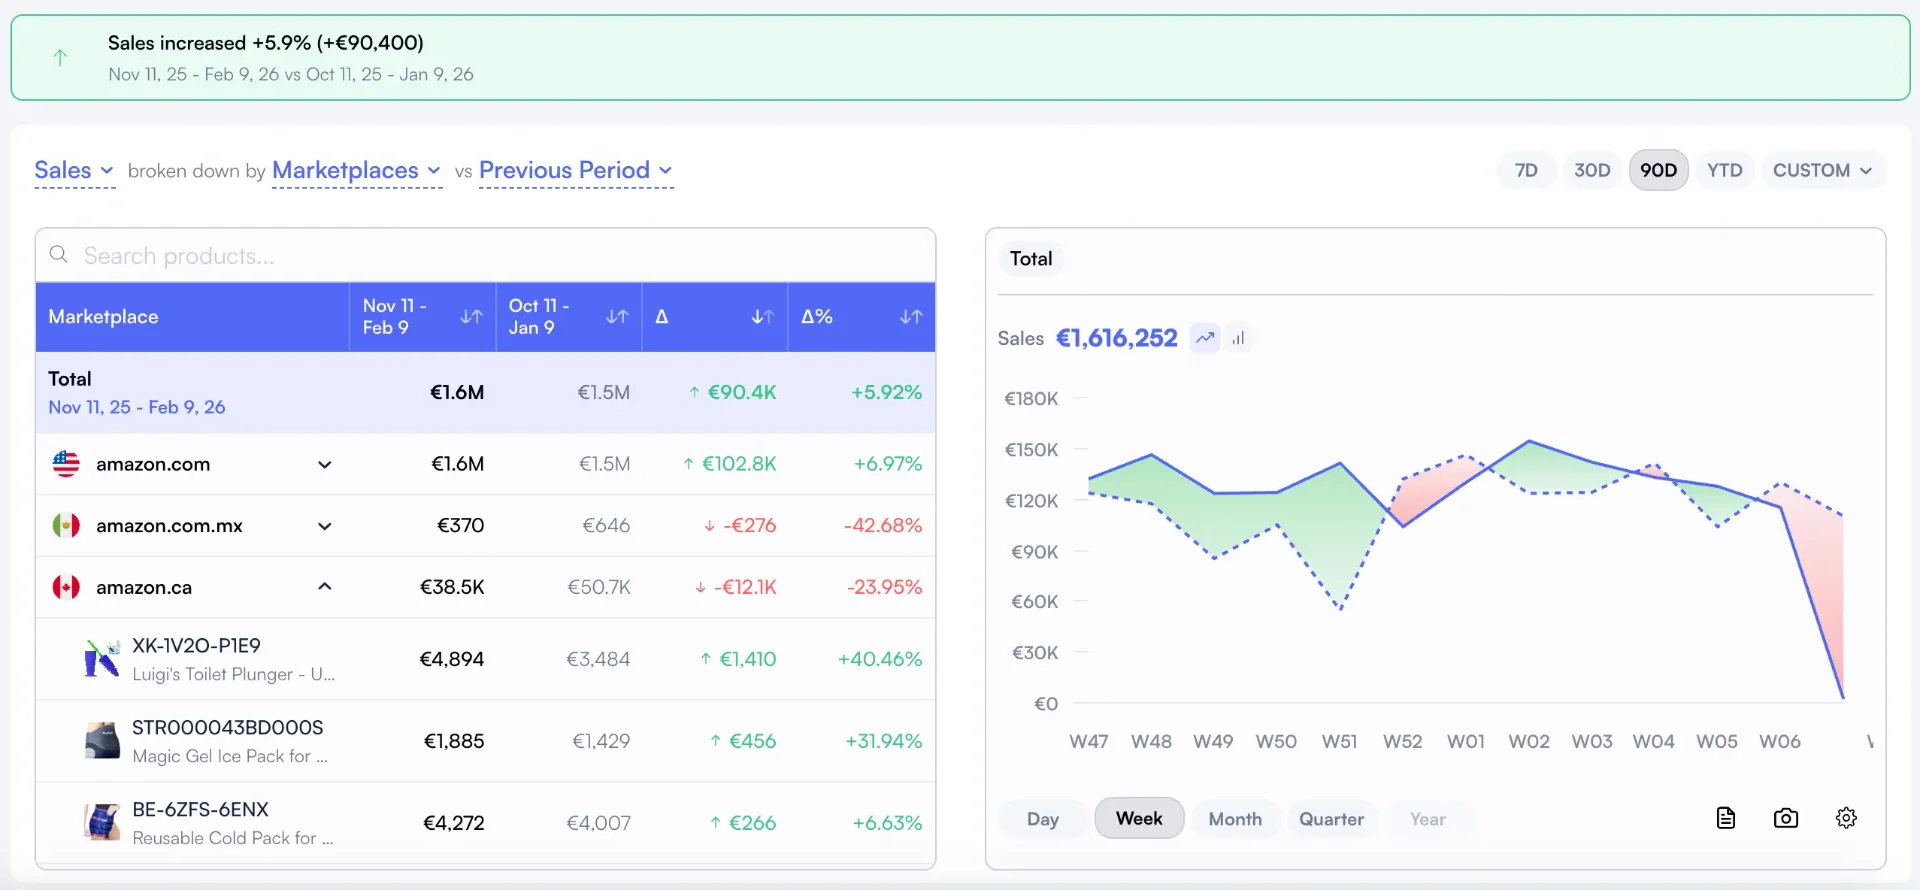
Sales analytics tracks revenue, units sold, and order trends over time. It's your business pulse. You need it to spot demand shifts, seasonal patterns, and the impact of pricing changes before they compound.
What to track: daily revenue by SKU, units sold by marketplace, average order value, and week-over-week growth rates. The sellers who catch a 15% revenue dip on Tuesday can fix it by Wednesday. Those checking monthly reports discover the problem three weeks too late.
A dedicated Amazon sales tracker gives you this visibility with hourly updates instead of Seller Central's 24 to 72 hour lag.
2. Profitability Analytics
Revenue means nothing without profit context. Profitability analytics calculates your true margin after every cost: COGS, FBA fees, referral fees, storage, returns, PPC spend, and promotional discounts. A product doing $50K per month in revenue might be losing money once you account for all 40+ fee types Amazon charges.
What to track: contribution margin by SKU (CM1 after COGS, CM2 after marketing, CM3 after all fees), fee breakdown per unit, and return cost impact. Amazon's FBA fee schedule changes multiple times per year [2]. If your analytics don't update automatically, your margin calculations drift.
Our FBA analytics platform handles this automatically with 99.8% accuracy across every fee type Amazon charges.
3. PPC and Advertising Analytics
Advertising analytics goes beyond ACoS. You need to understand how ad spend affects total business profitability, not just individual campaign performance. That's where TACoS (Total Advertising Cost of Sale) becomes essential. It measures ad spend against total revenue, including organic sales.
What to track: TACoS trends over time, ad spend as a percentage of total profit (not just revenue), campaign-level ROI, and the organic sales lift from advertising. A healthy TACoS is typically 10 to 15% for established products and 20 to 30% during launches.
Nova's PPC Analytics connect advertising data directly to profitability data, so you see the true ROI of every campaign.
4. Product Performance Analytics
Not every SKU deserves the same attention. Product performance analytics identifies your winners and losers so you can double down on what works and cut what doesn't. The Pareto principle applies: 20% of your catalog typically drives 80% of your profit.
What to track: profit per SKU ranking, velocity trends, return rate by product, and lifecycle stage (launch, growth, maturity, decline). Many sellers keep unprofitable products running for months because they never look at SKU-level contribution margin.
Nova's Winners and Losers analysis ranks every product by actual profit contribution, not just revenue.
5. Operational Analytics
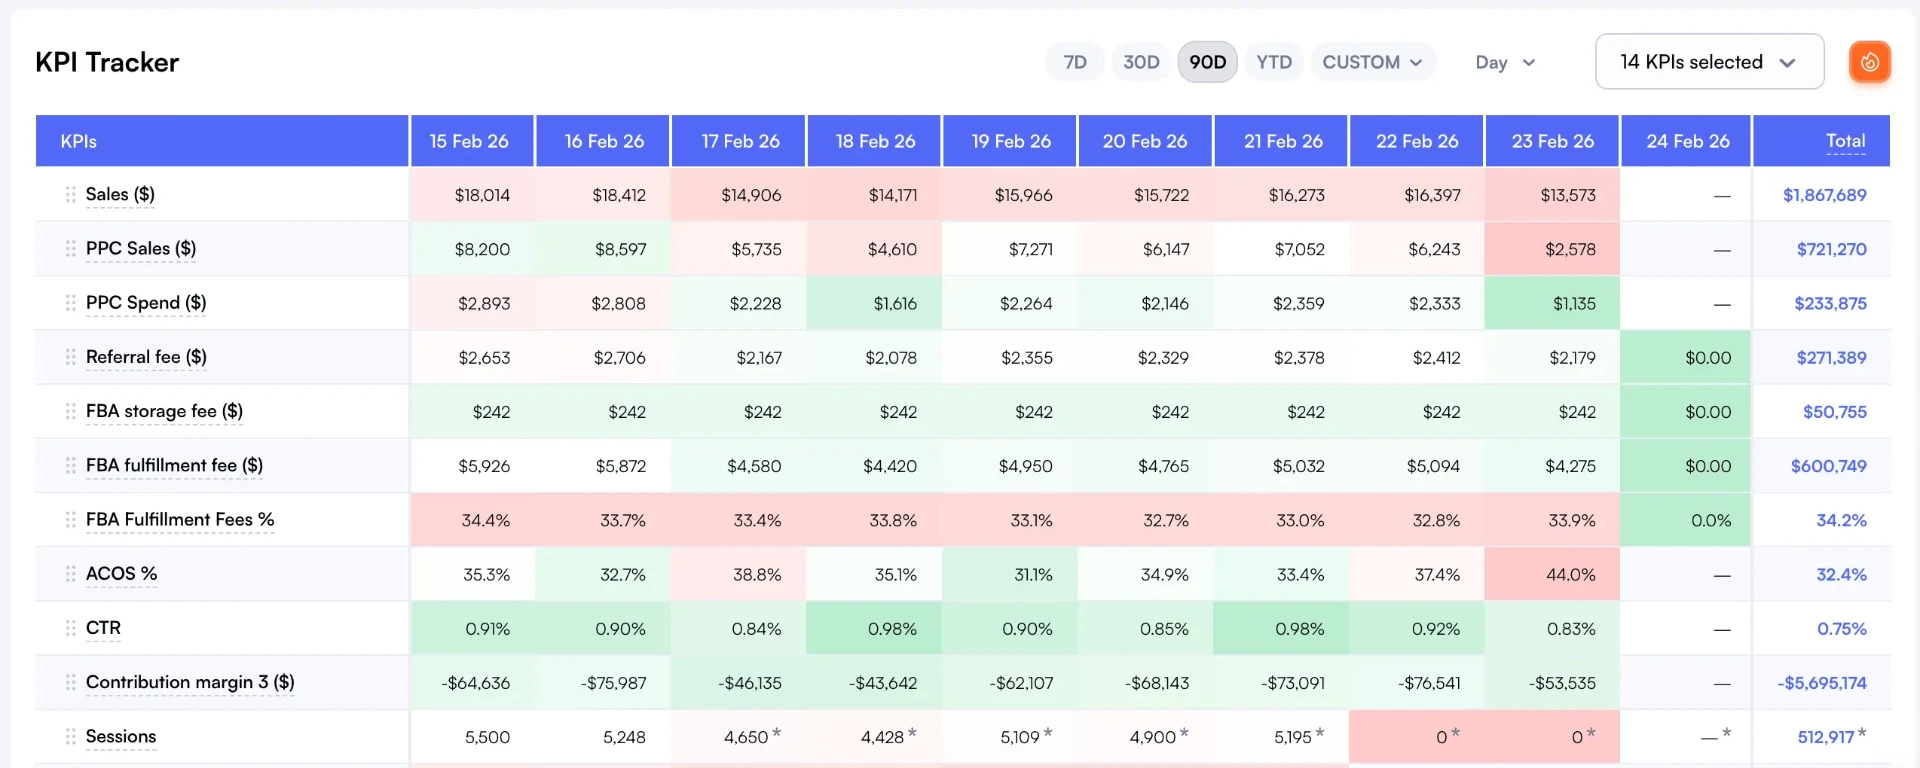
Operational analytics is your daily dashboard. It consolidates every metric that matters into a single view so you can run your business in 15 minutes instead of spending an hour bouncing between Seller Central tabs.
What to track: daily P&L summary, Buy Box percentage, account health indicators, inventory velocity, and session-to-conversion rates. The goal is a single screen that tells you "everything is fine" or "here's what needs attention today."
Nova's Day-to-Day Analytics gives you exactly this. One view, every metric, updated hourly.
Get More Amazon Seller Tips
Subscribe to our newsletter for weekly insights, strategies, and market updates.
How to Choose an Amazon Analytics Tool
There are dozens of Amazon analytics tools on the market. Most promise "complete visibility." Few deliver it. Here are the four criteria that actually matter when evaluating tools. For a detailed breakdown of specific platforms, see our comparison of the best Amazon analytics tools.
| Criteria | What to Look For | Red Flag |
|---|---|---|
| P&L Accuracy | 99%+ accuracy tracking all fee types | Tool only tracks 5 to 10 fee categories |
| Data Refresh Speed | Hourly or near real-time updates | Daily or weekly batch updates only |
| Fee Granularity | 40+ fee types broken down per unit | Lumps fees into "FBA Fees" bucket |
| Multi-Marketplace | Unified view across all regions | Separate login per marketplace |
| Custom Segmentation | Tag products by brand, category, supplier | Fixed categories only, no custom views |
Accuracy is non-negotiable. A tool that misses 5% of fees on a $500K annual business quietly costs you $25K in invisible margin errors. Look for platforms that explicitly list which fee types they track, and verify the numbers against your settlement reports for the first month.
Refresh speed determines how fast you can react. Research from Forrester shows that companies with real-time data access grow 30% faster than those relying on batch reports [3]. For Amazon sellers, hourly data means catching a Buy Box loss or ad spend spike the same day.
Setting Up Your Analytics Stack
Getting started with proper analytics doesn't take weeks. Here's the practical setup process most sellers follow.
Step 1: Connect Your Amazon Account
Every analytics tool connects through Amazon's SP-API (Selling Partner API). You'll authorize read-only access. This takes about 5 minutes. The tool can pull your data without any risk to your account since it's read-only access.
Step 2: Configure Your Cost Inputs
The tool handles Amazon fees automatically. You need to add your COGS (cost of goods sold) per SKU to get accurate profit calculations. Some sellers also add shipping costs, custom duties, and overhead allocations. The more cost data you input, the more accurate your margins become.
Step 3: Set Up Your Dashboard Views
A good seller dashboard lets you create custom views for different purposes: a daily operations view, a weekly P&L review, and a monthly strategy dashboard. Use custom analytics to segment by brand, marketplace, or product category.
Step 4: Review Your First Insights
Within 24 hours of connecting, you'll have enough data to identify your top and bottom performing products by actual profit (not revenue). Most sellers discover at least 2 to 3 SKUs that are unprofitable once all fees are accounted for. That discovery alone typically covers the cost of the tool.
Common Analytics Mistakes (And How to Avoid Them)
After working with hundreds of FBA sellers, we see the same mistakes repeatedly. Here are the five most costly.
Mistake 1: Tracking Revenue Without Profit
Revenue is vanity. Profit is sanity. A product generating $20K per month in revenue might contribute $800 in profit or negative $200 once you account for returns, storage fees, and PPC. Without SKU-level profit and loss tracking, you're flying blind. Fix: set up contribution margin tracking (CM1, CM2, CM3) for every active SKU.
Mistake 2: Ignoring Return Rate Impact on Margins
Returns cost 3 to 5% of gross revenue for most sellers. But the impact isn't distributed evenly. Usually, 20% of your catalog drives 80% of return costs. A product with a 15% return rate might look profitable at the revenue level but become a loss leader once you factor in return shipping, restocking fees, and unsellable units.
Mistake 3: Not Segmenting by Marketplace
A product profitable in the US might be losing money in Germany due to higher FBA fees, VAT, and lower ASP. Blended P&L hides these differences. Fix: use a dashboard that shows profitability per marketplace so you can make market-specific pricing and advertising decisions.
Mistake 4: Relying on Weekly or Monthly Data
If your analytics update daily or weekly, you're making decisions on stale data. A PPC campaign that started overspending on Monday shouldn't wait until Friday's report to get paused. Hourly data refresh is the minimum standard for sellers doing $100K or more per month.
Mistake 5: Using One Tool for Everything
All-in-one tools do many things adequately but few things well. The most successful sellers build specialized stacks: a dedicated profit tracker, a focused PPC optimizer, and a separate research tool. Each does its job at a higher level than any single platform could. See our analytics tool comparison for stack recommendations, or explore Nova's analytics software to see how a specialized P&L and daily analytics platform works in practice.
Sources and References
- McKinsey & Company, "The Big Reset: Data-Driven Marketing in the Next Normal", Research on how data-driven organizations outperform peers in customer acquisition and retention.
- Amazon Seller Central, "FBA Fees", Official FBA fee schedule covering fulfillment, referral, storage, and specialty fees.
- Forrester Research, "Insight-Driven Businesses Set the Pace for Global Growth", Study on the revenue growth advantage of real-time data access.
Frequently Asked Questions
Frequently Asked Questions
Find answers to common questions about our platform
Ready to Transform Your Amazon Business?
Join thousands of successful sellers who use Nova Analytics to make data-driven decisions and maximize their profits.
Continue Learning
Explore more expert insights to grow your Amazon business
Amazon Sales Analytics
Revenue is vanity, profit is sanity. Amazon sales analytics connects your top-line numbers to actual profitability. Learn the 5 metrics that matter, why Seller Central falls short, and how to build a sales analytics stack that catches problems the same day.
Amazon BSR Guide 2026: Track Best Sellers Rank by ASIN
Your internal sales metrics only tell half the story. BSR reveals how you perform against the entire marketplace. Learn how to find, track, and estimate sales from Best Sellers Rank.
Best HelloProfit Alternative 2026 - Hourly Profit Analytics
HelloProfit updates daily. Nova refreshes hourly. Get same-day visibility into profit changes, faster problem detection, and real-time analytics for Amazon sellers. From $29/mo, 21 marketplaces.