

 MCP
MCPFree for lifeClaim your lifetime free access to Nova MCP for Claude before 07/31!
Know your Prime Day profit, down to the cent, per SKU
Nova tracks net profit on every Amazon order across your full portfolio. 40+ fee types mapped, ad spend included, year-over-year compare built in. Run the Prime Day recap once, ship the deck the same day.
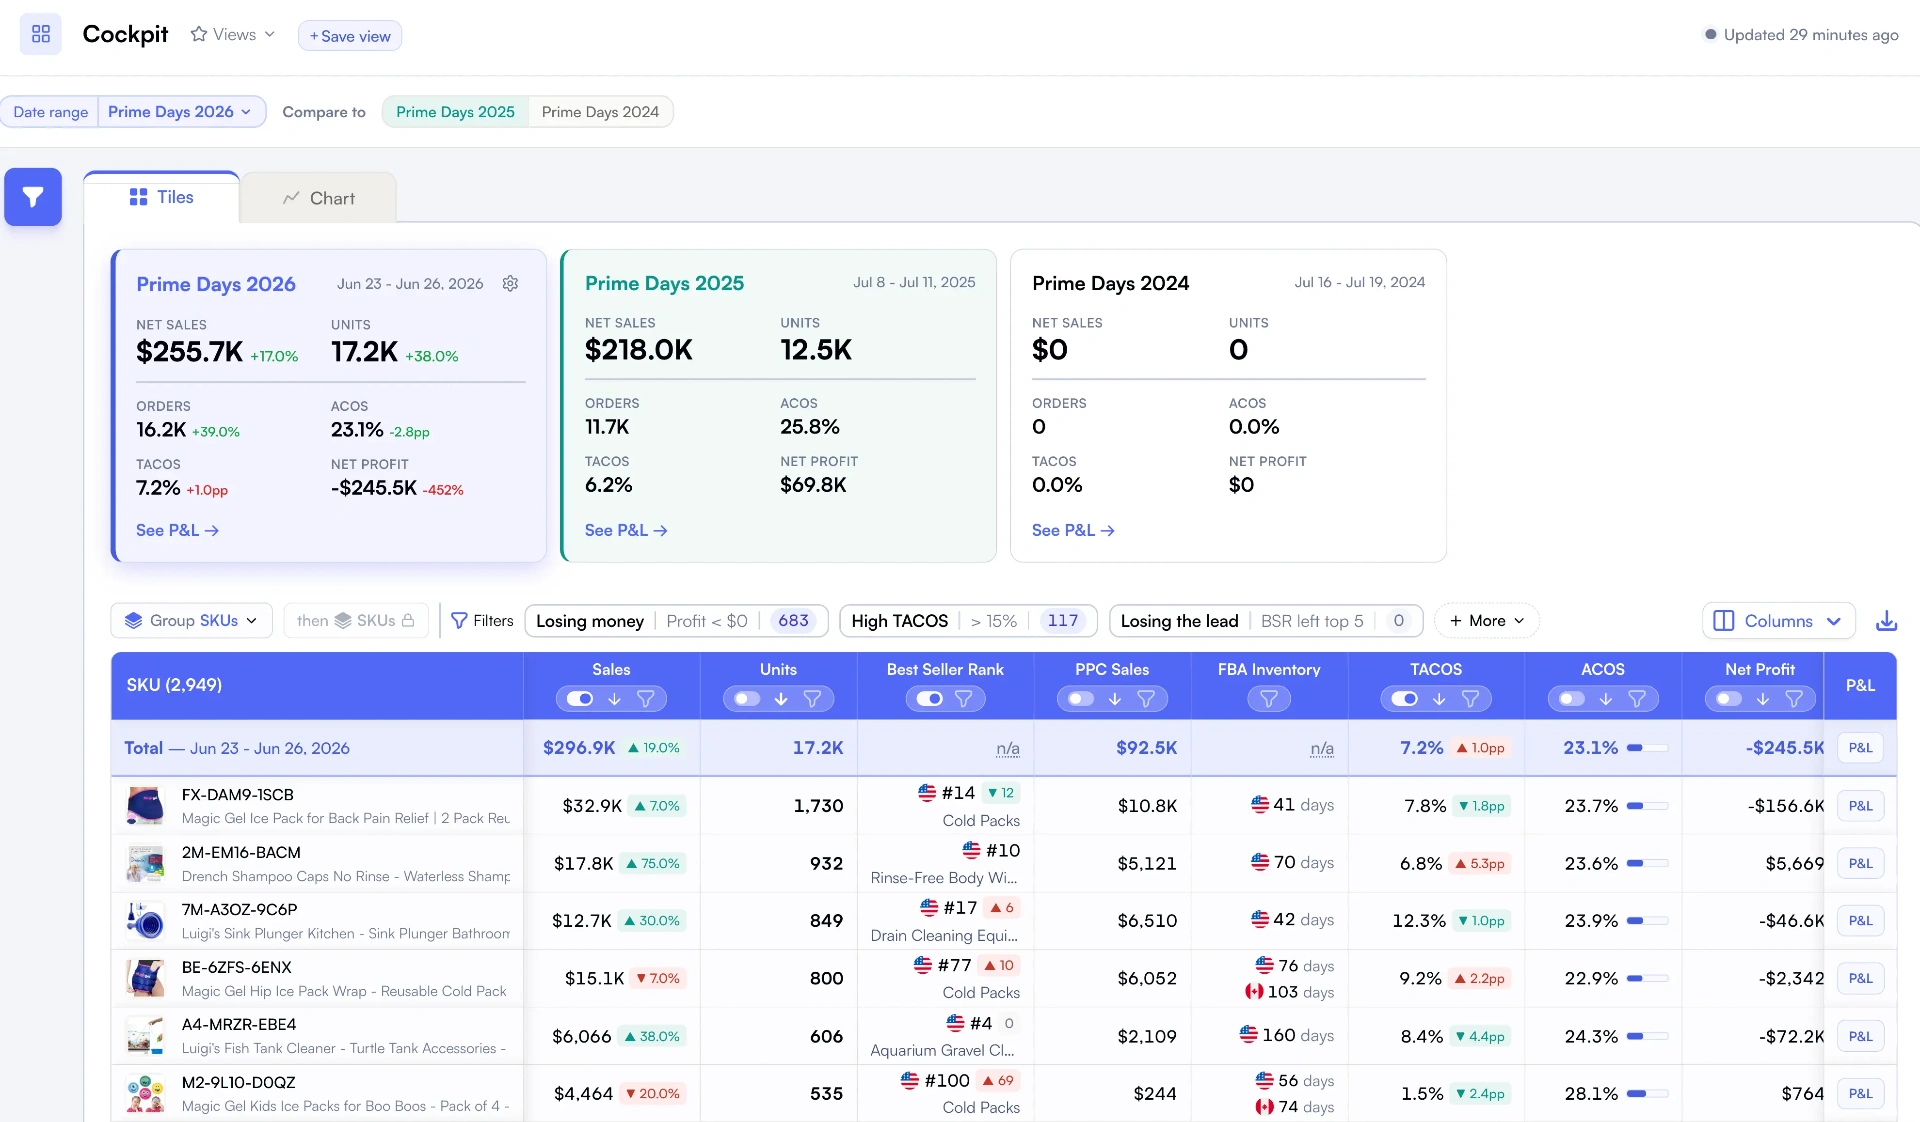
Net sales lied to you. Prime Day profit tells the truth.
Three things kill most Prime Day recaps in Sheets.
Top-line up, margin down
Deal fees, coupons and ad spend can flip a winner into a loss. You need profit per SKU, not net sales.
Portfolio averages hide the losers
Totals smooth over the SKUs that bled. The per-ASIN profit table is the only honest recap.
Year-over-year is a mess in Sheets
Prime Day windows shift. Nova aligns them automatically so the compare is clean.
The 6 questions every Prime Day debrief must answer
Walk through them once in Nova and your Prime Day profit recap deck writes itself.
Which SKUs made money, which sold at a loss?
What did each event truly cost, fees + ads + coupons?
Did TACoS get worse on your top promoted ASINs?
Did Prime Day beat last year on profit, not just sales?
Which SKUs ran out before the event ended?
Did the event cannibalize the surrounding 4 weeks?
The most powerful profit cockpit on Amazon, pointed at Prime Day
Per-SKU net profit, daily pacing and inventory burn, all on the same window.
Per-SKU net profit with 40+ Amazon fee types mapped per order. Deal fees, coupons, PPC, FBA, referral, all in. The cleanest profit number on Amazon.
Explore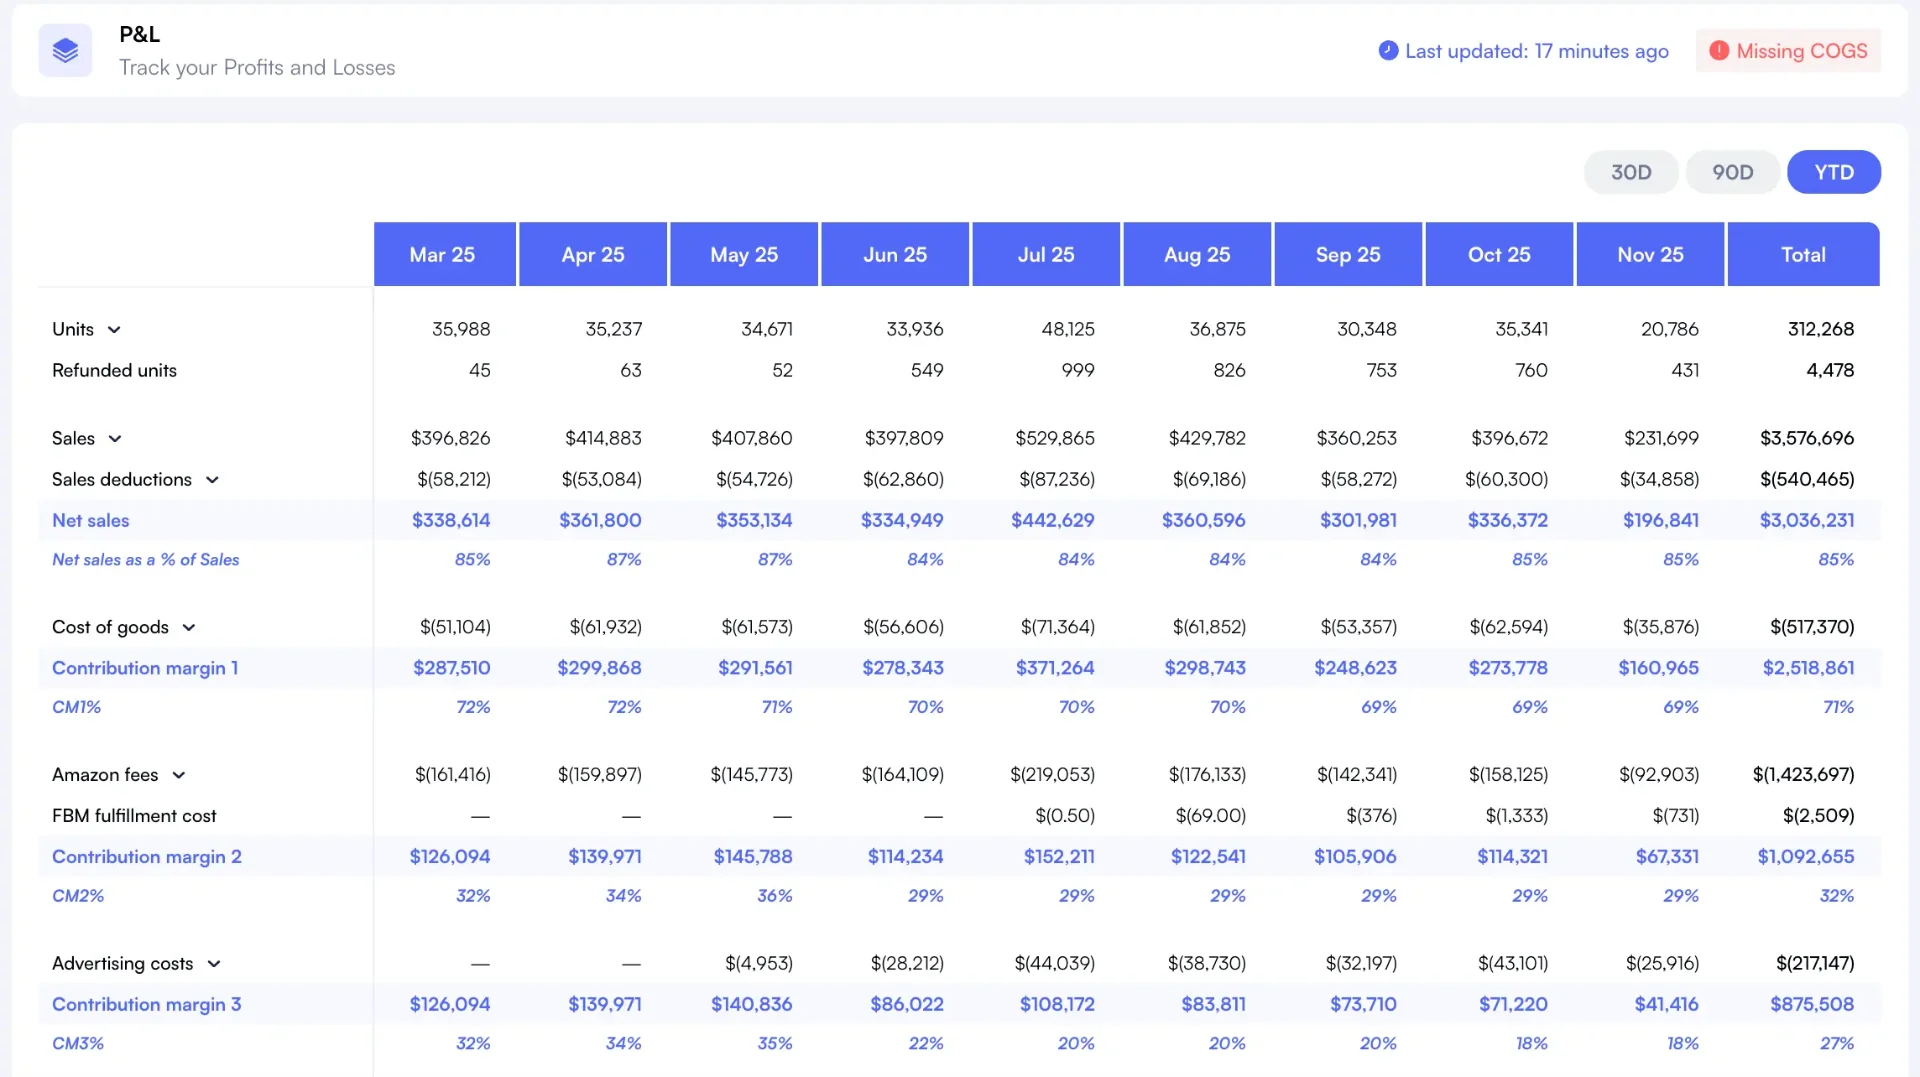
Sales, ads, units and profit, day by day across the event window. Spot exactly which day broke the recap and which SKUs carried it.
Explore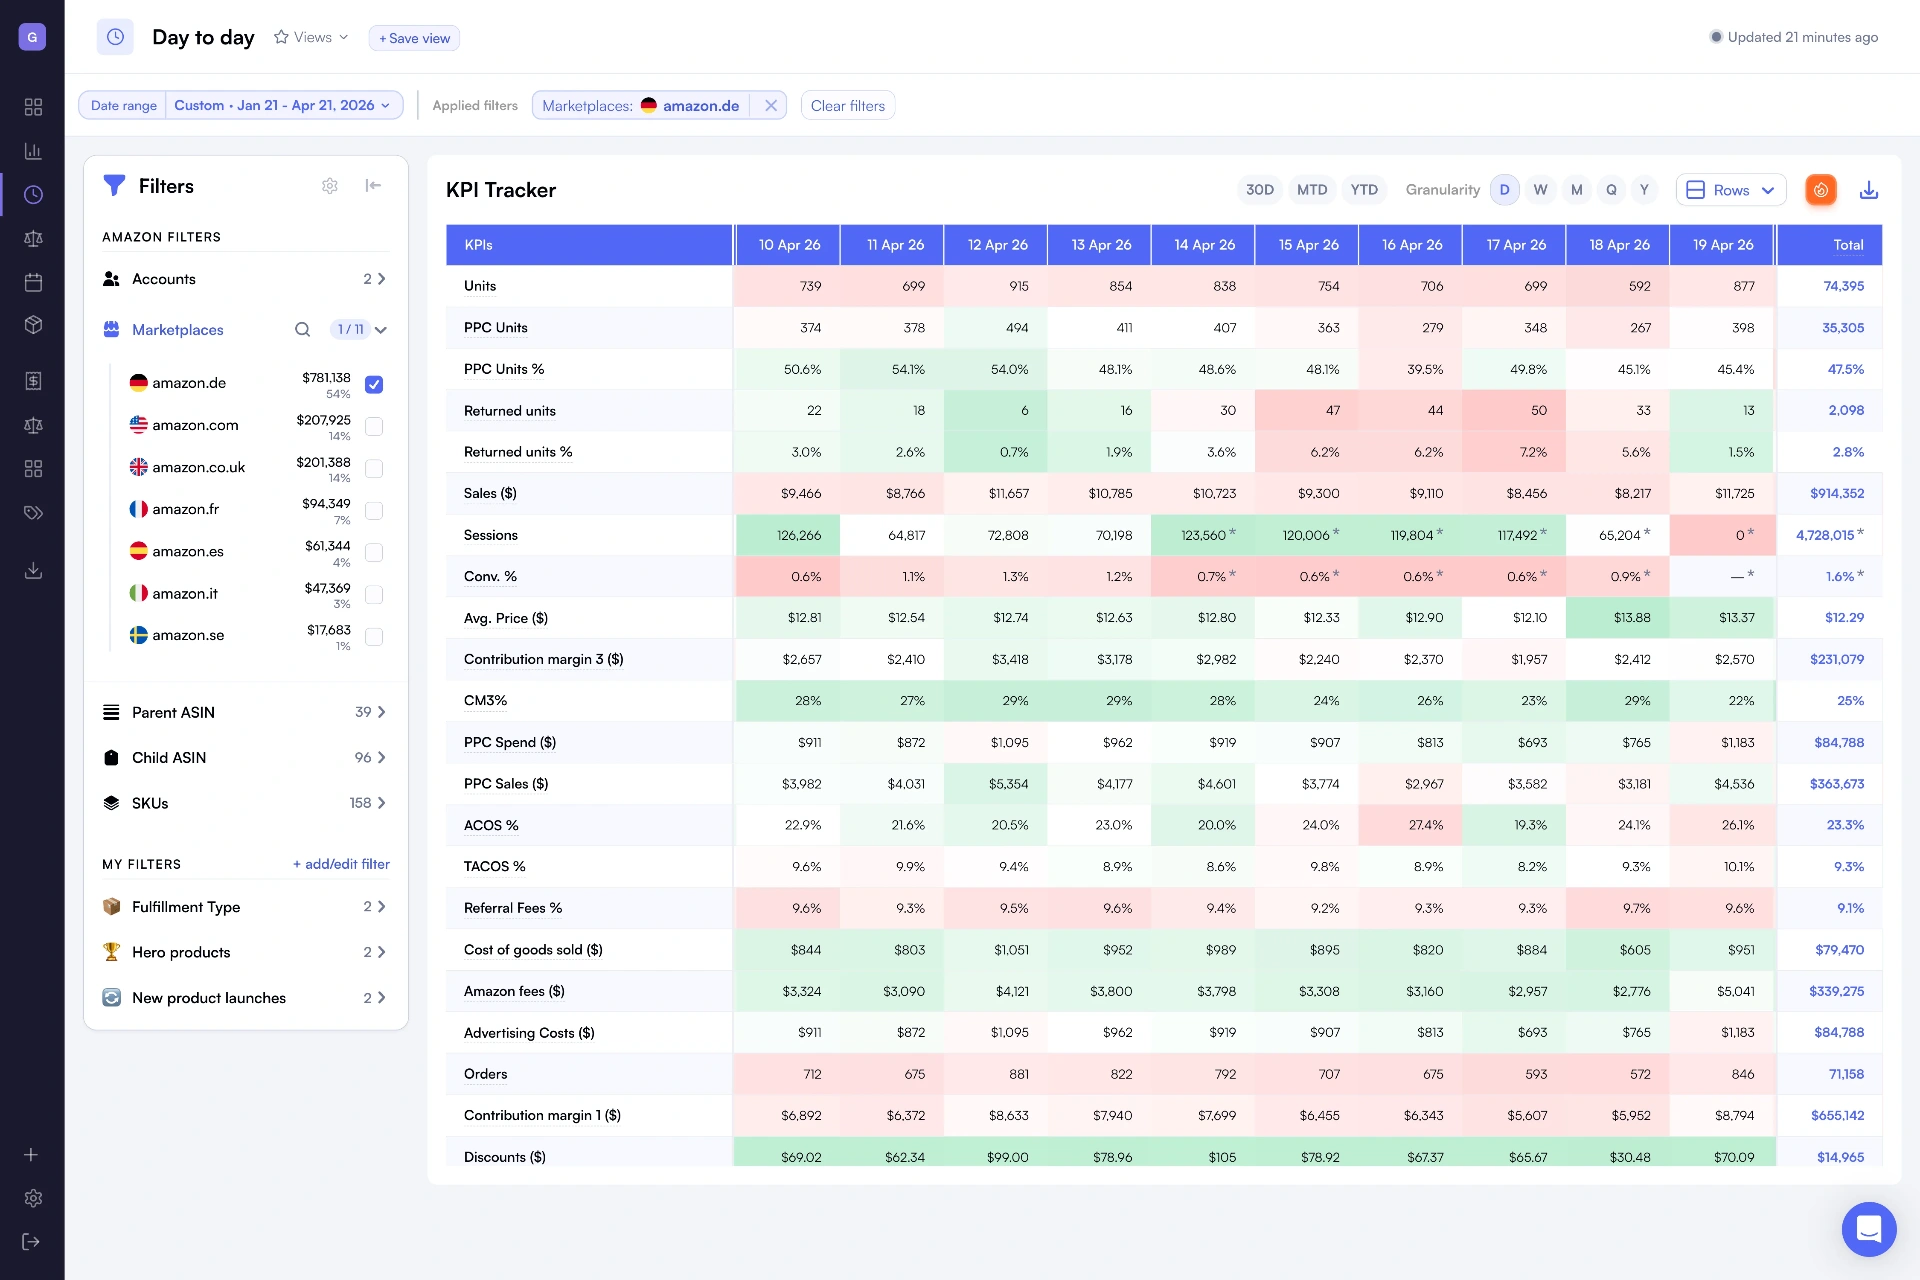
Days of cover tied to actual Prime Day velocity, not a flat average. Spot the SKUs that ran dry and the ones that sat through the event.
Explore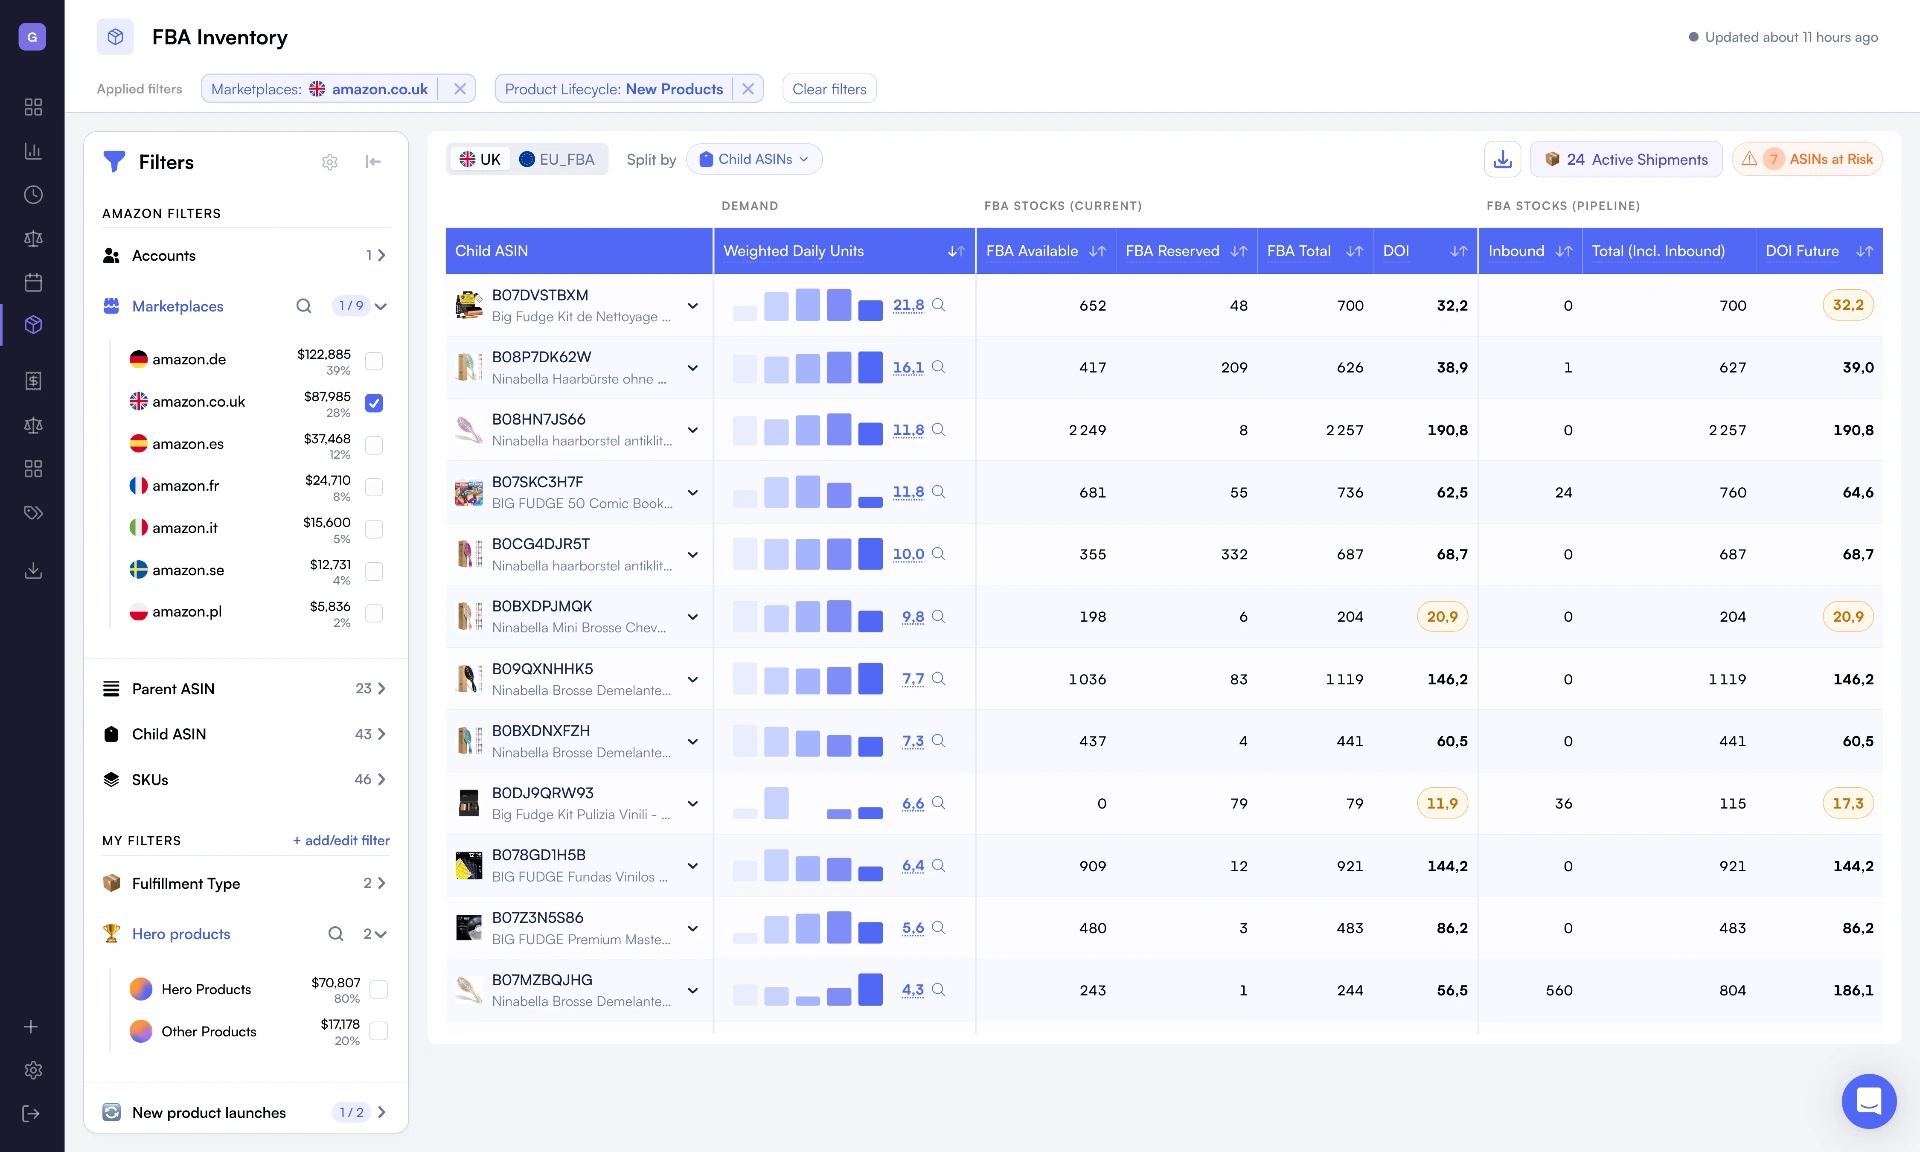
$0.01
Profit precision
Per-SKU net profit, every order
40+
Fee types
Deal fees, coupons, PPC, FBA, referral
21
Marketplaces
One recap across every Amazon region
YoY
Auto-aligned
2026 vs 2025 vs 2024 in one click
How it works
From Seller Central connect to a finished Prime Day recap in under 10 minutes.
Connect Seller Central + Ads
Link your account through Amazon SP-API and Ads API in under 5 minutes. Nova pulls historical Prime Day windows back to 2024 automatically.
Compare years in one click
Pick the year. Nova aligns the windows so the compare is clean. No date math.
Drill from total to SKU
Read the profit tile first. Drill into the SKU table to find the winners that paid for the event and the losers that didn't.
Simple, transparent pricing
Start free. Scale when you're ready.
14-day free trial • No credit card required • Cancel anytime
- Profit & loss analytics
- PPC Analytics
- Custom breakdowns
- Buy Box %
- BSR Tracker
- Returns Analytics
- Consolidated Data Exports
- Priority support
Unlimited accounts. Dedicated support.
- Unlimited orders
- Unlimited accounts
- Unlimited team seats
- Advanced User Management System
- Client-first view
- Dedicated account manager
- Custom data exports
- SLA guarantees
Frequently Asked Questions
Find answers to common questions about our platform
Keep reading on Prime Day
The playbook, the records, and the basket-size story behind Prime Day 2026.
Related solutions
Explore other tools that complement your Amazon selling strategy
Amazon Profit Tracker
Track profit trends over time across your entire portfolio
Amazon PPC Analytics Tool
Analyze PPC spend, ACoS, and advertising ROI at the product level
Amazon Sales Tracker
Track daily, weekly, and monthly sales across all marketplaces
Product Performance Tracker
Track every product's sales, margins, and ranking over time
Trusted by Amazon sellers and agencies running 8 and 9-figure catalogs across 21 marketplaces.
See your Prime Day profit, to the cent, in 5 minutes
14-day free trial. No card. Connect Seller Central and Nova rebuilds your last Prime Day in minutes.