
Amazon Profit Dashboard Setup
Most sellers wait until they're losing money before tracking profits. This guide walks through setting up a profit dashboard in 30 minutes, what data you need, and the three insights you'll discover in week one.
Most Amazon sellers wait until they're losing money before they start tracking profits. By then, it's damage control. The best time to set up profit tracking was when you launched. The second best time is right now.
Amazon added over a million new sellers in 2024 alone. Yet fewer than 30% of sellers accurately track their true profitability at the product level. The rest operate on gut feeling and Seller Central's revenue numbers, missing the hidden fees, returns, and ad costs that quietly drain their margins.
This guide walks you through setting up a profit dashboard in 30 minutes or less. You'll learn what data you need before starting, how to configure your first dashboard, and the three insights you'll discover in your first week that most sellers never find.
Setup Time
30 min
From zero to actionable insights
Sellers Missing True Profit Data
70%+
Rely on revenue, not profit tracking
Average Hidden Fee Impact
3-8%
Of gross revenue lost to untracked costs
Why most sellers wait too long to track profits
It's not laziness. It's the illusion that Seller Central tells the whole story. Your dashboard shows $50K in revenue this month. That feels like progress. But revenue is vanity. Profit is sanity.
Here's what Seller Central doesn't show you at a glance: the $2,400 in long-term storage fees hitting next month, the $1,800 in returns that haven't processed yet, the $3,200 in ad spend that generated sales but killed your margins on three products. You see $50K revenue. Your bank account sees something very different.
The Hidden Cost of Flying Blind
Research on customer profitability found that 20-30% of customers (or in our case, products) are unprofitable. Without product-level profit tracking, you can't identify which 20-30% of your SKUs are actually losing money.
The sellers who scale past $1M annually share one habit: they know their numbers at the product level, updated daily. They catch margin compression before it becomes a crisis. They reallocate ad spend from losers to winners while competitors are still guessing.
The good news? Setting up proper profit tracking takes less time than you'd spend on one product listing. Let's get started.
What you need before you start
Your profit dashboard is only as accurate as the data feeding it. Before connecting any tools, gather these three essential inputs. Missing any of them means your profit numbers will be wrong from day one.
1. COGS data for every SKU
Cost of Goods Sold is your landed cost per unit. This includes product cost, shipping to Amazon, prep fees, and any other per-unit expenses before FBA takes over.
Common mistake: using manufacturer price instead of landed cost. If you pay $5 for a product but $2 in shipping and $0.50 in prep, your COGS is $7.50, not $5. This mistake alone can inflate your profit estimates by 30-50%. Learn the details in our COGS tracking guide.
2. Amazon marketplace connections
You need API access to pull sales, fees, returns, and advertising data automatically. Manual exports work for spot checks, but they're unsustainable for daily tracking.
What you'll connect: Seller Central (sales, fees, FBA costs) and Amazon Advertising (PPC spend by product). If you sell on multiple marketplaces (US, UK, EU), you'll need connections to each.
3. Your margin targets
Before you see your actual numbers, decide what "good" looks like for your business. This prevents emotional reactions when you discover some products are underwater.
Benchmarks to set: Minimum acceptable net margin (typically 15-20% for FBA), target TACoS ceiling (10-15% for established products), and maximum ad spend per SKU before review. See our FBA profit margins guide for category-specific benchmarks.
Pro Tip: Start with 80% accuracy
Don't let perfect COGS data delay your setup. Start with your best estimates, then refine over the first month as you compare dashboard numbers to actual settlements. An 80% accurate dashboard today beats a 100% accurate dashboard you never build.
What a profit dashboard looks like
Before diving into setup steps, here's what you're building toward. A proper profit dashboard shows revenue, costs, fees, and true profit at a glance, with the ability to drill down to individual products.
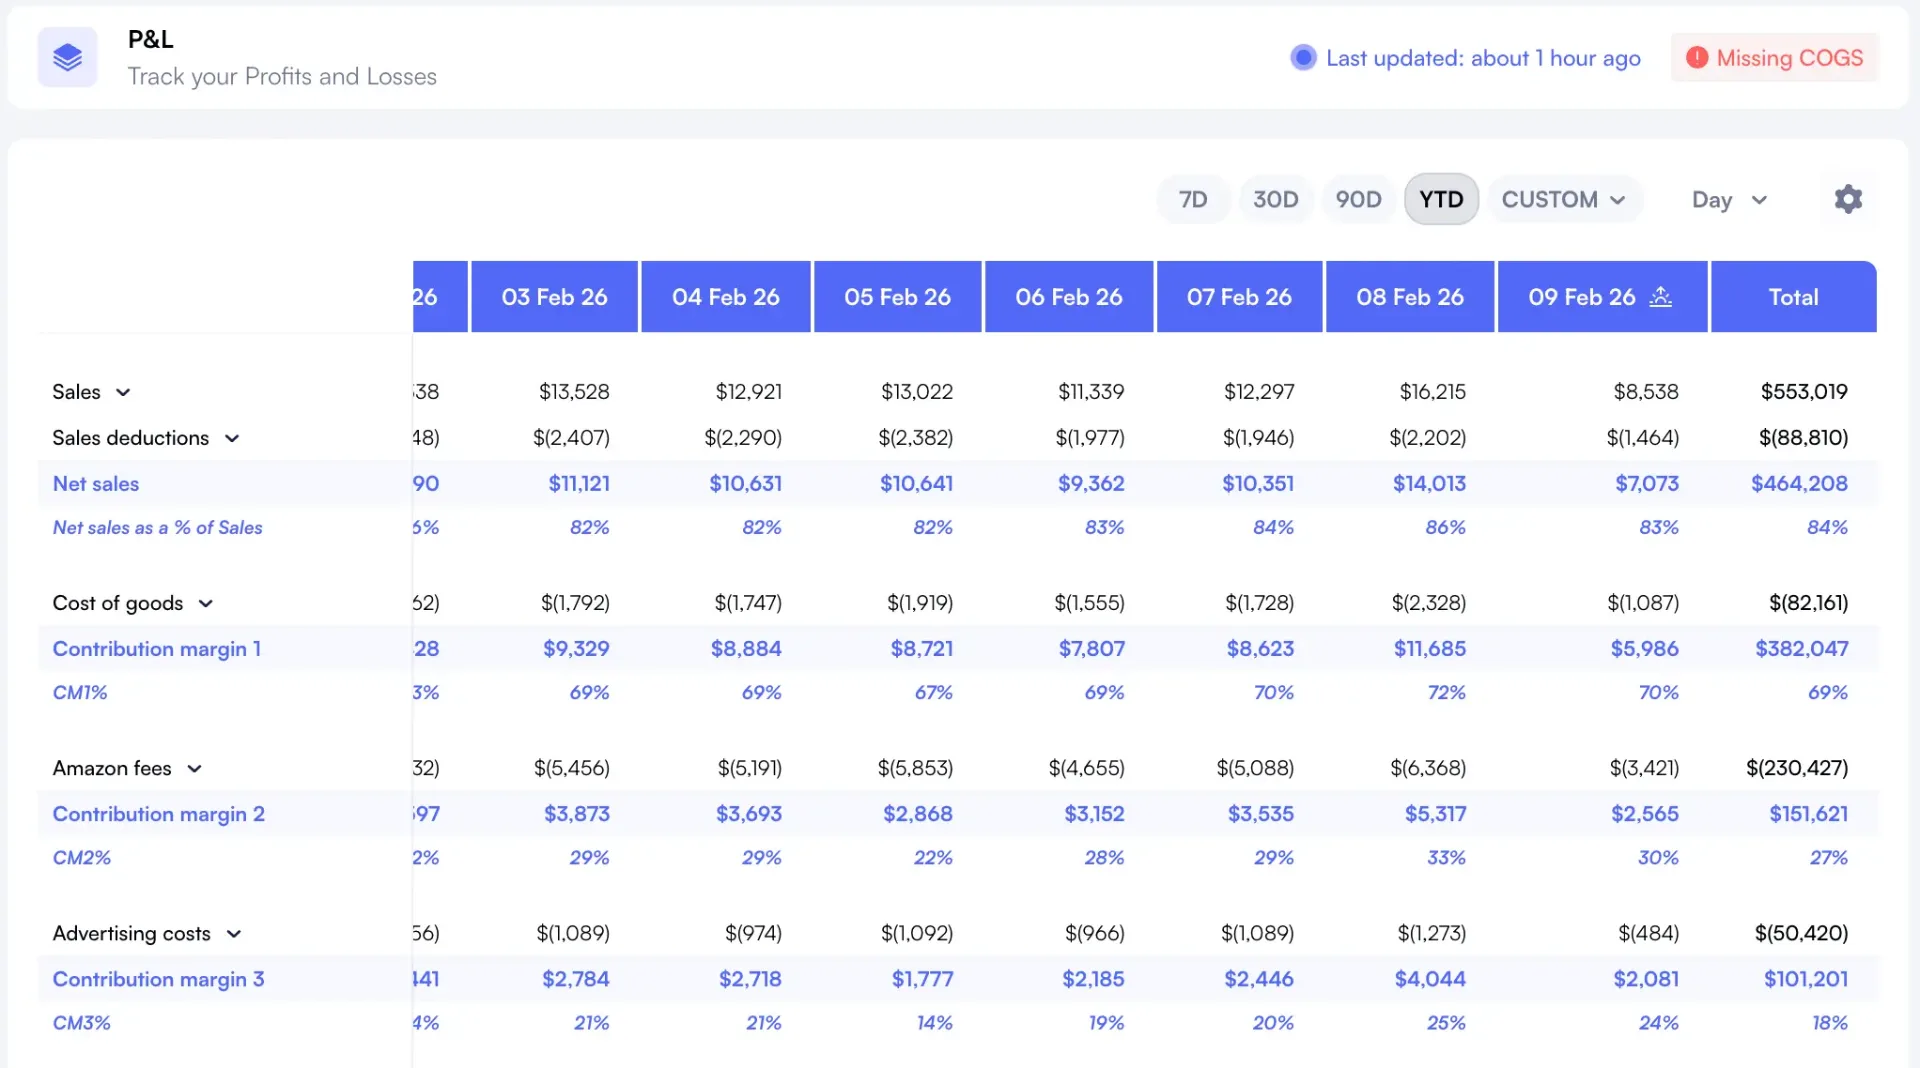
Nova's P&L Dashboard Displays all key profitability metrics in one view, updated hourly with data from Seller Central and Amazon Advertising.
Step-by-step setup walkthrough
Here's how to go from zero to a functioning profit dashboard in about 30 minutes. We'll use Nova's P&L Dashboard as the example, but the principles apply to any profit tracking solution.
1Connect your Amazon account (5 minutes)
Authorize API access to Seller Central. This pulls your sales, orders, fees, and FBA data automatically. You'll need your Seller Central login and may need to approve the connection in your Account Settings.
What happens: the system imports your historical data (typically 12-24 months) and begins syncing new data hourly. Within 15 minutes, you'll see your sales history populated.
2Connect advertising data (3 minutes)
Link your Amazon Advertising account to pull PPC spend, impressions, clicks, and attributed sales. This is separate from Seller Central because Amazon separates these platforms.
Why it matters: without ad data, you can't calculate true product profitability. A product showing 25% margin might actually be losing money once you factor in the $500/month you're spending on ads to sell it.
3Upload your COGS data (10-15 minutes)
This is the step that separates accurate profit tracking from guessing. You'll either upload a CSV with SKU-level costs or enter them manually for smaller catalogs.
| Catalog Size | Best Approach | Time Required |
|---|---|---|
| Under 50 SKUs | Manual entry in dashboard | 10-15 minutes |
| 50-500 SKUs | CSV upload with SKU, COGS columns | 15-20 minutes (prep + upload) |
| 500+ SKUs | Bulk CSV or ERP integration | 30-60 minutes (one-time) |
Tip: for products with variable COGS (seasonal pricing, multiple suppliers), use your average cost from the last 90 days. Update quarterly or when costs shift by more than 10%.
4Configure your dashboard view (5 minutes)
Set your default date range (last 30 days is standard), currency, and timezone. Then customize which metrics appear on your main dashboard versus detail views.
Recommended setup: Main dashboard shows revenue, net profit, profit margin %, TACoS, and units sold. Product-level view adds per-unit profit, return rate, and ad spend breakdown. Use Nova's Custom Analytics to build views specific to your business model.
5Verify against a known period (2-5 minutes)
Before trusting your new dashboard, cross-check one month against your Seller Central settlement report. Revenue should match within 1-2%. If there's a larger gap, investigate before proceeding.
Common causes of discrepancy: Missing marketplace connections, pending transactions not yet settled, or time zone differences affecting which orders fall into which month. See our data accuracy guide for troubleshooting.
Setup Complete Checklist
- ✓ Seller Central connected and syncing
- ✓ Advertising account linked
- ✓ COGS data uploaded for all active SKUs
- ✓ Dashboard configured with preferred metrics
- ✓ Verified against settlement report
First 7 days: what to expect from your data
Your first week with a profit dashboard will be eye-opening. Some of what you discover will be uncomfortable. That's the point. Here's what typically happens and how to interpret it.
Days 1-2: The reality check
You'll see your actual profit margin for the first time. For most sellers, it's lower than expected. Revenue minus Amazon's visible fees doesn't account for advertising, returns, storage fees, and the dozen other line items eating your margins.
What to do: Don't panic. This is baseline data. Your goal now is improvement, not perfection. Note your overall margin and identify your top 3 and bottom 3 products by profitability.
Days 3-4: Pattern recognition
After the initial shock, start looking for patterns. Which product categories have the best margins? Are your newer products more or less profitable than established ones? Is there a correlation between ad spend and profitability?
What to do: Use Nova's Winners & Losers view to segment products by performance. Tag products that need investigation versus those performing well.
Days 5-7: First optimization decisions
By the end of week one, you should have enough data confidence to make your first data-driven decisions. Start small. Pause ads on one unprofitable product. Increase investment in one high-margin winner.
What to do: make one decision per day based on dashboard insights. Document the decision and expected outcome. Review results in week two to calibrate your judgment.
Pro Tip: Trust the trend, not the snapshot
Individual day data can be noisy. Don't make major decisions based on a single day's numbers. Wait for 7-day trends to stabilize before taking action. The Day-to-Day Performance dashboard shows both daily snapshots and rolling trends to help distinguish signal from noise.
Managing your product portfolio
Once you have profit visibility, you need a way to act on it. A good analytics platform lets you see all your products with their key metrics, filter by performance, and quickly identify which SKUs need attention.
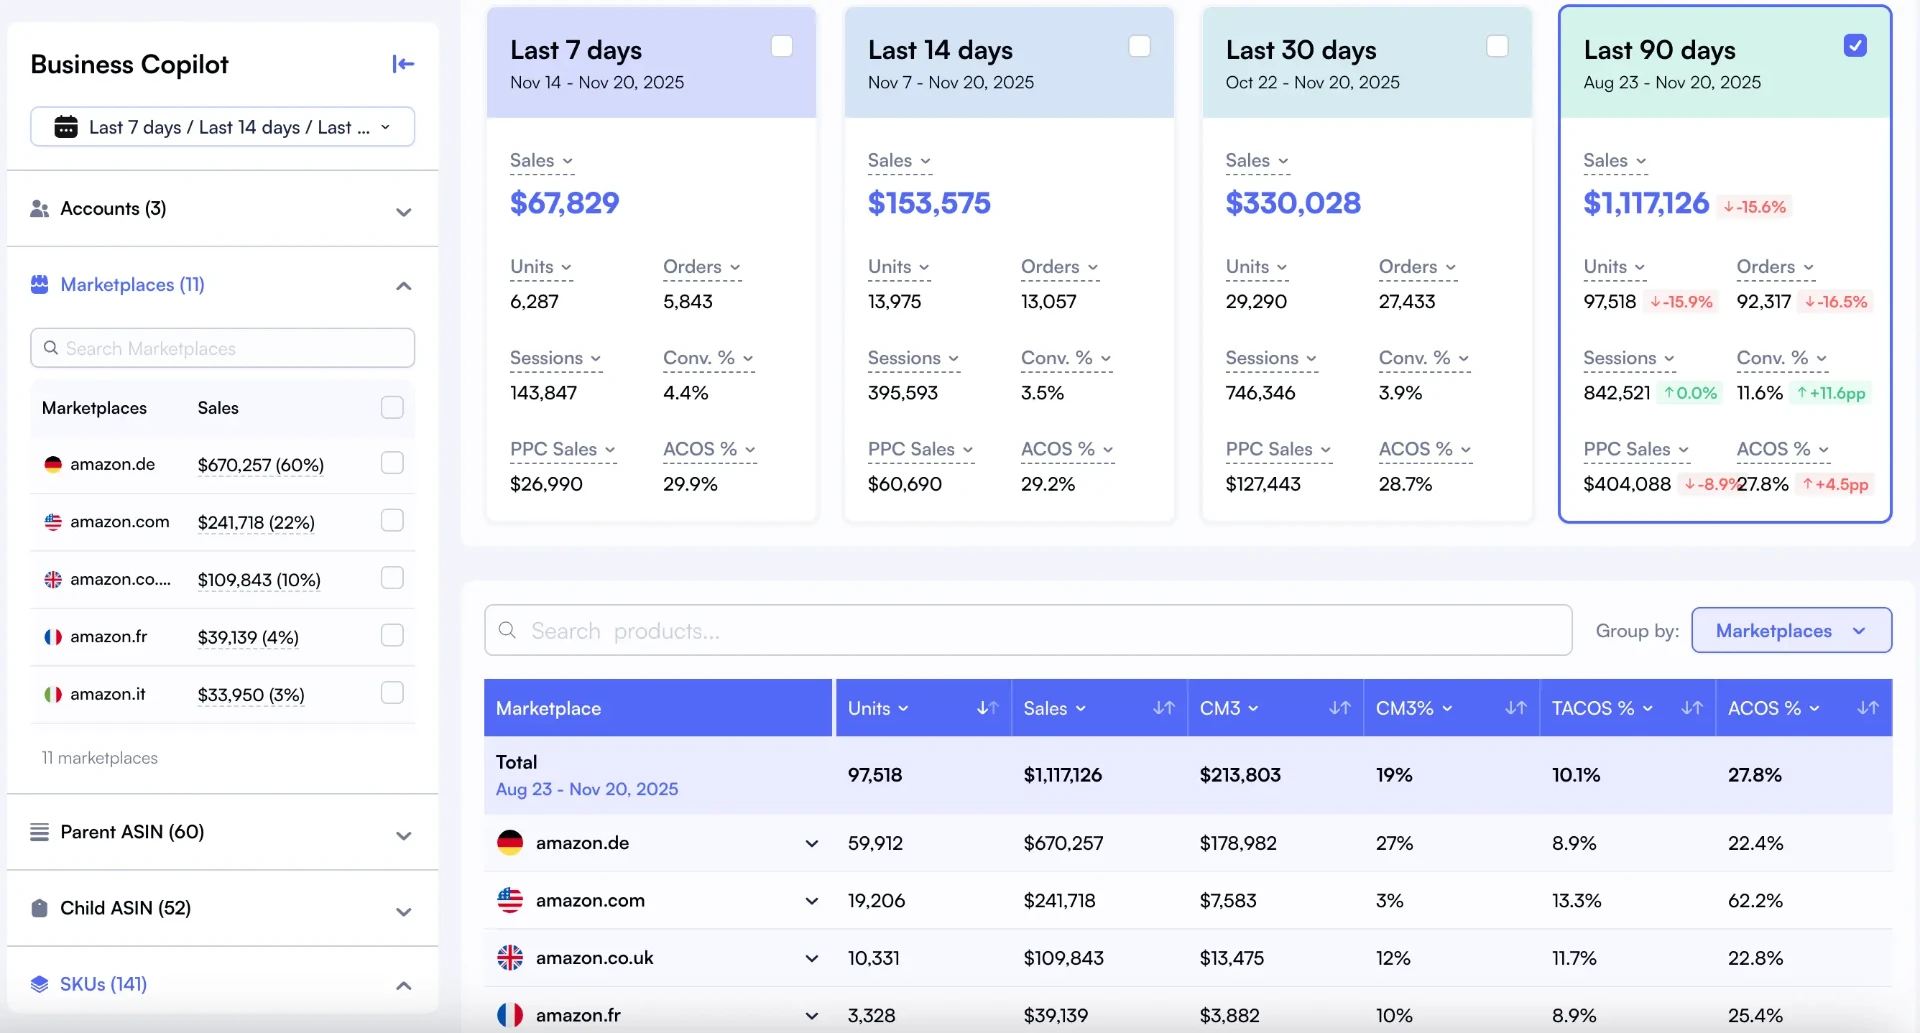
The Seller Cockpit provides a unified view of all products with profit metrics, making it easy to spot underperformers and prioritize optimization efforts.
3 quick wins you'll find in week one
Nearly every seller who sets up proper profit tracking discovers these three insights within their first week. Each represents an immediate opportunity to improve profitability.
1. The zombie SKUs draining your profits
Every catalog has them. Products that sell just often enough to feel active, but not profitably. They might show 5 units/month at $15 margin, but they're consuming $80/month in storage fees and $50 in ads. You're losing $115/month on each one.
The fix: Identify all products with negative contribution margin (revenue minus all costs including ads). Either fix them (raise price, cut ads, remove FBA) or liquidate them. Our SKU rationalization guide Walks through the decision framework.
2. Ad spend misallocation
When you see profit by product alongside ad spend, a pattern emerges: you're probably over-investing in products with low margins and under-investing in high-margin products. This happens because PPC optimization typically focuses on ACoS, not profit contribution.
The fix: Sort products by profit margin, then review ad spend for each tier. Shift budget from low-margin products (even if ACoS looks good) to high-margin products (even if ACoS is higher). Read more about TACoS and advertising efficiency.
3. Hidden fee creep
When you track profit over time, you'll notice margin compression on products where nothing seems to have changed. Often, Amazon fee increases are the culprit. FBA fees adjust regularly, and these small changes compound across your catalog.
The fix: Review products with declining margins but stable sales and COGS. Check if fee changes occurred. Adjust pricing to maintain margins, or evaluate whether the product is still viable at higher fee levels. Our FBA fee reduction guide Covers specific tactics.
Companies that use data-driven insights improve their profitability by 5-6% on average. For an Amazon seller doing $1M annually, that's $50-60K in additional profit just from better visibility into existing operations.
Building the daily dashboard habit
A profit dashboard is only valuable if you use it. The best sellers check their numbers daily, but briefly. Here's how to build the habit without it consuming your day.
| Review Type | Time | What to Check | Action Triggers |
|---|---|---|---|
| Daily glance | 2-3 minutes | Yesterday's profit, TACoS, any red flags | Profit down 20%+, TACoS spike 5pts+ |
| Weekly review | 15-20 minutes | Week trends, product performance, ad efficiency | Products losing money, budget reallocation |
| Monthly deep dive | 45-60 minutes | Month-over-month trends, COGS accuracy, strategic decisions | Product launches, discontinuations, price changes |
The daily check should happen at the same time each day. Most sellers find morning reviews (before getting into tasks) work best. You're looking for anomalies, not deep analysis. When you spot something unusual, flag it for your weekly review rather than investigating immediately.
For a complete review framework, see our weekly business review checklist that covers the exact metrics and cadence top sellers use.
Next steps after setup
Once your dashboard is running and you've completed your first week, expand your profit tracking capabilities with these additions:
- →Set up contribution margin tracking: go beyond net profit to see CM1, CM2, and CM3 for different decision contexts. Our contribution margin guide Explains the framework.
- →Create product tags: Group products by supplier, launch date, category, or any dimension meaningful to your business. Tagged products enable custom reporting and faster analysis. Learn more about custom breakdown strategies.
- →Connect additional marketplaces: If you sell in multiple Amazon regions, connect them all to see unified profit data. Our multi-marketplace guide Covers the specifics.
- →Review your P&L statement: Once monthly, export your profit data into a proper P&L format. This gives you the financial clarity lenders and investors expect. See our P&L statement guide.
Frequently asked questions
Start tracking today
Every day without profit visibility is a day you might be losing money without knowing it. The 30 minutes you invest in setup today will pay dividends for as long as you sell on Amazon.
The sellers who scale successfully share one trait: they know their numbers. They make decisions based on data, not gut feeling. They catch problems early and double down on winners faster than competitors.
Ready to see your true profitability? Nova Analytics gives you a complete profit dashboard with hourly refresh. Explore the profit dashboard for daily P&L visibility, or run a full profit analytics to diagnose margin leaks per SKU. You can also check our analytics tools comparison to find the right solution for your business size and needs.
Sources & References
Ready to Transform Your Amazon Business?
Join thousands of successful sellers who use Nova Analytics to make data-driven decisions and maximize their profits.
Continue Learning
Explore more expert insights to grow your Amazon business
Best Amazon Analytics Tools 2026: 12 P&L Trackers Compared
We tested 12 Amazon P&L tools on accuracy, speed, and price. See how every tool scored on data refresh, fee tracking, and ease of use. Full comparison table included.
Amazon COGS by SKU: Track True Product Profitability
Your average COGS is hiding the truth. That '35% margin' masks SKUs running at 45% and others hemorrhaging at 15%. Here's how to track costs per product.
Best AMZScout Alternative 2026 - Profit Analytics Stack
AMZScout helps sellers find products. Nova shows which ones actually make money — reconciled against Amazon SP-API. Build a research + profit-tracking stack from $29/month.