How to Calculate Your Break-Even ACoS on Amazon (2026)
Most sellers calculate break-even ACoS using gross margin and end up 10-15 points too high. Here's the complete formula with all 40+ Amazon fee types, worked examples, and category benchmarks.
•Break-Even ACoS = your pre-ad profit margin percentage. Any ACoS below this number means your ads are profitable.
•A break-even ACoS based only on COGS and referral fees is too high because it omits other applicable costs.
•In the worked example below, a $24.99 kitchen gadget with $6.50 COGS has a 22.4% break-even ACoS after the stated costs.
•Amazon's 3.5% fuel surcharge and any applicable low-inventory fees should be included in each SKU's break-even ACoS.
•Three levers to improve your break-even ACoS: reduce COGS through supplier negotiation, minimize fees through inventory planning, or increase price through A/B testing.
Every Amazon seller running PPC knows their ACoS. Very few know whether that ACoS is actually making them money. The gap between those two things is costing sellers thousands of dollars every month in campaigns they think are profitable but aren't.
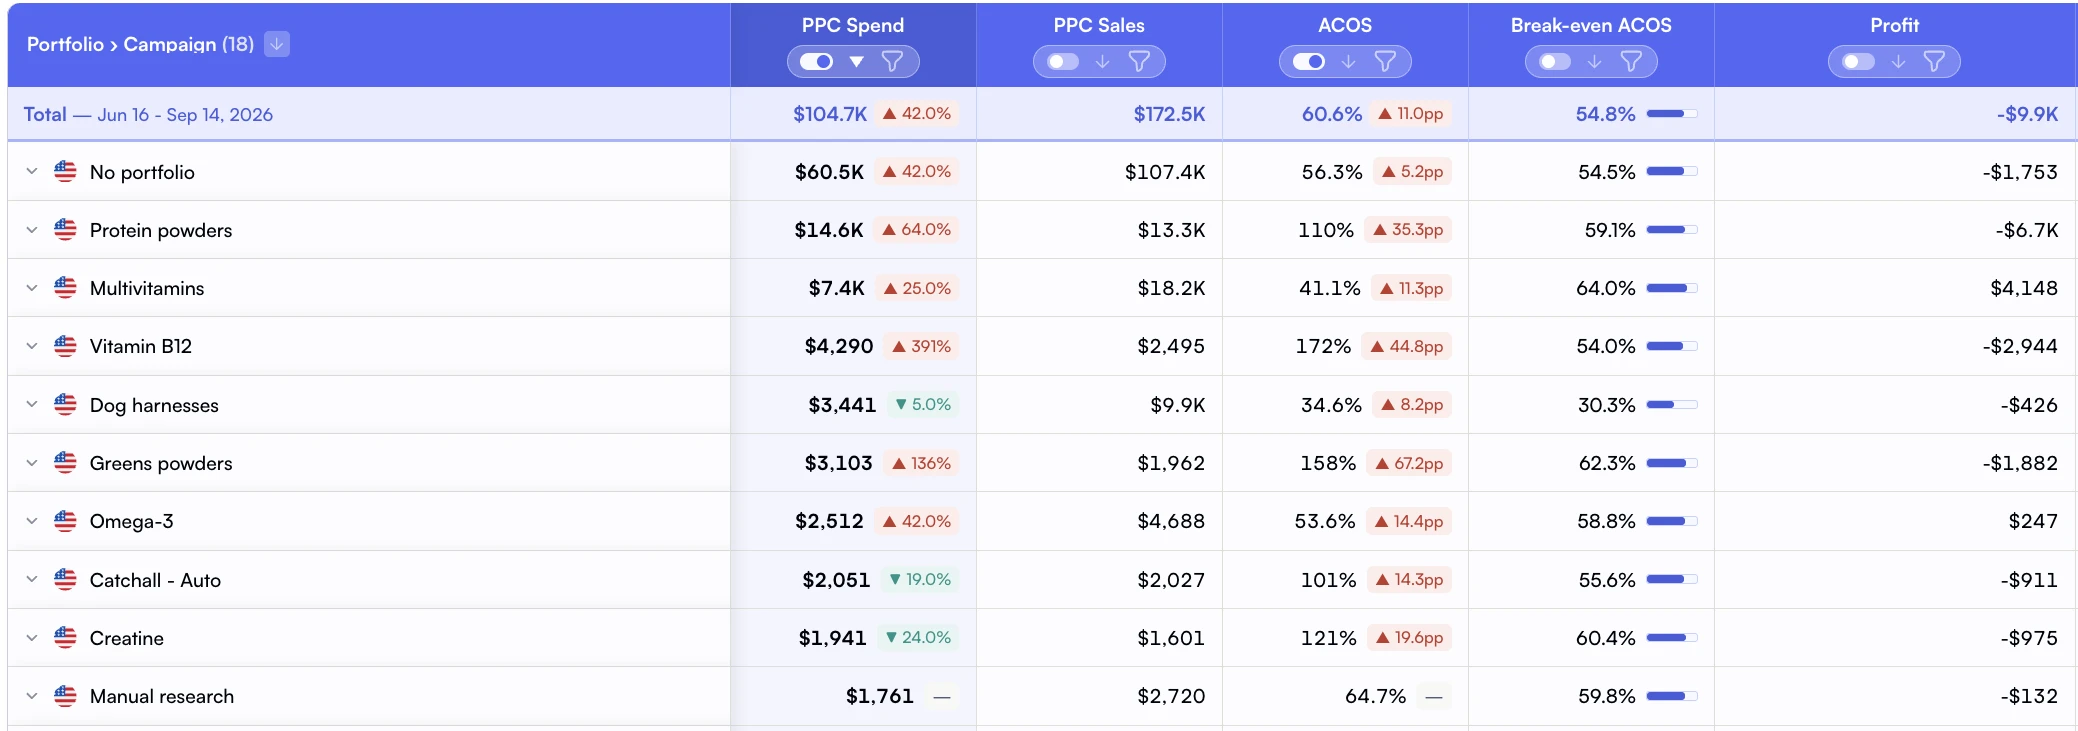
Compare ACOS with break-even ACOS to judge campaign performance on profit.
Break-even ACoS is the single most important number in your advertising strategy. It tells you the exact point where your ad spend stops generating profit and starts eating into your margin. Get this number wrong, and you're optimizing toward the wrong target. Get it right, and every bid adjustment you make is grounded in real profitability data.
A simplified formula can omit applicable costs and produce a break-even ACoS that is too high. This guide walks through the complete calculation, including every fee Amazon charges in 2026, with a real product example you can follow along with. If you want the per-unit profit number first, run your SKU through our Amazon FBA profit & fee calculator and bring the result back here.
What Break-Even ACoS Actually Is (And Why Amazon's Default ACoS Is Misleading)
ACoS (Advertising Cost of Sales) is the percentage of ad-attributed revenue you spent on advertising. If you spent $20 on ads and generated $100 in ad sales, your ACoS is 20%.
Simple enough. But ACoS alone tells you nothing about profitability. A 20% ACoS is great if your profit margin is 40%. It's terrible if your margin is 15%.
The Core Definition
Break-Even ACoS is the ACoS at which your ad spend exactly equals your profit margin. At this point, you're neither making nor losing money on ad-attributed sales.
If your product has a 30% profit margin before ad spend, your break-even ACoS is 30%. Spend less than 30% of ad revenue on ads, and you're profitable. Spend more, and you're losing money on every ad-attributed sale.
Amazon's Campaign Manager shows you ACoS, but it doesn't show you your break-even point. It doesn't know your COGS, your actual FBA fees per unit, your return rate, or the dozen other costs eating into your margin. That's why so many sellers target arbitrary ACoS numbers ("keep it under 30%") without knowing if 30% is even profitable for their specific product.
The Formula: Break-Even ACoS = Profit Margin Before Ad Spend
The concept is straightforward. The challenge is getting an accurate profit margin. Here's the full calculation:
Step
Calculation
Example ($24.99 product)
Selling Price
Your listed price
$24.99
Minus COGS
Cost of goods (landed)
- $6.50
Minus Referral Fee
15% of selling price (most categories)
- $3.75
Minus FBA Fulfillment Fee
Based on size and weight tier
- $3.22
Minus All Other Fees
Storage, returns, fuel surcharge, etc.
- $5.92
Pre-Ad Profit
Revenue minus all costs
$5.60
Break-Even ACoS
$5.60 / $24.99
22.4%
At 22.4% ACoS, this product generates zero profit on ad sales. Above that, you're losing money. Below it, you're making money. Every percentage point below 22.4% adds directly to your bottom line.
Why Simplified Calculations Fail
A simplified break-even ACoS calculation looks like this:
That's 59% vs. The real 22.4%. A seller using this number would think campaigns at 40% ACoS are profitable when they're actually losing $4.40 per unit sold.
The difference comes from Amazon fees omitted from the simplified calculation. Industry research shows Amazon charges 40+ different fee types depending on your category, size tier, and fulfillment method.
FBA pick and pack fees (varies by size tier, updated January 2026)
Monthly storage fees ($0.78-$2.40/cubic foot depending on season)
Returns processing fees (applies to categories with return rates above threshold)
Long-term storage fees ($6.90/cubic foot for items stored 271-365 days)
Inbound placement fees ($0.21-$0.68 per unit for non-minimal splits)
Fuel and inflation surcharge (3.5% added April 2026)
Low-inventory-level fees (for items with less than 28 days of supply)
Each fee might seem small individually. Combined, they can eat 15-25% of your selling price. That's the difference between thinking your ads are profitable and actually having profitable ads.
Step-by-Step: Calculate Break-Even ACoS for a Real Product
Let's walk through every cost for a standard-size kitchen gadget selling at $24.99 on Amazon US. This is a real scenario: a silicone utensil set, 12 oz, standard size tier, sourced from China. Here's the complete variable cost breakdown.
Cost Type
Amount
Notes
COGS (landed)
$6.50
Manufacturing + shipping + duties
Referral Fee (15%)
$3.75
Kitchen category standard rate
FBA Fulfillment Fee
$3.22
Standard size, 12 oz (2026 rates)
Monthly Storage
$0.28
Based on 60-day average inventory
Inbound Placement
$0.27
Partial split option
Fuel Surcharge (3.5%)
$0.11
Applied to FBA fulfillment fee (April 2026)
Returns Processing (est.)
$0.48
Based on 8% return rate, $6 per return
Refund Administration
$0.30
Amazon keeps 20% of referral on returns
Estimated Removal/Disposal
$0.08
For damaged/unsellable units
Labeling/Prep
$0.40
FBA label service or 3PL prep
Total Costs
$15.39
All variable costs per unit
Pre-Ad Profit
$9.60
$24.99 - $15.39
Break-Even ACoS
38.4%
$9.60 / $24.99
Why Per-SKU Matters
This calculation changes for every product in your catalog. A heavier item has higher FBA fees. A higher-priced item has a higher referral fee in dollar terms but potentially a higher margin percentage. A product with a 15% return rate has dramatically different economics than one with 3%. You need to calculate break-even ACoS per SKU, not per account. Tools like Nova's P&L analytics automate this by tracking all 40+ fee types at the product level.
How 2026 Fee Changes Affect Your Break-Even ACoS
Amazon's 2026 fee updates hit sellers from multiple angles. If you calculated your break-even ACoS in 2025 and haven't updated it, you're likely running on stale numbers.
Fuel Surcharge
3.5%
Added to FBA, MCF, and Buy with Prime fees since 17 April 2026
Margin Impact
Apply each fee to the SKU's published fulfilment rate and recalculate its break-even ACoS.
Low-Inventory Penalty
$0.32+
Per unit fee when inventory drops below 28 days of supply
The fuel surcharge alone reduces your break-even ACoS. For a product with $3.22 in FBA fees, the surcharge adds $0.11. Multiply the per-unit change by your expected units and include other applicable fee changes before recalculating break-even ACoS. The April 2026 fuel surcharge applies to every FBA, MCF, and Buy with Prime order.
The low-inventory fee is the sneakier margin killer. If you let inventory dip below 28 days of supply, Amazon charges an additional per-unit fee. This fee doesn't show up in most margin calculators because it's conditional. But for sellers who run lean inventory (common during cash-constrained growth phases), it directly lowers the break-even ACoS.
Break-Even ACoS by Category: 2026 Benchmarks
Your category determines your referral fee rate, average return rate, and typical FBA fees. Here's how break-even ACoS varies across major Amazon categories, based on Feedvisor marketplace data and Amazon's published fee schedules. These assume standard-size products with average margins for each category.
Category
Referral Fee
Avg Return Rate
Typical Break-Even ACoS
Health & Supplements
8%
3-5%
45-55%
Beauty & Personal Care
8-15%
5-8%
35-50%
Home & Kitchen
15%
6-10%
25-40%
Sports & Outdoors
15%
8-12%
20-35%
Toys & Games
15%
8-12%
20-30%
Clothing & Apparel
17%
15-25%
10-20%
Electronics
8%
10-15%
8-18%
Why Supplements Have the Highest Break-Even ACoS
Supplements benefit from a lower referral fee (8% vs. 15%), very low return rates (people don't usually return vitamins), and high perceived value relative to COGS. A $29.99 supplement with $4 COGS and 8% referral fee has dramatically more margin to play with than a $29.99 kitchen gadget with $8 COGS and 15% referral fee. This is why supplement brands can afford aggressive ACoS targets that would bankrupt a home goods seller.
These ranges are wide because COGS varies enormously within categories. A seller sourcing domestically will have 2-3x higher COGS than one importing from China. Use these as directional benchmarks, not as your actual break-even ACoS. Always calculate your own per-SKU number. For detailed benchmarks across 50+ KPIs, see the Amazon Seller KPI Benchmarks 2026 guide.
Target ACoS vs. Break-Even ACoS: The Difference Between Survival and Growth
Your break-even ACoS is the ceiling. Your target ACoS is where you actually want to be. The gap between them is your ad-attributed profit margin.
Metric
What It Means
Example (38.4% break-even)
Break-Even ACoS
Max ACoS before losing money
38.4%
Target ACoS (Growth)
Slim margin, maximize volume
30-35%
Target ACoS (Balanced)
Healthy profit on ad sales
20-28%
Target ACoS (Profit-First)
Maximum margin per sale
10-18%
The right target depends on your business stage and goals. A new product launch might accept ACoS near break-even to build velocity. An established product with strong organic rank should target much lower ACoS to maximize profit. Your TACoS (Total ACoS) tells you whether your overall ad efficiency is improving over time.
When to Run Campaigns Above Break-Even
Running ads at a loss sounds reckless. But in specific, time-limited scenarios, it's a legitimate strategy. The key word is "intentional."
Legitimate Above-Break-Even Scenarios
New product launches (first 30-60 days): you're buying velocity and reviews. Set a budget cap and a clear timeline. Track organic rank weekly to measure whether the investment is working.
Seasonal ranking plays: Spending aggressively before Prime Day or Q4 to secure organic positions that pay off during peak season.
Strategic keyword conquests: Dominating a high-volume keyword to displace a competitor. Only viable if you have the margin to sustain 2-4 weeks of above-break-even spend.
Subscription products: when customer lifetime value exceeds first-purchase profitability. A supplement with 40% repeat purchase rate can afford a higher initial acquisition cost.
When Above-Break-Even Is Just Burning Cash
If you've been running campaigns above break-even ACoS for more than 60 days without measurable organic rank improvement, you're not investing. You're subsidizing Amazon's ad platform. Check your organic vs. PPC sales split. If organic isn't growing while ad spend increases, the strategy isn't working.
How to Reduce Your Break-Even ACoS: 3 Levers
If your break-even ACoS is too low to run profitable campaigns (common in electronics and apparel), you have three options. Each one increases the gap between your costs and your revenue, giving you more room for ad spend.
Lever 1: Reduce COGS
Renegotiate with suppliers, consolidate orders for volume discounts, or switch to alternative materials. A 10% reduction in COGS on a $6.50 item saves $0.65 per unit. Across 5,000 monthly units, that's $3,250/month back into your margin. According to Practical Ecommerce research, most private label sellers have room to reduce COGS by 8-15% through supplier negotiation alone.
Lever 2: Minimize Amazon Fees
You can't change Amazon's referral fee rates, but you can control several fee types:
Reduce storage fees by maintaining optimal inventory levels (45-60 days of supply). This also avoids low-inventory penalties.
Lower return rates through better listing images and descriptions. Every 1% reduction in returns saves $0.06-$0.12 per unit in processing fees.
Optimize product dimensions to stay within a smaller size tier. Sometimes reducing packaging by 1 inch drops you into a lower FBA fee bracket.
Use inbound placement wisely by choosing minimal splits when the fee savings outweigh the slower distribution.
Test price changes rather than assuming the result. A $2 price increase on a $24.99 product adds $2 to your pre-ad margin (minus the incremental referral fee), which raises your break-even ACoS by roughly 7 percentage points.
The fear is that higher prices mean fewer sales. Sometimes they do. But the data often says otherwise. According to Profitero's pricing research, products positioned in the top 30% of their category's price range often maintain comparable conversion rates, especially with strong reviews and optimized listings. The best approach is to test it. Amazon's Manage Your Experiments lets you A/B test price changes directly and measure the impact on both units and revenue.
The Price-Margin-ACoS Connection
A $2 price increase on a $24.99 product (now $26.99) increases your referral fee by $0.30 but adds $1.70 net to your margin. If your pre-increase break-even ACoS was 38.4%, post-increase it jumps to roughly 42%. That's 3.6 extra percentage points of headroom for your PPC campaigns. Multiply that across 50 SKUs and you've fundamentally changed your ad economics.
Tracking Break-Even ACoS at Scale
Calculating break-even ACoS for one product is a spreadsheet exercise. Doing it for 50, 200, or 1,000 SKUs across multiple marketplaces requires a different approach.
Every product in your catalog has a different COGS, a different return rate, different storage costs, and a different FBA fee based on dimensions and weight. Your break-even ACoS isn't a single number. It's a per-SKU metric that changes whenever Amazon updates fees, you adjust pricing, or your COGS shifts.
Nova's product-level P&L calculates contribution margin per SKU automatically, pulling in all Amazon fee types including the 2026 surcharges. That contribution margin, expressed as a percentage of revenue, is your break-even ACoS. No spreadsheets, no missing fee types, updated daily.
For sellers managing campaigns across multiple accounts or marketplaces, the custom segmentation feature lets you group products by brand, category, or any custom tag and see aggregate break-even ACoS by segment. This is particularly useful for agencies managing PPC across client portfolios.
Real-World Impact: What Happens When You Fix Your Break-Even ACoS
Case Study: Home & Kitchen Brand ($180K/month Revenue)
A home goods seller with 45 SKUs was targeting 35% ACoS across all campaigns, based on a rough margin estimate. After calculating accurate break-even ACoS per product (including returns, storage, and all 2026 fees), they discovered:
12 SKUs had a break-even ACoS below 25%. Their "profitable" 35% campaigns were losing $2.80 per unit.
18 SKUs had break-even ACoS between 35-50%. These were genuinely profitable at 35%.
15 SKUs had break-even ACoS above 50%. They had room to bid more aggressively and capture more volume.
Result: By setting per-SKU ACoS targets based on actual break-even numbers, they increased total profit by 23% while spending 8% less on ads over 3 months.
Connecting Break-Even ACoS to True ROAS
ACoS and ROAS are two sides of the same coin. ROAS (Return on Ad Spend) = 1 / ACoS. A 25% ACoS equals a 4x ROAS. But just like ACoS, the standard ROAS metric doesn't tell you if you're profitable. That's why True ROAS (which factors in all costs, not just ad spend and revenue) is the more useful metric for profitability analysis.
Your break-even ACoS translates directly to a break-even ROAS: Break-Even ROAS = 1 / Break-Even ACoS. For our $24.99 kitchen gadget with a 38.4% break-even ACoS, the break-even ROAS is 2.6x. Any campaign with a ROAS above 2.6x is profitable. Below that, it's losing money.
Calculate your break-even ACoS for your top 10 SKUs. Use the full formula (not the simplified version). Include every fee type. Then compare that number against your current ACoS targets. If you find campaigns running above break-even, you've just identified immediate profit leaks.
For sellers with larger catalogs, doing this manually for every SKU isn't realistic. That's where per-product P&L tracking becomes essential. Whether you use spreadsheets, custom reports, or a tool like Nova, the goal is the same: know your real margin per product, set ACoS targets based on that margin, and stop guessing.