Gross profit tells you if a product is viable. Contribution margin tells you if it's worth your time. Learn how to calculate CM1, CM2, and CM3 for Amazon products with category benchmarks and strategic applications.
Gross profit tells you if a product is viable. Contribution margin tells you if it's worth your time. The difference matters: a $30 product with 40% gross margin and 8% contribution margin is destroying value. This guide breaks down CM1, CM2, and CM3 calculations for Amazon sellers.
Most Amazon sellers track gross profit. Sophisticated operators track contribution margin at multiple levels. They know exactly which products generate cash to cover fixed costs and which just look profitable on the surface.
Here's why it matters: contribution margin analysis reveals the true profit engine of your business.[1] let's break it down.
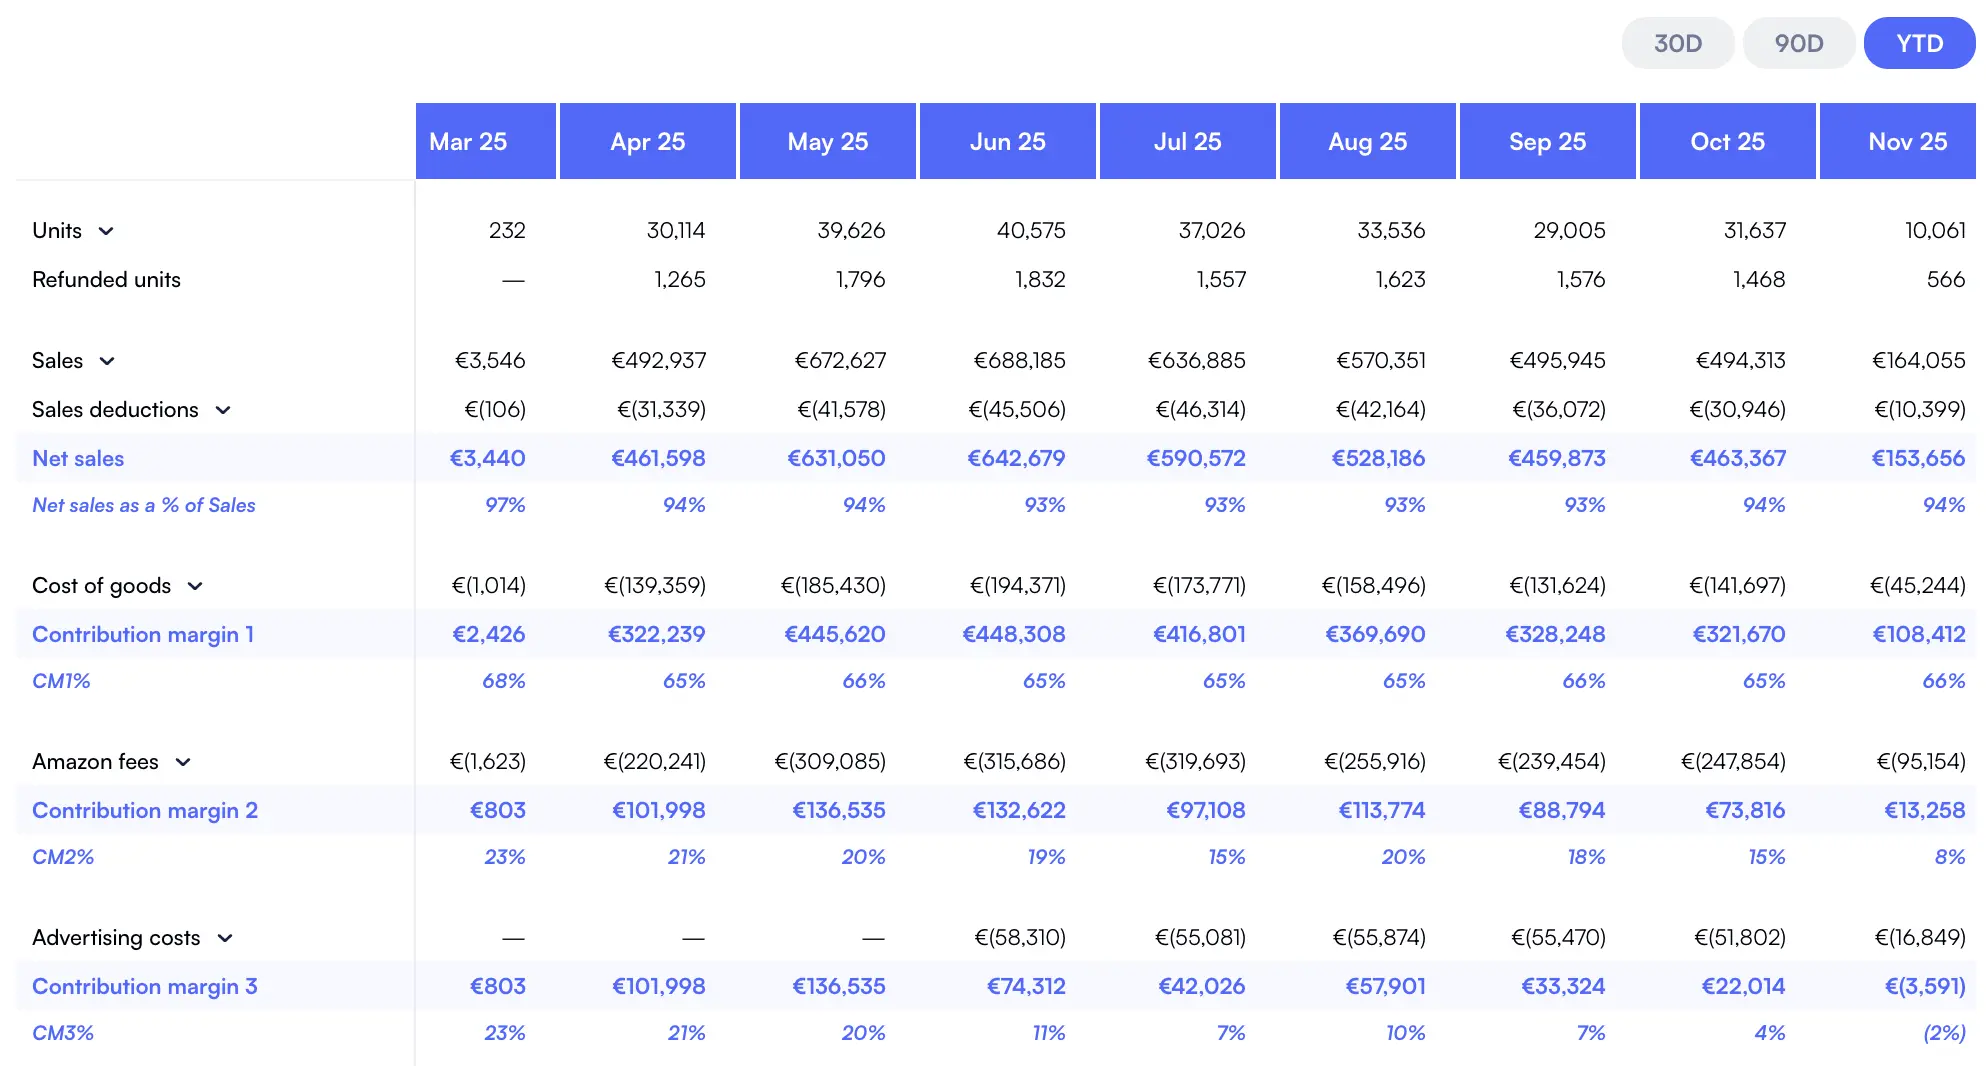
Nova's customizable P&L view shows contribution margin at the SKU level
Contribution Margin vs. Gross Profit: The Critical Difference
Gross profit subtracts COGS from revenue. It answers: "Did I make money on this sale after product costs?"
Contribution margin goes further. It answers: "How much does this sale contribute to covering my fixed costs and generating profit?"
For Amazon sellers, variable costs include things gross profit ignores: FBA fees, referral fees, and variable advertising spend. A product with 50% gross margin might have only 15% contribution margin after Amazon takes its cut.
CM1, CM2, CM3: The Three Levels of Contribution Margin
Professional Amazon operators use three contribution margin levels. Each answers a different strategic question.
CM1: Product Viability
Revenue - COGS - FBA Fees
Can this product exist on Amazon?
CM2: Marketing Efficiency
CM1 - Ad Spend
Is advertising sustainable?
CM3: True Contribution
CM2 - Returns - Promos
What's the real bottom line?
CM1: Product Viability Margin
CM1 strips away everything except core economics. It answers: "If I sell this product without advertising, does it make sense?"
This is your baseline. If CM1 is negative or below 20%, you have a structural problem. No amount of advertising optimization will fix bad unit economics. Amazon's fee structure shows referral fees range from 8-15% depending on category, and FBA fees add $3-$8+ per unit.[2] to get a fast CM1 read on a specific ASIN, use our Amazon FBA profit & fee calculator.
CM1 Benchmark: Target CM1 of 35%+ for products requiring significant advertising. Target 25%+ for products with strong organic rank. Below 20% CM1 means your margins can't absorb any meaningful ad spend.
CM2: Marketing-Adjusted Margin
CM2 reveals whether your advertising strategy is sustainable. It answers: "After paying for customer acquisition, is this product still contributing?"
CM2 = CM1 - PPC Advertising Cost
This metric exposes the advertising trap. Many sellers chase ACoS targets without realizing they're running negative CM2. A 25% ACoS on a 30% CM1 product leaves only 5% CM2. That's not sustainable at scale.
Metric
Product A
Product B
Analysis
Sale Price
$29.99
$49.99
-
COGS
$8.00
$15.00
-
Amazon Fees
$9.50
$13.50
Referral + FBA
CM1
$12.49 (42%)
$21.49 (43%)
Both look healthy
Ad Spend (25% ACoS)
$7.50
$12.50
Same ACoS target
CM2
$4.99 (17%)
$8.99 (18%)
Tight after ads
CM3: True Contribution Margin
CM3 is reality. It includes everything that varies with sales volume: returns, promotions, coupons, and deals. This is what actually hits your bank account.
Returns are particularly brutal. National Retail Federation research shows e-commerce return rates average 15-20% in some categories.[3] A 10% return rate with $5 in return processing costs per unit can slash CM3 by 15-20% versus CM2.
The CM3 reality check: many "profitable" products show positive CM2 but negative CM3. A 10% coupon + 8% return rate + 5% Lightning Deal participation can turn 18% CM2 into 5% CM3. Track CM3 monthly to see actual contribution.
Step-by-Step CM Calculation for Amazon Products
Let's walk through a complete example. Say you sell a kitchen gadget at $34.99.
Return Rate: 6% × $34.99 = $2.10 in refunded revenue
Return Processing: 6% × $4.50 = $0.27 in fees
Average Coupon: 5% of sales use 10% coupon = $0.17
CM3: $7.76 - $2.10 - $0.27 - $0.17 = $5.22 (15%)
The verdict: this product has healthy CM1 (42%) but tight CM3 (15%). It's contributing to fixed costs, but there's not much room for error. A 5-point increase in return rate would cut CM3 nearly in half.
CM Benchmarks by Amazon Category
Category changes the answer, because referral rates, parcel sizes and return behaviour all differ. Referral rates are published by Amazon per category, and fulfilment fees follow size and weight, so build your own CM ladder from your categories and your parcel dimensions.
Read these as directional, not as targets. A new product in its launch phase may run negative CM2 on purpose to build rank; the point of the table is to tell you whether your own margin gap is a category characteristic or a problem specific to your catalogue.
Using CM Analysis for Strategic Decisions
Contribution margin isn't just a number to track. It's a decision-making framework.
Pricing Decisions
CM analysis shows exactly how price changes affect profitability. A $2 price increase doesn't add $2 to profit. It adds $2 minus the incremental referral fee (roughly $1.70 net). But if it reduces volume by 20%, you need to model whether total contribution dollars increase or decrease.
Portfolio Decisions
Rank your products by CM3, not revenue. A $100K/year product with 5% CM3 contributes $5,000. A $40K/year product with 25% CM3 contributes $10,000. Which deserves more of your time and inventory capital?
Pro Tip: Advanced operators track CM3 per hour of management time. A "difficult" product requiring constant attention might have great CM3 percentage but poor CM3 per hour. This helps prioritize which products to grow and which to milk or divest.
Advertising Decisions
Stop optimizing ACoS in isolation. Set your target ACoS based on CM1. If CM1 is 40%, you can afford up to 30% ACoS and still have positive CM2. If CM1 is 25%, you need ACoS under 15% to break even on CM2.
Nova's profitability dashboard integrates contribution margin data with advertising costs, so you can see true profitability by product, not just efficiency metrics.
Tracking CM in Nova
Manual CM tracking breaks down at scale. With 50+ SKUs, tracking three levels of contribution margin across products, time periods, and scenarios becomes unmanageable in spreadsheets.
View CM trends over time: see if margins are improving or eroding
Compare products by CM tier: Sort your catalog by contribution, not revenue
Set CM alerts: get notified when a product drops below target CM3
Model scenarios: see how price changes or COGS increases affect CM
The P&L dashboard shows contribution margin alongside traditional profit metrics, giving you both perspectives in one view.
Frequently asked questions
Target CM3 of 12-20% for most categories. Below 10% is risky. You need margin buffer for fee increases, competitive pressure, or unexpected costs. Above 25% CM3 is excellent and suggests you might have pricing power to test higher prices.
Contribution margin only includes variable costs that change with each sale. Net profit also includes fixed costs like software subscriptions, salaries, and overhead. CM tells you which products contribute to covering those fixed costs.
Not automatically. Consider: (1) Is CM3 positive? Even small positive CM3 contributes to fixed costs. (2) Does the product drive other sales? Bundle anchors or brand awareness products might justify low CM3. (3) Can CM3 be improved through optimization?
Review monthly at minimum. COGS changes, fee updates, and advertising shifts all affect CM. Automated tracking through tools like Nova ensures you always have current data.
The gap between CM1 and CM3 reveals your true variable cost structure. Large gaps (20+ points) suggest heavy advertising dependency, high return rates, or aggressive promotional strategies. Analyze each component to identify improvement opportunities.
Start Tracking Contribution Margin Today
Gross profit is where most sellers stop. Contribution margin is where profitable sellers differentiate. By understanding CM1, CM2, and CM3 for every product, you make better decisions about pricing, advertising, and portfolio allocation.
The math isn't complicated. The discipline of tracking it consistently is what separates operators who scale profitably from those who grow revenue while margins erode.