Standard ROAS ignores referral fees, FBA costs, and COGS. True ROAS shows the actual profit per ad dollar. Learn the formula, category benchmarks, and how to calculate it per SKU.
You're running Amazon PPC campaigns with a 20% ACoS and a 5:1 ROAS. Looks profitable, right? Not so fast. That "5x return" ignores referral fees, FBA fulfillment, storage costs, returns, and your actual product cost. When you subtract those, your real return on ad spend drops dramatically. Sometimes below breakeven.
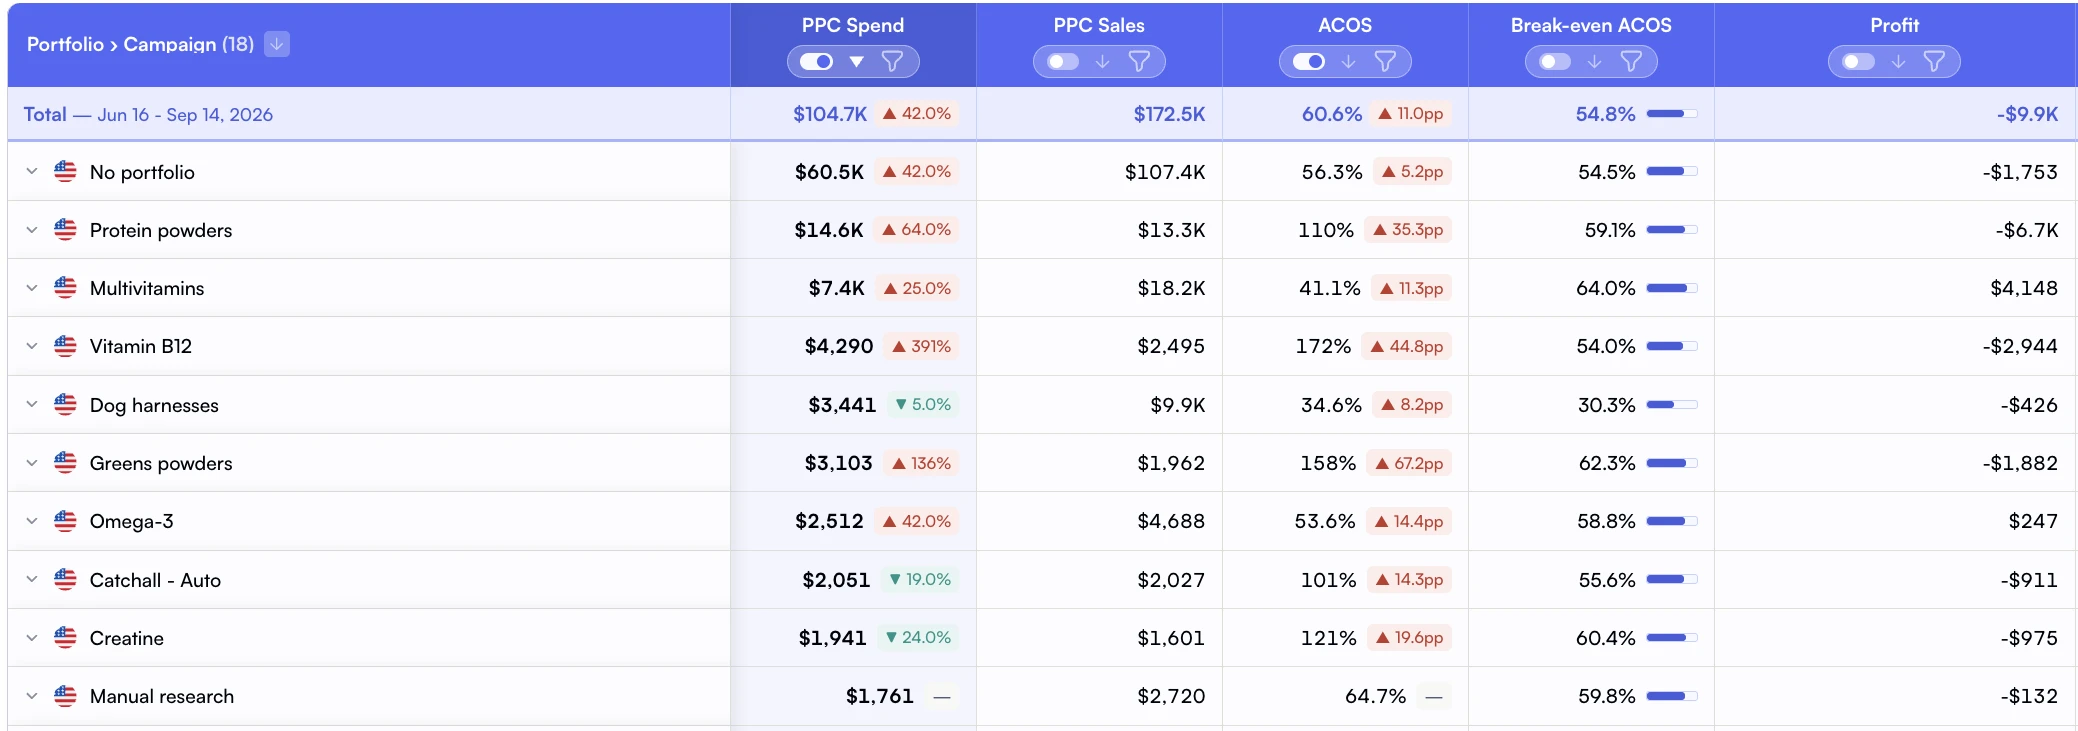
Compare ACOS with break-even ACOS to judge campaign performance on profit.
This guide introduces the concept of True ROAS: the actual profit generated per dollar of ad spend after accounting for every Amazon fee and cost. You'll learn the formula, see category-specific benchmarks, and understand why tracking this metric at the SKU level changes how you allocate your ad budget.
Why Standard ROAS Is Misleading
Amazon Advertising reports ROAS as a simple ratio: attributed revenue divided by ad spend. A $25 sale from $5 in ad spend gives you a 5:1 ROAS. Campaign managers celebrate. CFOs scratch their heads when the bank account doesn't reflect those "returns."
The disconnect is straightforward. Standard ROAS treats gross revenue as profit. It doesn't subtract the 15% referral fee ($3.75), the $6.20 FBA fulfillment fee, $1.50 in COGS, or $0.80 in monthly storage allocation. After those costs, your $25 sale yields $7.75 in actual margin. Divide that by $5 in ad spend, and your True ROAS is 1.55:1. That's a 68% drop from the reported number.
The ROAS Reality Gap
According to a WordStream benchmark study, the average Amazon ROAS across categories is 3:1 to 8:1. But when sellers account for all fees and COGS, Marketplace Pulse advertising data shows the median net profit contribution from PPC drops to 8-15% of attributed revenue. That's a True ROAS closer to 1.2:1 to 2:1 for most categories.
This isn't just a reporting nuance. It changes which campaigns you scale, which you pause, and which products you should stop advertising entirely. A campaign with 30% ACoS on a high-margin supplement might outperform a 15% ACoS campaign on a low-margin kitchen gadget. Standard ROAS can't tell you that. True ROAS can.
The True ROAS Formula
True ROAS measures net profit per ad dollar Rather than gross revenue per ad dollar. Here's the formula broken down:
True ROAS = (Attributed Revenue - All Costs) / Ad Spend
That 5:1 standard ROAS felt great. The 1.66:1 True ROAS tells the real story: you're earning $1.66 in margin for every $1 in ad spend. Still profitable, but you need to know this number before you decide to scale that campaign's budget by 3x.
True ROAS Benchmarks by Category
True ROAS varies wildly by product category because margin structures differ. A supplement seller with 70% gross margins has very different True ROAS thresholds than a consumer electronics seller running at 25% margins. Here are realistic benchmarks based on Marketplace Pulse advertising cost data and typical category fee structures:
Category
Avg Standard ROAS
Avg True ROAS
Typical Margin
Breakeven ACoS
Health & Supplements
4.5:1
2.8:1
55-70%
35-45%
Beauty & Personal Care
5.2:1
2.1:1
45-60%
30-40%
Home & Kitchen
3.8:1
1.4:1
30-45%
20-30%
Toys & Games
4.1:1
1.5:1
35-50%
25-35%
Electronics & Accessories
3.2:1
0.9:1
20-30%
12-20%
Pet Supplies
4.0:1
1.9:1
40-55%
28-38%
Why This Matters for Budget Allocation
A 4:1 standard ROAS on an electronics product (True ROAS: 0.9:1) is actually losing money on every ad-attributed sale. Meanwhile, a "disappointing" 3:1 standard ROAS on a supplement (True ROAS: 2.2:1) is highly profitable. Without True ROAS, you'd scale the wrong campaign and cut the right one.
How to Calculate True ROAS for Your Products
Calculating True ROAS manually requires pulling data from multiple Seller Central reports and matching it at the SKU level. Here's the step-by-step process:
Step 1: Pull Your Per-Unit Cost Stack
For each advertised SKU, you need to know the total cost per unit sold. This means combining data from your Seller Central reports with your own COGS records:
Product cost: What you pay your supplier per unit, including packaging
Inbound shipping: Freight, customs, duties divided by units in that shipment
Referral fee: Category-specific percentage (8-15% for most categories)
FBA fulfillment: Based on product size and weight tier
Storage: Monthly storage fee allocated per unit based on cubic feet and time in warehouse
Returns cost: Return rate multiplied by the returns processing fee plus lost inventory value
Where to Find These Numbers
Referral and FBA fees are in the Fee Preview report in Seller Central. Storage fees are in the Monthly Storage Fee report. Returns data comes from the FBA Customer Returns report. COGS you track yourself, ideally with a structured COGS tracking system. For a complete breakdown of where to pull each number, check our P&L statement guide.
Step 2: Match Ad Spend to SKU-Level Sales
Download your Sponsored Products Search Term Report and your Advertised Product Report from the advertising console. These give you ad spend and attributed sales by SKU. Cross-reference with your Business Report for total sales per SKU so you can separate organic from paid attribution.
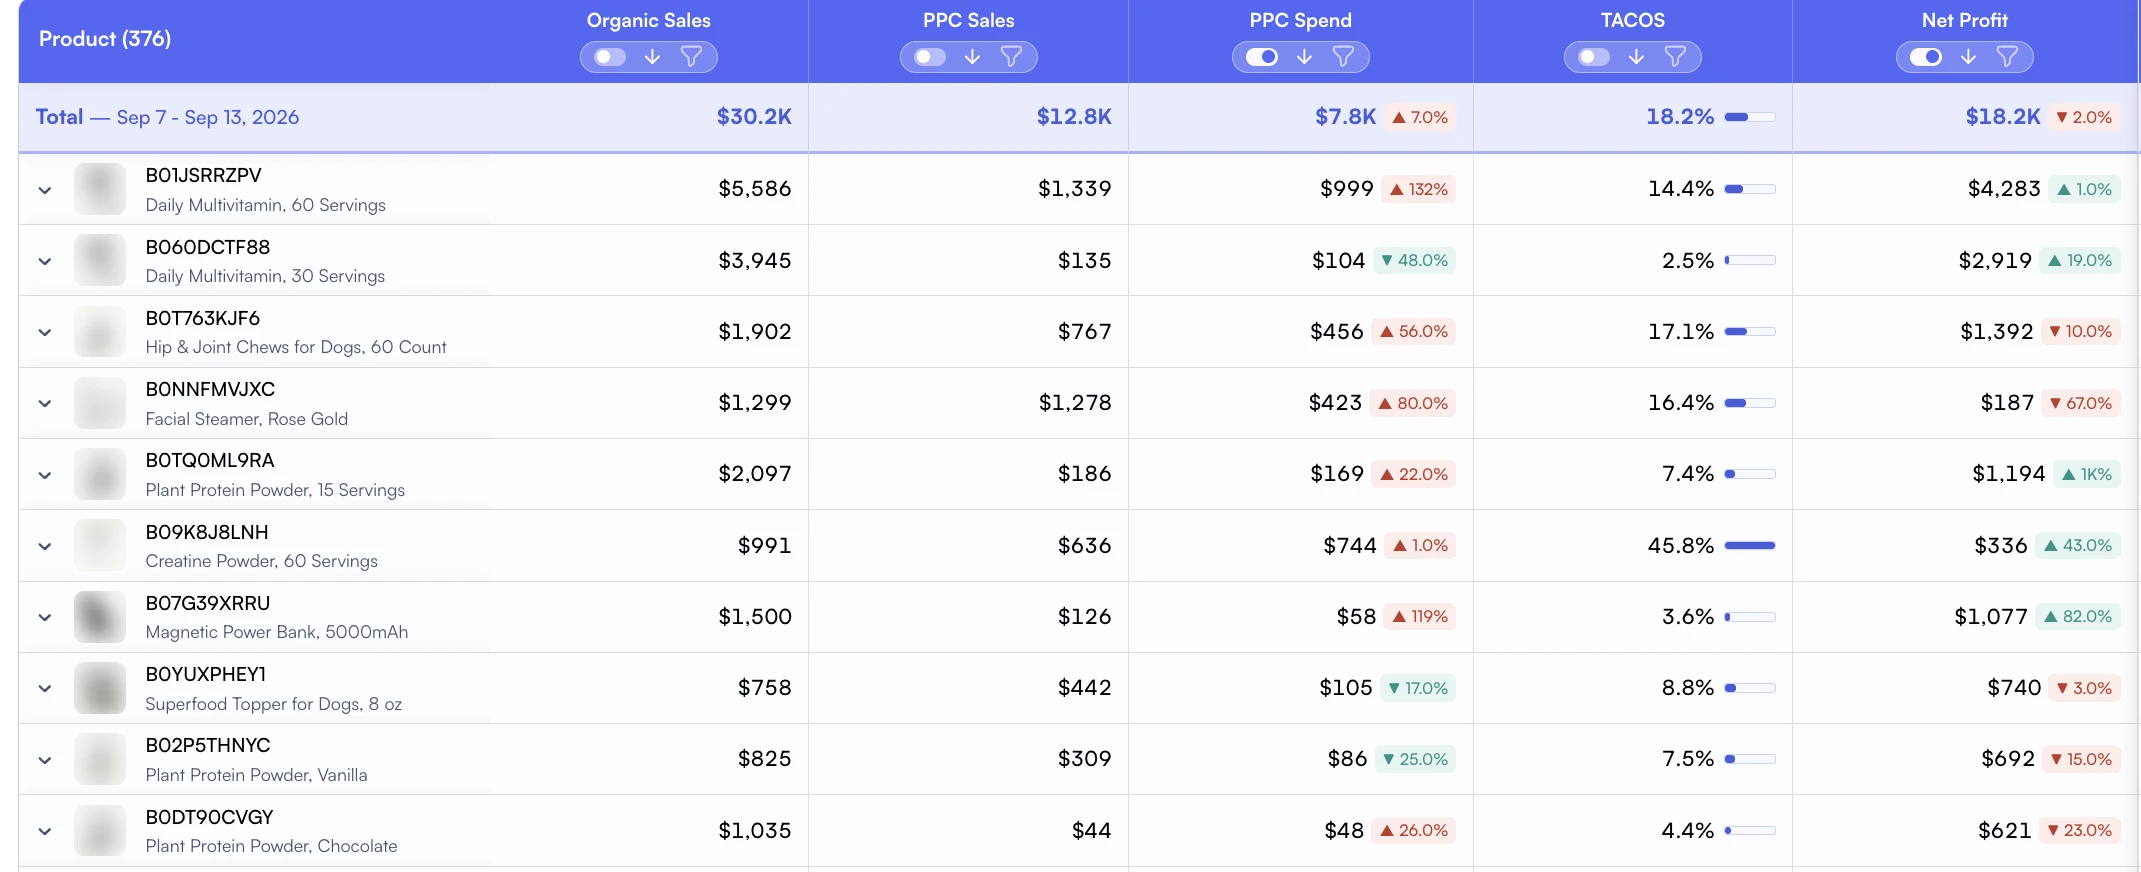
The organic and PPC sales split puts advertising dependence alongside product profit.
This is where things get tricky. Amazon's attribution window (7 or 14 days depending on campaign type) means a sale might be attributed to an ad click from two weeks ago. Your organic vs PPC tracking needs to account for this lag, or you'll double-count revenue.
Step 3: Calculate and Compare
With your per-unit cost stack and SKU-level ad data, you can now compute True ROAS for each product:
Product A (Supplement, $34.99 price)
Net margin per unit: $18.20 (52%)
Ad spend per attributed sale: $7.50
True ROAS: $18.20 / $7.50 = 2.43:1
Standard ROAS: $34.99 / $7.50 = 4.67:1
Product B (Kitchen tool, $19.99 price)
Net margin per unit: $4.80 (24%)
Ad spend per attributed sale: $5.20
True ROAS: $4.80 / $5.20 = 0.92:1
Standard ROAS: $19.99 / $5.20 = 3.84:1
Product B has a perfectly respectable 3.84:1 standard ROAS. Most sellers would keep scaling that campaign. But it's actually losing $0.40 on every ad-attributed sale. Product A, with a lower standard ROAS, is the one worth investing more budget into.
Common True ROAS Mistakes (and How to Avoid Them)
Mistake #1: Using Average COGS Instead of SKU-Level
Many sellers use a blended COGS across their catalog. But your $3 product and your $15 product have very different margin structures. Average COGS makes high-margin products look worse and low-margin products look better than they are. Always calculate True ROAS at the individual SKU level using your SKU-level COGS data.
Mistake #2: Ignoring the Organic Halo Effect
PPC drives organic ranking improvements. A campaign with a 1.1:1 True ROAS might still be worthwhile if it's pushing your product to page 1 organically. Track your TACoS (Total Advertising Cost of Sale) alongside True ROAS to capture this halo effect. If TACoS is declining while True ROAS stays stable, your ads are doing their job.
Mistake #3: Not Accounting for Seasonal Fee Changes
FBA storage fees spike 2-3x during Q4 (October through December). A campaign that's profitable at 1.8:1 True ROAS in June might drop to 0.9:1 in November purely from storage cost increases. Recalculate True ROAS quarterly at minimum, and check the latest FBA storage fee schedule before making budget decisions.
These are your profit drivers. Scale budget aggressively on these SKUs. Consider expanding to Sponsored Brands and Sponsored Display for additional reach.
Action: Increase daily budget 20-30%
True ROAS 1.3:1 to 2.0:1
Profitable but not stellar. Optimize keywords, test new ad copy, and tighten targeting. These campaigns need refinement, not more budget.
Action: Optimize targeting and bids
True ROAS 1.0:1 to 1.3:1
Breaking even or barely profitable. Only justify continued spend if TACoS is declining (organic halo effect) or during a product launch phase. Set a 30-day review deadline.
Action: Review in 30 days, cut if no improvement
True ROAS Below 1.0:1
Losing money on every ad-attributed sale. Pause these campaigns immediately unless you're in a deliberate launch phase with a defined budget cap and timeline.
Action: Pause or reduce to minimum
This framework connects directly to your PPC analytics and P&L tracking. When you can see True ROAS by product in your analytics dashboard, budget reallocation takes minutes instead of hours of spreadsheet work.
True ROAS vs Other PPC Metrics: When to Use What
True ROAS doesn't replace ACoS, TACoS, or standard ROAS. Each metric answers a different question. Here's when to use each one:
Metric
What It Answers
Best Used For
Limitation
ACoS
What % of ad revenue went to ad spend?
Quick campaign health check
Ignores all non-ad costs
Standard ROAS
How many dollars of revenue per ad dollar?
Comparing campaigns within same category
Treats revenue as profit
TACoS
What % of total revenue goes to ads?
Measuring organic growth from PPC
Doesn't show per-campaign profitability
True ROAS
How many dollars of profit per ad dollar?
Budget allocation, scaling decisions
Requires accurate COGS and fee data
The most effective approach? Use ACoS for daily monitoring, TACoS for weekly trend analysis, and True ROAS for monthly budget allocation decisions. This layered approach gives you speed where you need it and precision where it matters. Your daily analytics dashboard handles the first two automatically, while True ROAS ties into your custom analytics for deeper strategic review.
Scaling True ROAS Tracking Beyond Spreadsheets
Calculating True ROAS manually works when you have 5-10 SKUs. It breaks down quickly. Here's what happens at scale:
20+ SKUs: Manual calculation takes 4-6 hours per month just for data collection and matching
Multiple marketplaces: each marketplace has different fee structures, currency conversion adds another layer
Campaign types: Sponsored Products, Sponsored Brands, and Sponsored Display each have different attribution models
Tools like Nova solve this by automatically matching ad spend to product-level P&L data, calculating True ROAS in real-time across your entire catalog. Instead of pulling 5 separate reports and building pivot tables, you see True ROAS per SKU updated daily alongside your other key performance metrics.
The 20-SKU Threshold
Based on Statista's marketplace data, the average active Amazon seller manages 50-200 SKUs. At that scale, manual True ROAS tracking isn't just time-consuming. It's inaccurate because the data changes faster than you can calculate it. Automated analytics dashboards become essential, not optional.
Frequently asked questions
A True ROAS above 1.5:1 is generally profitable for most categories. For high-margin products (supplements, beauty), aim for 2.0:1 or higher. For lower-margin categories (electronics, home goods), anything above 1.2:1 is solid. The key benchmark is that your True ROAS must exceed 1.0:1 for the campaign to generate actual profit after all costs.
Monthly at minimum, quarterly for deep analysis. Fee structures change (especially FBA fee updates), return rates fluctuate seasonally, and COGS may shift with supplier negotiations. Automated tools recalculate daily, which is ideal for active campaign management.
Not necessarily. During launches, a True ROAS of 0.8-1.0:1 might be acceptable because PPC drives initial sales velocity and reviews, which boost organic ranking. Set a clear budget cap and timeline (typically 4-8 weeks), and track launch-specific KPIs alongside True ROAS to evaluate overall launch ROI.
Yes, but the attribution models differ. Sponsored Brands uses a 14-day attribution window and can credit sales of any product in your brand, not just the advertised one. Sponsored Display includes view-through attributions. For accurate True ROAS across all campaign types, you need to track per-product ad ROI and adjust for each ad type's specific attribution methodology.
Next Steps: Start Tracking True ROAS Today
You don't need to overhaul your entire analytics stack to start using True ROAS. Begin with your top 5 advertised SKUs, calculate the per-unit cost stack for each one, and compare the True ROAS to your current standard ROAS targets. The gap will tell you immediately whether your budget allocation is optimized or whether you've been scaling unprofitable campaigns.
For sellers managing larger catalogs, connecting your store to an analytics platform that calculates True ROAS automatically saves hours of manual work and gives you daily visibility into which campaigns actually make money. Your profit and loss dashboard should show you this number without any spreadsheet gymnastics.