Amazon charges you in at least 10 different ways per unit sold. Most sellers track 2-3 of these. The rest silently erode margins by 3-8%. Here's how to see all of them.
Amazon charges you in at least 10 different ways per unit sold. Referral fees, FBA fulfillment, storage, inbound shipping, disposal, coupons, deals. Most sellers track two or three of these. The rest silently erode margins by 3-8% without anyone noticing until the quarterly P&L looks wrong.
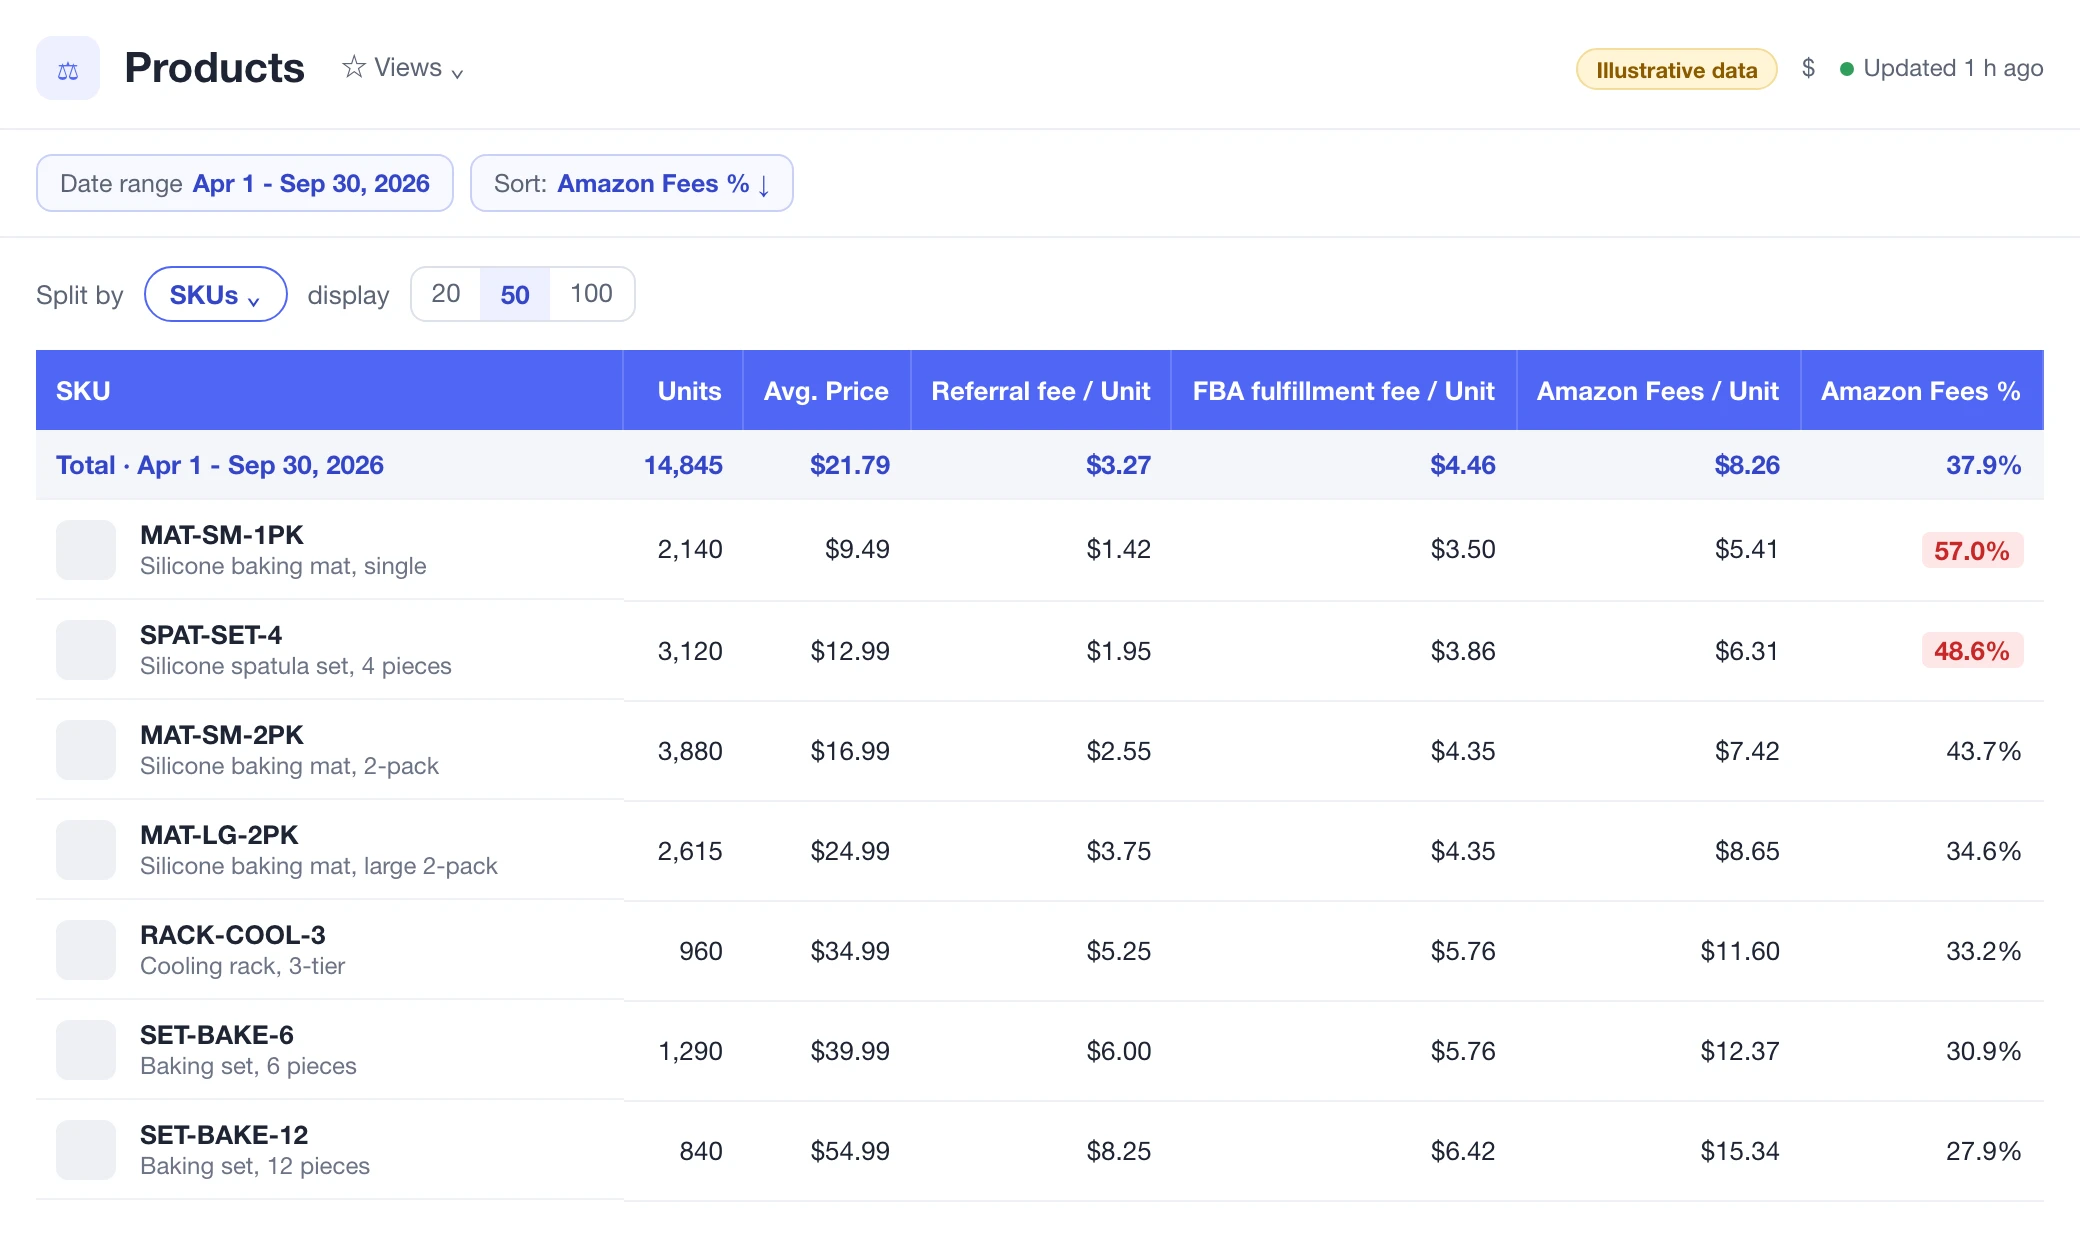
Compare fees per unit with their share of price before judging product profitability.
This guide covers every variable cost line Amazon charges, how to track each one per unit, and how to spot fee creep before it kills your profitability. Not how to reduce fees. How to see them.
Why Fee Tracking Matters More Than Fee Reduction
There's no shortage of articles about reducing Amazon fees. But here's the problem: you can't reduce what you don't track. Most sellers know their referral fee percentage. Beyond that? It gets fuzzy. And fuzzy cost tracking leads to fuzzy pricing, fuzzy margin calculations, and fuzzy portfolio decisions.
The Invisible Fee Creep
A seller's FBA fulfillment fees increased by $0.35 per unit after a product dimension re-measurement. Storage fees spiked 40% when Q4 rates kicked in. Inbound transportation fees added $0.22 per unit from a warehouse routing change. Total impact: $0.97 per unit. On 5,000 monthly units, that's $4,850 in monthly profit evaporating. They didn't notice for 3 months.
Hidden Cost Lines
10
Distinct variable cost categories Amazon charges per unit sold
Untracked Fees
4-6
Average number of fee lines sellers don't actively monitor
Margin Impact
3-8%
Typical margin erosion from unmonitored variable cost increases
The difference between this article and existing fee guides: reducing FBA fees is strategy. Fee schedule changes is news. Storage fee calculation is math. This article is about monitoring: building visibility into every cost line so you catch changes when they happen.
The 10 Variable Cost Lines Amazon Charges
Every unit you sell on Amazon triggers multiple fee calculations. Here's the complete list of variable costs that change based on your sales volume, product dimensions, and promotional activity.
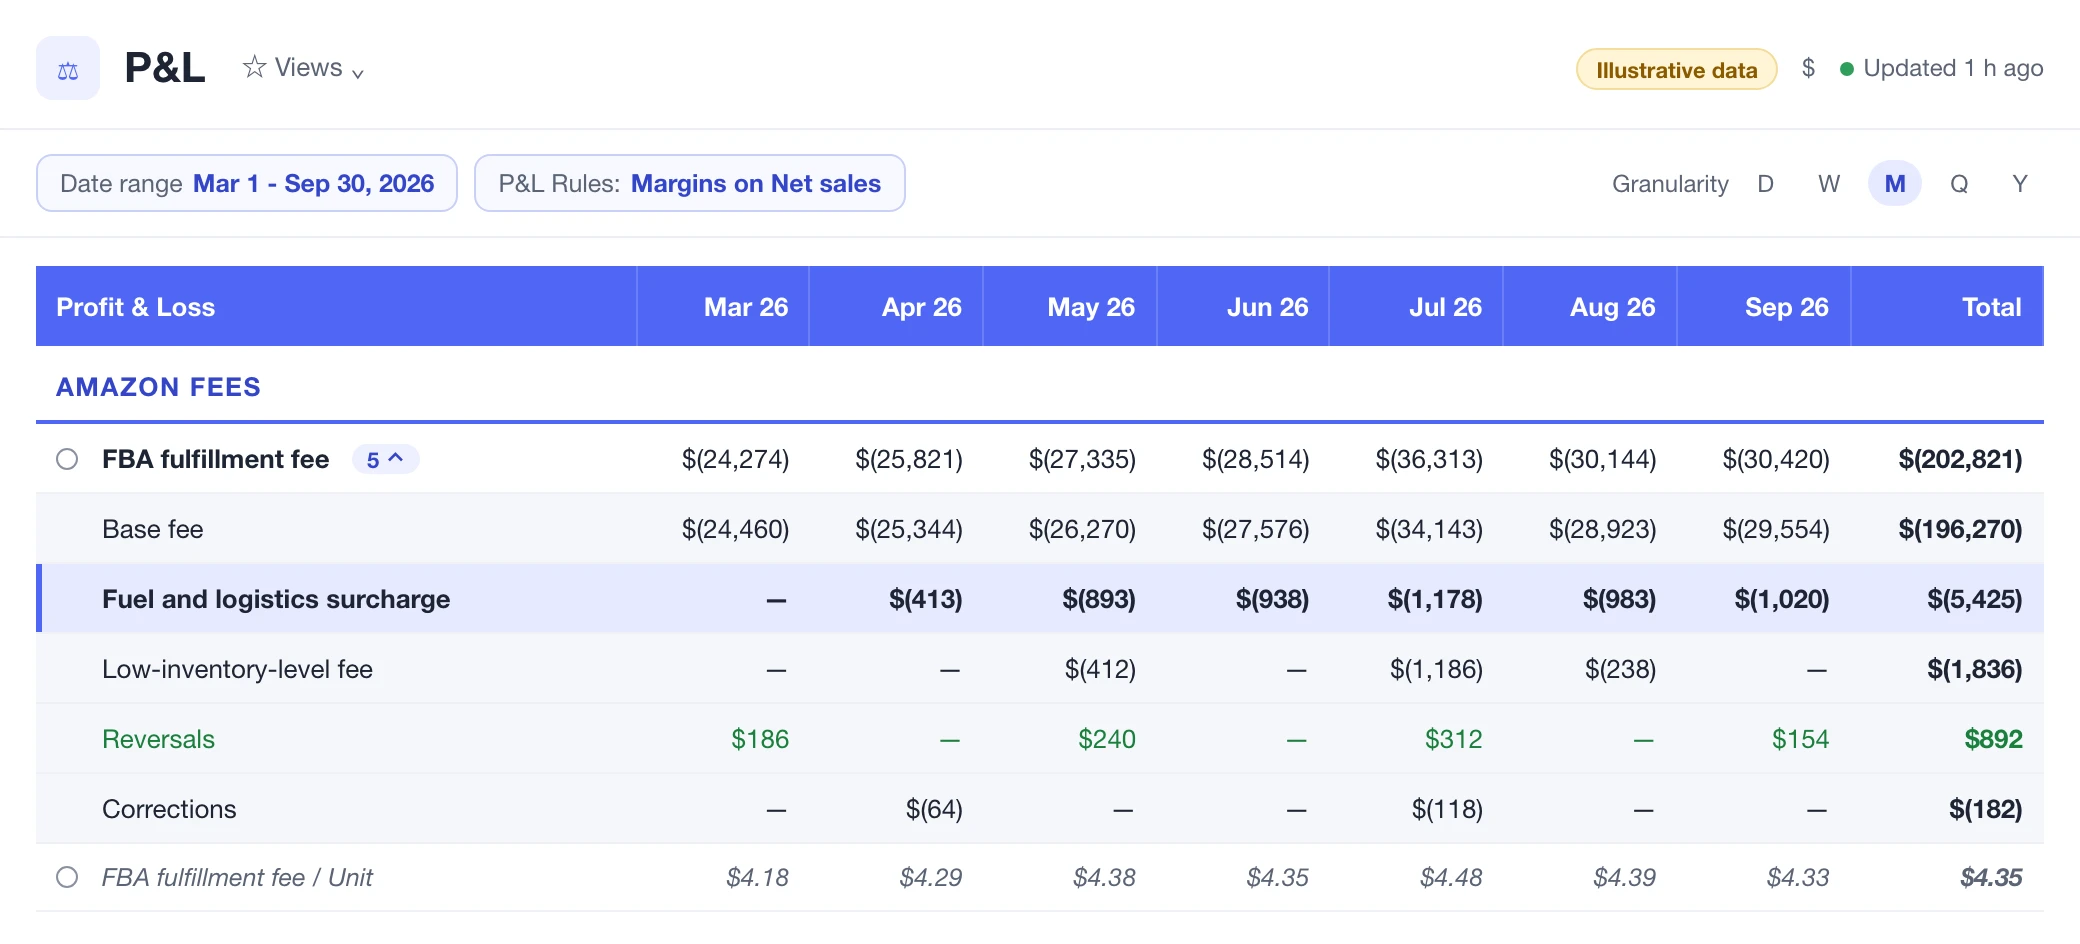
The fulfillment fee breakdown separates the base charge from surcharges and adjustments.
Always track fees both as total dollars and per-unit cost. A $2,000 monthly storage bill sounds manageable. But if you only sold 500 units, that's $4.00 per unit in storage alone. The per-unit view reveals which products carry disproportionate fee burdens. Nova's P&L dashboard lets you toggle between absolute and per-unit views instantly.
Deep Dive: The Five Most Overlooked Cost Lines
Every seller tracks referral and FBA fulfillment fees. Here are the five cost lines that slip through the cracks and compound silently.
1. Inbound Transportation Fees
When you use Amazon's partnered carrier program, you pay per-shipment fees based on weight and distance. These fees don't appear in your standard fee reports. They show up in shipment-level settlement data. At scale, inbound transportation adds $0.15-$0.50 per unit. Most sellers don't allocate this cost back to individual ASINs.
2. Coupon Performance Fees
Amazon charges $0.60 per coupon clipped, on top of the discount amount. A $2-off coupon with 1,000 redemptions costs you $2,600 ($2,000 discount + $600 performance fee). Sellers often account for the discount but forget the $0.60 per-clip charge. Over a year of active coupon campaigns, this fee can total thousands in untracked cost.
3. Deal Participation Fees
Lightning Deals cost $150-$500 per deal. 7-Day Deals cost $300 each. If you run deals weekly, that's $1,200-$2,000 per month in deal fees alone. Divide that by units sold during the deal. A $300 deal fee on a deal that generates 50 incremental units costs you $6 per unit. Is the deal still profitable after that?
4. Disposal and Removal Fees
When inventory ages past 271 days, you face a choice: pay long-term storage fees or pay disposal/removal fees. Both are costs. Disposal runs $0.97 per standard unit. Removal to your address runs $0.97-$4.00. Neither appears in your regular "cost per unit sold" calculations unless you specifically allocate them back to the SKU.
5. Discounts as a Variable Cost
Subscribe & Save discounts, promotional discounts, employee discounts. These all reduce your net revenue per unit. A $29.99 product with a 15% S&S discount nets $25.49 before fees. If you're calculating margins on $29.99, you're overstating profitability for every S&S order. Track discounts as a cost line, not just a revenue reduction.
How Nova Tracks All 10 Cost Lines
Nova automatically pulls all 10 variable cost lines from Settlement Reports, Advertising Reports, and Shipment Data. Each cost is allocated to the correct ASIN and displayed both as total cost and per-unit cost. The P&L view shows your full cost waterfall from revenue to CM3, with every fee layer visible.
How to Spot Fee Creep: Three Warning Signals
Fee creep happens gradually. Here are three signals to watch for in your weekly reviews.
Signal 1: Total Fees per Unit Rising While Price Stays Flat
If your total variable cost per unit increases week-over-week while your selling price hasn't changed, something shifted. Check for dimension re-measurements, storage tier changes, or new promotional fees. Use day-to-day tracking to spot the inflection point.
Signal 2: CM3% Declining While CM1% Stays Stable
CM1% (revenue minus COGS) is stable, but CM3% (after all fees) is dropping. The gap between them is widening. This means Amazon fees or ad spend are growing faster than revenue. Drill into the per-unit fee breakdown to find the culprit.
Signal 3: Seasonal Fee Spikes Not Reversing
Q4 storage fees are expected to be higher. But if your per-unit storage cost in February is still at October levels, check your IPI score and sell-through rate. You might have excess post-holiday inventory accumulating fees that should have been cleared by January.
Building a Fee Monitoring Dashboard
Whether you use a spreadsheet or a dedicated analytics dashboard, your fee tracking needs these views:
Trendlines catch creep before it compounds. Use custom reports to build these views.
Pro Tip: Set Fee Alerts
Configure alerts for when any fee line per unit increases by more than 10% week-over-week. Early detection turns a $4,850 quarterly loss into a $200 monthly blip that you catch and address immediately. The Winners & Losers feature flags products with sudden margin compression automatically.
Connecting Fees to Portfolio Decisions
Per-unit fee tracking isn't just about cost monitoring. It drives strategic decisions about which products to keep, kill, or grow.
SKU Rationalization
Products with total fees exceeding 45% of revenue are candidates for SKU rationalization. Before cutting them, check if the fees are structural (high referral category, heavy product) or addressable (storage fees from excess inventory, disposal fees from quality issues).
Pricing Decisions
When you know your true total variable cost per unit (all 10 lines), you can set minimum viable prices with confidence. If total variable costs are $14.50 per unit and COGS is $8, your floor price is $22.50 to break even. Add your target margin on top. No guessing.
Exit Valuation
Buyers in FBA acquisition due diligence scrutinize fee structures. Clean, granular fee tracking demonstrates operational maturity and accurate margin reporting. It directly impacts your valuation multiple.
Frequently asked questions
Amazon distributes fee data across Settlement Reports, Fee Preview, Storage Reports, Shipment Reports, Deals Dashboard, and Coupons Dashboard. There's no single "all fees" report. Analytics tools like Nova consolidate all 10 cost lines into a single per-unit view.
Storage fees are charged based on cubic footage. Calculate each ASIN's cubic footage (L × W × H ÷ 1,728), multiply by units in storage, then multiply by the applicable rate. This gives you per-ASIN storage cost. Divide by units sold to get per-unit storage cost.
Track per-unit fulfillment and referral fees weekly (they change with dimension re-measurements and price changes). Track storage fees monthly (that's how Amazon charges them). Track promotional fees per campaign. Aggregate everything monthly for reporting.
For standard-size FBA products, total Amazon fees (referral + fulfillment + storage) typically run 30-40% of selling price. Add promotional fees and it can reach 45%. If your total fee burden exceeds 45%, investigate size tier optimization, packaging changes, or FBM alternatives for slow sellers.