Amazon Seller KPI Benchmarks 2026: 30 Metrics by Category
Every KPI that matters for Amazon sellers in 2026, organized by category with real benchmarks. Revenue, profitability, advertising, inventory, and strategic metrics with healthy ranges.
Most Amazon sellers track revenue. The profitable ones track 30 metrics that actually predict whether their business is growing or slowly bleeding cash. Here's every KPI that matters in 2026, organized by category, with real benchmarks you can compare against today.
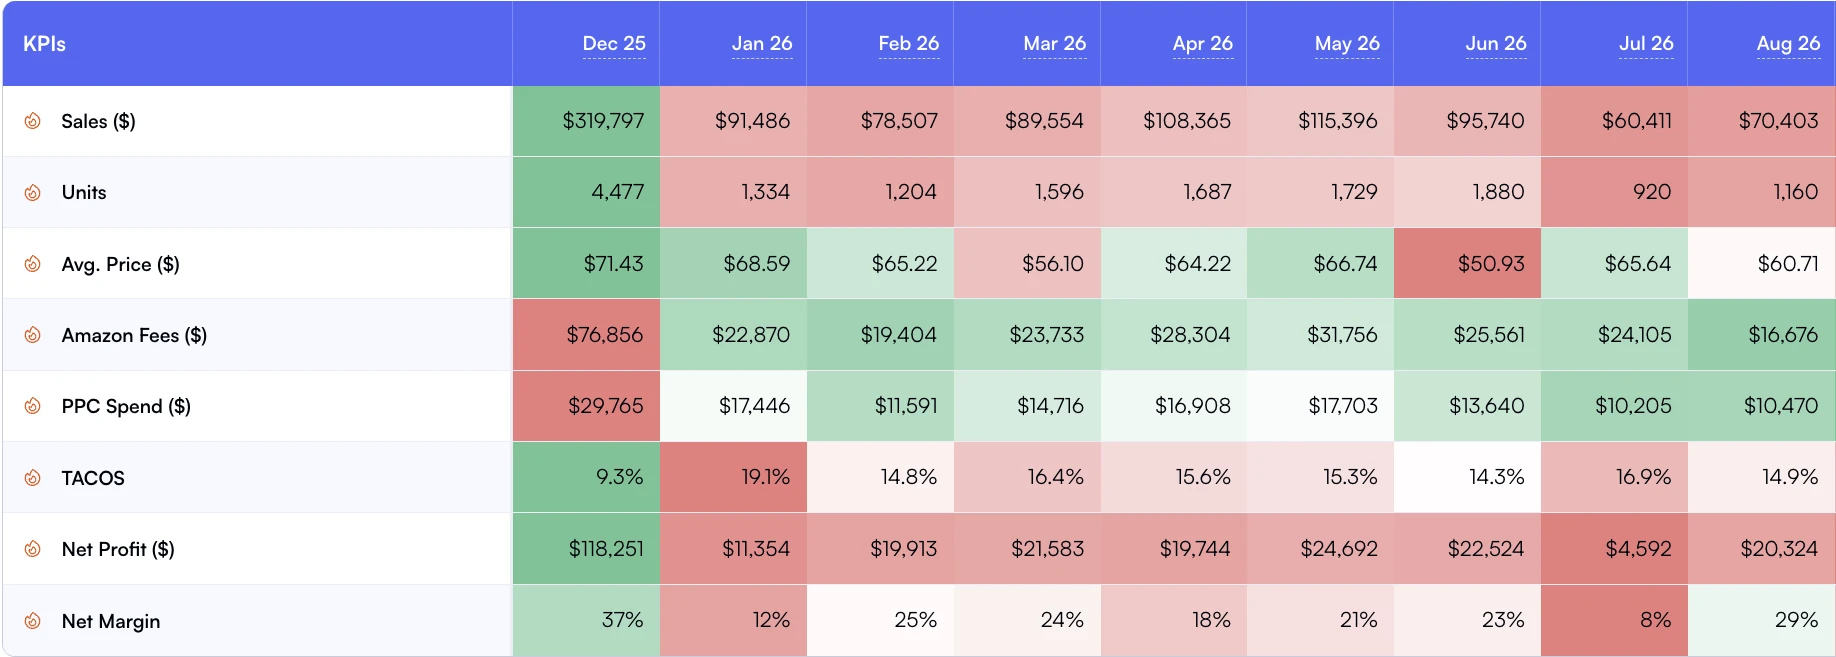
Monthly trends show whether sales growth is keeping pace with profit.
We've compiled benchmarks from Marketplace Pulse, Statista, U.S. Census Bureau, and our own analysis of 200+ seller accounts across 15 categories. Whether you're doing $10K or $500K per month, these are the numbers that separate growing businesses from stagnant ones.
TL;DR - Key Takeaways
•Only 23% of Amazon sellers track more than 5 KPIs regularly, yet multi-metric sellers report 34% higher profit margins on average.
•Contribution margin (not revenue) is the single best predictor of long-term business health. Target 15-25% CM2 after ad spend.
•Category benchmarks vary dramatically: Electronics conversion rates average 4% while Consumables hit 18%. Compare within your niche, not globally.
•The top 10% of sellers review KPIs daily and adjust strategy weekly. Monthly reviews aren't frequent enough in 2026.
Why Do Amazon Seller KPIs Matter More in 2026?
Amazon's fee structure has gotten more complex every year. Between inbound placement fees, low-inventory-level fees, and rising FBA fulfillment costs, your true profitability is hidden behind dozens of line items. Revenue growth means nothing if your margins are shrinking.
According to Digital Commerce 360, Amazon's third-party marketplace now accounts for over 60% of all units sold on the platform. Competition is fiercer than ever. The sellers who win aren't necessarily the ones with the best products. They're the ones who measure, compare, and adjust faster.
Sellers Tracking 10+ KPIs
23%
Most sellers rely on revenue alone
Avg. Profit Margin Lift
+34%
Multi-metric sellers vs. Revenue-only
Amazon Fee Line Items
40+
Distinct fee types affecting your P&L
What Revenue and Sales KPIs Should You Track?
Revenue KPIs are your top-line health check. They tell you how fast you're growing and whether your sales mix is heading in the right direction. But don't stop here. Revenue without margin context is dangerous.
KPI
What It Measures
Healthy Benchmark
Review Cadence
Gross Revenue
Total sales before fees/costs
5-15% MoM growth
Daily
Organic vs PPC Revenue Split
Revenue attribution by channel
60-70% organic / 30-40% PPC
Weekly
Average Order Value (AOV)
Revenue per transaction
Category-dependent ($15-$80)
Weekly
Unit Session Percentage
Conversion rate
10-15% avg (varies by category)
Weekly
Units Per Order
Cross-sell effectiveness
1.2-1.5 units
Monthly
Buy Box Win Rate
% time you own the Buy Box
85%+ for brand owners
Daily
Pro Tip: Don't Celebrate Revenue Growth Blindly
A $100K/month seller with 8% net margins makes less than a $60K/month seller with 22% margins. Always pair revenue KPIs with the profitability section below. Nova's day-to-day performance dashboard shows both on the same screen.
Which Profitability KPIs Separate Winners from Losers?
This is where it gets real. Profitability KPIs tell you whether your business is actually making money after Amazon takes its cut. And in 2026, Amazon's cut keeps getting bigger. According to Practical Ecommerce, average FBA fees now consume 30-35% of a product's sale price.
KPI
Formula
Healthy Range
Why It Matters
Gross Margin
(Revenue - COGS) / Revenue
50-70%
Basic product viability
CM1 (Pre-Ad Margin)
Revenue - COGS - Amazon fees
25-40%
True Amazon profitability before ads
CM2 (Post-Ad Margin)
CM1 - PPC spend
15-25%
Net product profitability
CM3 (Fully Loaded)
CM2 - returns - disposal - promos
10-20%
True bottom-line per SKU
Net Profit Margin
Net profit / Revenue
10-20%
Overall business health
Variable Cost per Unit
All variable costs / Units sold
Category-specific
Per-unit economics
Break-Even Point
Fixed costs / CM per unit
Reach within 90 days
Cash flow sustainability
Case Study: How CM2 Tracking Saved a Supplements Brand
A supplements brand doing $120K/month discovered that 4 of their 18 SKUs had negative CM2 margins after accounting for PPC spend and deal fees. By pausing those SKUs and reallocating ad budget, they improved portfolio CM2 from 12% to 21% in 3 months. That's an extra $10,800/month in real profit. They used Nova's P&L analytics to spot the problem at the SKU level.
The three contribution margin layers (CM1, CM2, CM3) are unique to Amazon analytics because they reflect how the platform stacks fees. Most generic accounting tools can't separate these layers. That's why purpose-built tools like Nova's P&L analytics exist: they automatically break down 200+ cost lines into these exact contribution tiers.
What Advertising KPIs Drive Profitable Growth?
Advertising is the biggest controllable cost for most Amazon sellers. Getting these KPIs right is the difference between scaling profitably and just buying revenue. Tinuiti's marketplace advertising report shows that average CPCs have risen 12% year-over-year across major categories.
KPI
What It Measures
Benchmark by Category
ACoS
Ad spend / Ad revenue
15-30% (category-dependent)
TACoS
Ad spend / Total revenue
5-15% (most critical ad KPI)
ROAS
Ad revenue / Ad spend
3x-7x (varies by strategy)
CPC (Cost per Click)
Average click cost
$0.50-$2.50 (US average)
CTR (Click-Through Rate)
Clicks / Impressions
0.3-0.5% (SP average)
Ad Conversion Rate
Orders / Clicks (from ads)
8-15%
TACoS Is the One KPI That Rules Them All
ACoS tells you how efficient your campaigns are. TACoS tells you how efficient your business is. A falling TACoS with stable revenue means your organic sales are growing. That's the holy grail. Read our deep dive on TACoS explained for a complete breakdown. Nova's PPC analytics tracks TACoS at the product, brand, and portfolio levels.
Avg. CPC Increase YoY
+12%
Rising competition across categories
Ideal TACoS Range
5-15%
Mature products should target lower end
Avg. SP Conversion Rate
10%
Sponsored Products click-to-order
Which Inventory KPIs Prevent Costly Stockouts and Overstock?
Inventory mistakes are silent profit killers. Stock out for a week and you lose BSR momentum that takes months to rebuild. Overstock and you're paying $0.87+ per cubic foot per month in storage fees. According to Practical Ecommerce, excess inventory is the second most common profitability drain for FBA sellers.
KPI
What It Measures
Healthy Range
IPI Score
Inventory Performance Index
400+ (aim for 500+)
Days of Inventory
Inventory / Daily sell-through
30-90 days
Sell-Through Rate
Units sold / Units in stock
3-7 units/day per SKU (varies)
Stranded Inventory %
Unsellable units at FBA
<2%
Storage Cost per Unit
Monthly storage fees / Units
<$0.50/unit/month
Did You Know?
Amazon charges aged inventory surcharges on items stored over 181 days. At 271+ days, the surcharge jumps to $6.90 per cubic foot on top of regular storage fees. That single metric (days in storage) can turn a profitable SKU into a money pit. Track it using Nova's Products Feed alongside your IPI score optimization.
How Do Benchmarks Differ Across Amazon Categories?
Comparing your conversion rate to a global average is useless. A 10% conversion rate in Electronics is outstanding. In Health & Beauty, it's below average. Here's how the core KPIs stack up across major categories, based on aggregated industry data from Feedvisor and Profitero.
Category
Avg. Conversion Rate
Avg. ACoS
Avg. Return Rate
Typical CM2
Home & Kitchen
10-14%
18-25%
8-12%
18-24%
Health & Beauty
12-18%
15-22%
5-8%
20-28%
Electronics
3-6%
25-35%
15-20%
8-15%
Apparel
4-8%
20-30%
20-30%
10-18%
Consumables / Grocery
15-22%
10-18%
3-5%
15-22%
Toys & Games
8-12%
20-28%
10-15%
15-22%
Pet Supplies
12-16%
15-22%
5-8%
18-25%
Why Apparel and Electronics Deserve Special Attention
These two categories have the highest return rates (20-30% for apparel, 15-20% for electronics). Returns destroy CM3 margins because you eat the return shipping, potential restocking fees, and often the product can't be resold as new. If you sell in these categories, your return rate analytics should be a weekly review item.
What Operational KPIs Keep Your Account Healthy?
Amazon can suppress your listings or suspend your account if operational metrics slip. These KPIs aren't just nice to have. They're mandatory for survival on the platform.
Account Health Rating (AHR)
Amazon's composite score of your policy compliance. Target: 200+ (Good). Below 100 triggers account review. Check it daily in Seller Central. This score factors in Order Defect Rate, Late Shipment Rate (FBM), and policy violations.
Order Defect Rate (ODR)
Percentage of orders with negative feedback, A-to-Z claims, or chargebacks. Target: below 1%. Amazon's threshold is 1%, and exceeding it risks account suspension. FBA sellers typically run 0.1-0.3%.
Return Rate
Percentage of units returned. According to the National Retail Federation, online returns average 17.6% across e-commerce. Amazon-specific rates vary by category (see table above). Track this at the SKU level.
Max ODR Threshold
<1%
Exceeding triggers suspension risk
Avg. E-commerce Return Rate
17.6%
NRF 2024 consumer returns report
Target AHR Score
200+
"Good" standing on Amazon
Which Strategic KPIs Should Guide Long-Term Decisions?
These metrics don't change daily. But they shape the decisions that compound over months and years. Review them monthly, and they'll keep you from making expensive strategic mistakes.
KPI
What It Tells You
Benchmark
SKU Concentration
Revenue dependency on top SKUs
Top 3 SKUs <50% of revenue
New Product Success Rate
% of launches reaching profitability
40-60% (within 6 months)
LTV:CAC Ratio
Customer value vs acquisition cost
3:1 minimum
Brand vs. Generic Sales Mix
Brand search vs generic keyword sales
30%+ brand (strong brands)
Marketplace Diversification
Revenue from non-Amazon channels
10-30% from 2+ channels
Repeat Purchase Rate
Customers buying again within 12 mo.
15-30% (consumables higher)
Track SKU Concentration Before It Becomes a Problem
If your top 3 SKUs drive more than 50% of revenue, you've got a concentration risk. One stockout, one competitor launch, or one listing suppression could wipe out half your income. Nova's Winners & Losers and concentration analytics make this visible at a glance.
How Should You Set Up Your KPI Dashboard?
You don't need to track all 30 KPIs every day. The key is matching review frequency to the metric's volatility. Here's a practical framework.
Daily Review (5 minutes)
Revenue (gross and trend vs. Prior week)
Ad Spend (are campaigns running within budget?)
Buy Box % (any sudden drops?)
Account Health (any new policy violations?)
Weekly Review (30 minutes)
CM2 by SKU (which products are profitable?)
TACoS trend (improving or degrading?)
Conversion rate (any listing issues?)
IPI Score + Days of Inventory (restock decisions)
Return rate by ASIN (any spikes?)
Monthly Review (2 hours)
Full P&L (CM1/CM2/CM3 at portfolio level)
SKU concentration (portfolio diversification)
New launch performance (on track for profitability?)
Nova's Custom Analytics lets you build exactly this dashboard with drag-and-drop widgets. Set up your daily, weekly, and monthly views once, then just check them at the right cadence. Pair it with the weekly business review checklist for a structured review process.
What KPI Tracking Mistakes Kill Amazon Businesses?
Mistake #1: Tracking Revenue Without Contribution Margin
Revenue is vanity, profit is sanity. Revenue can grow while profit falls when CM2 is not tracked. Every dollar of revenue costs something. Know the cost.
Mistake #2: Comparing to Global Averages Instead of Category Benchmarks
Your 6% conversion rate isn't bad if you sell consumer electronics. It's actually above average. But if you sell consumables, 6% means your listing has serious problems. Always benchmark within your category.
Mistake #3: Ignoring Returns in Profitability Calculations
A product with 20% margins and 25% return rate actually has negative margins once you factor in return shipping, restocking, and unsellable inventory. Use CM3 (which includes returns) as your true profitability metric.
Mistake #4: Reviewing KPIs Monthly Instead of Weekly
Monthly reviews mean you discover problems 30 days too late. A listing suppression, a competitor undercut, or a PPC budget runaway can cost thousands before you notice it. Weekly reviews catch issues before they compound.