Knowing your CM1, CM2, and CM3 is step one. Using that data to make better pricing, advertising, and portfolio decisions is where profits come from. Learn the decision frameworks top sellers use.
Most Amazon sellers calculate contribution margins. Top 1% sellers act on them. The difference isn't data access. It's decision frameworks. You know your CM1, CM2, and CM3. Now learn when to raise prices, where to shift ad budgets, and which products to exit.
Here's the uncomfortable truth: contribution margin analysis means nothing without action triggers. A product sitting at 12% CM3 for 8 months? That's not insight. That's data paralysis. The sellers who grow consistently use CM data to make specific decisions: when to renegotiate supplier terms, how much ACoS they can sustain, and which products deserve exit.
This guide covers five decision frameworks you can apply this week. No theory. All action. If you need the formulas and definitions, check our Contribution Margin Calculator guide. This article assumes you understand CM1, CM2, and CM3. We're focused on what to do with those numbers.
Sellers Using CM Data
72%
Calculate margins. Only 18% have action frameworks.
Profit Lift After CM Optimization
23%
Average improvement with structured frameworks
Decision Frequency
Weekly
Top performers review CM data 4x more often
The CM Decision Matrix
Before diving into specific frameworks, you need a mental model for prioritizing CM-based decisions. This 2x2 matrix maps every product based on two dimensions: CM1 (product margin before advertising) and CM2 (margin after advertising).
High CM1, High CM2: Invest Mode
Your stars. These products have strong unit economics and efficient advertising. Scale PPC spend. Never run out of stock. Protect at all costs.
High CM1, Low CM2: Efficiency Opportunity
Strong product margin, but advertising is eating profits. Audit your PPC. Cut wasteful keywords. This is recoverable margin.
Low CM1, High CM2: Pricing Opportunity
Your ads are efficient, but the underlying product economics are weak. Test price increases. Demand may support higher margins.
Low CM1, Low CM2: Margin Trap
Weak product economics and inefficient ads. Immediate review required. Exit candidate unless dramatic fix is possible.
Use this matrix weekly when reviewing your portfolio. Nova's Winners & Losers dashboard automatically segments products by these quadrants, surfacing which products need attention.
Decision Framework #1: When to Raise Prices
Most sellers underprice their best products. They set prices based on competition, not margin targets. Here's the framework for identifying pricing power.
The Price Increase Formula
Raise prices when: CM1 > 45% AND review velocity stable for 90+ days AND no major competitive launches
Products with CM1 above 45% often have headroom for 10-15% price increases without meaningful velocity drops. Research shows that a 1% price increase can improve operating profit by 8-11% when volume remains stable.
How to identify underpriced products in Nova:
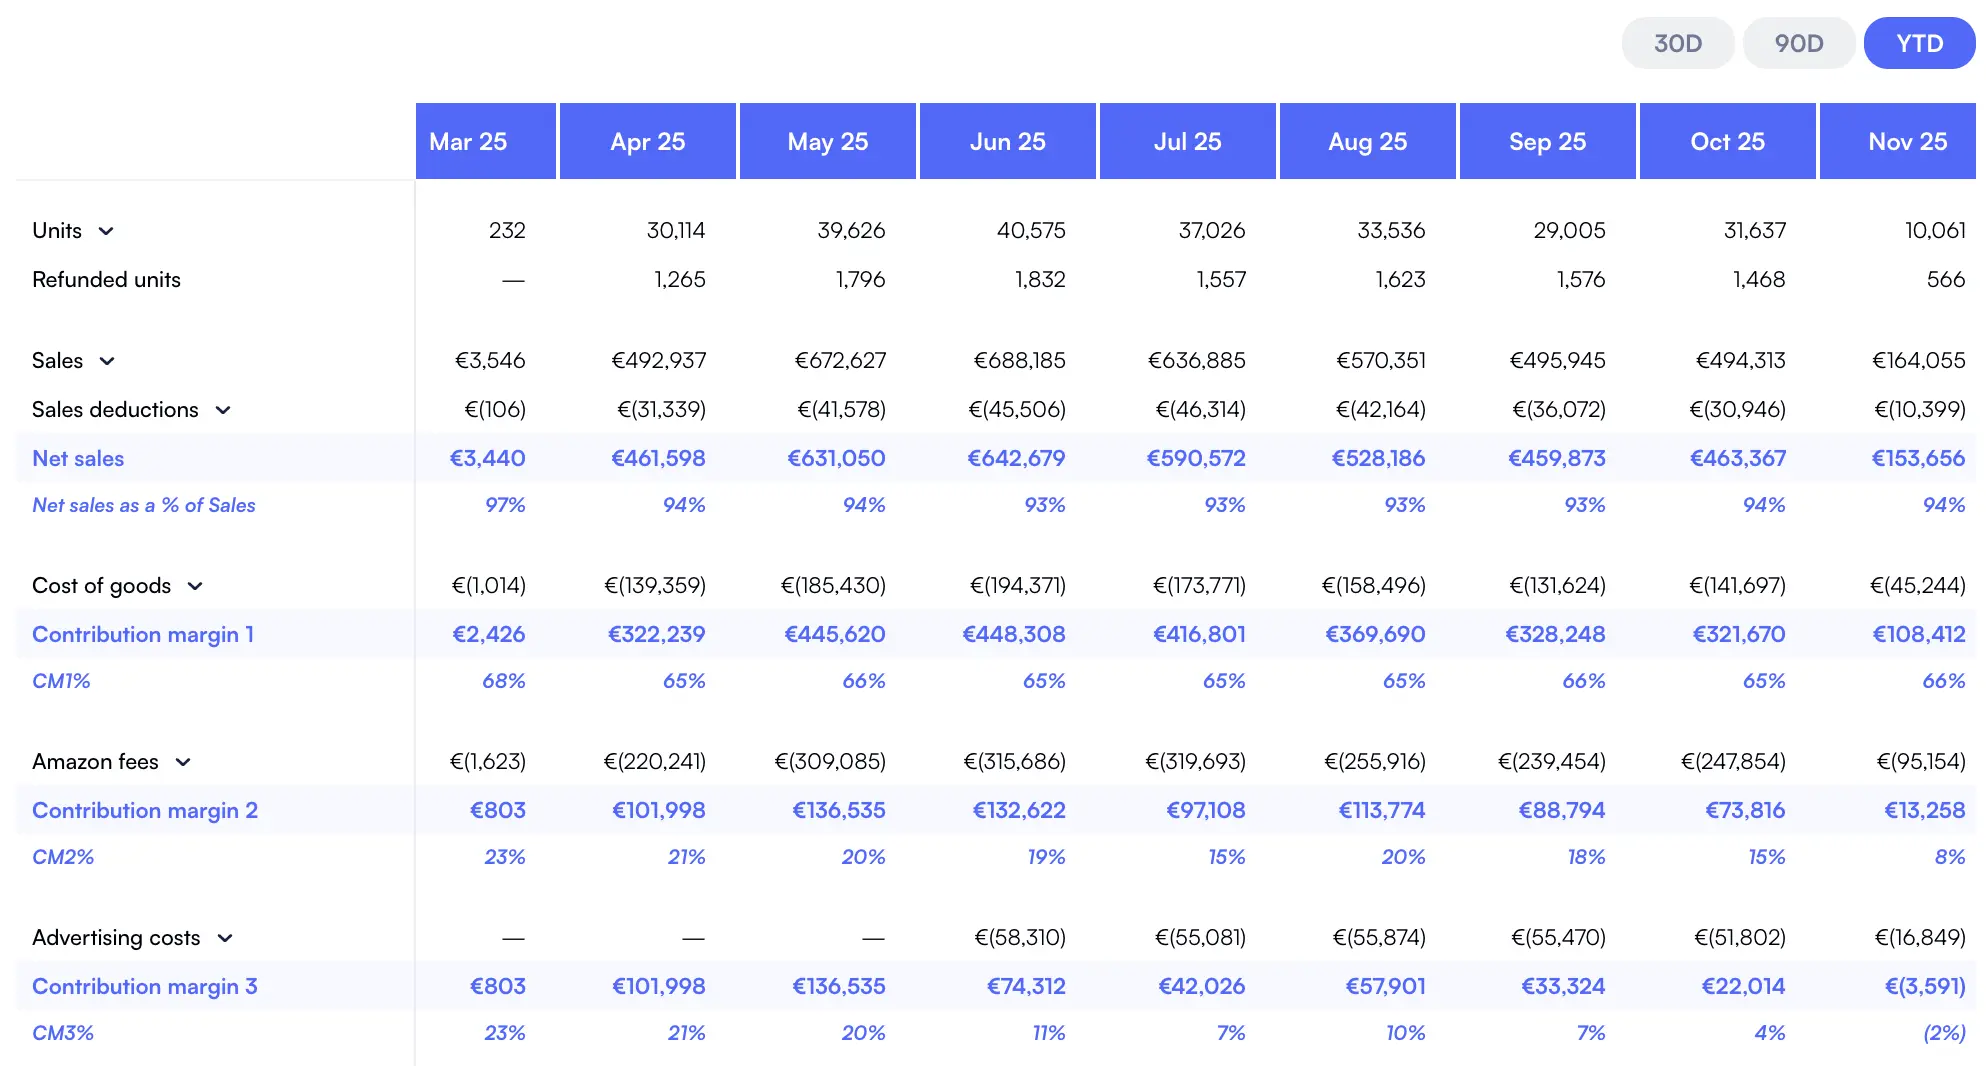
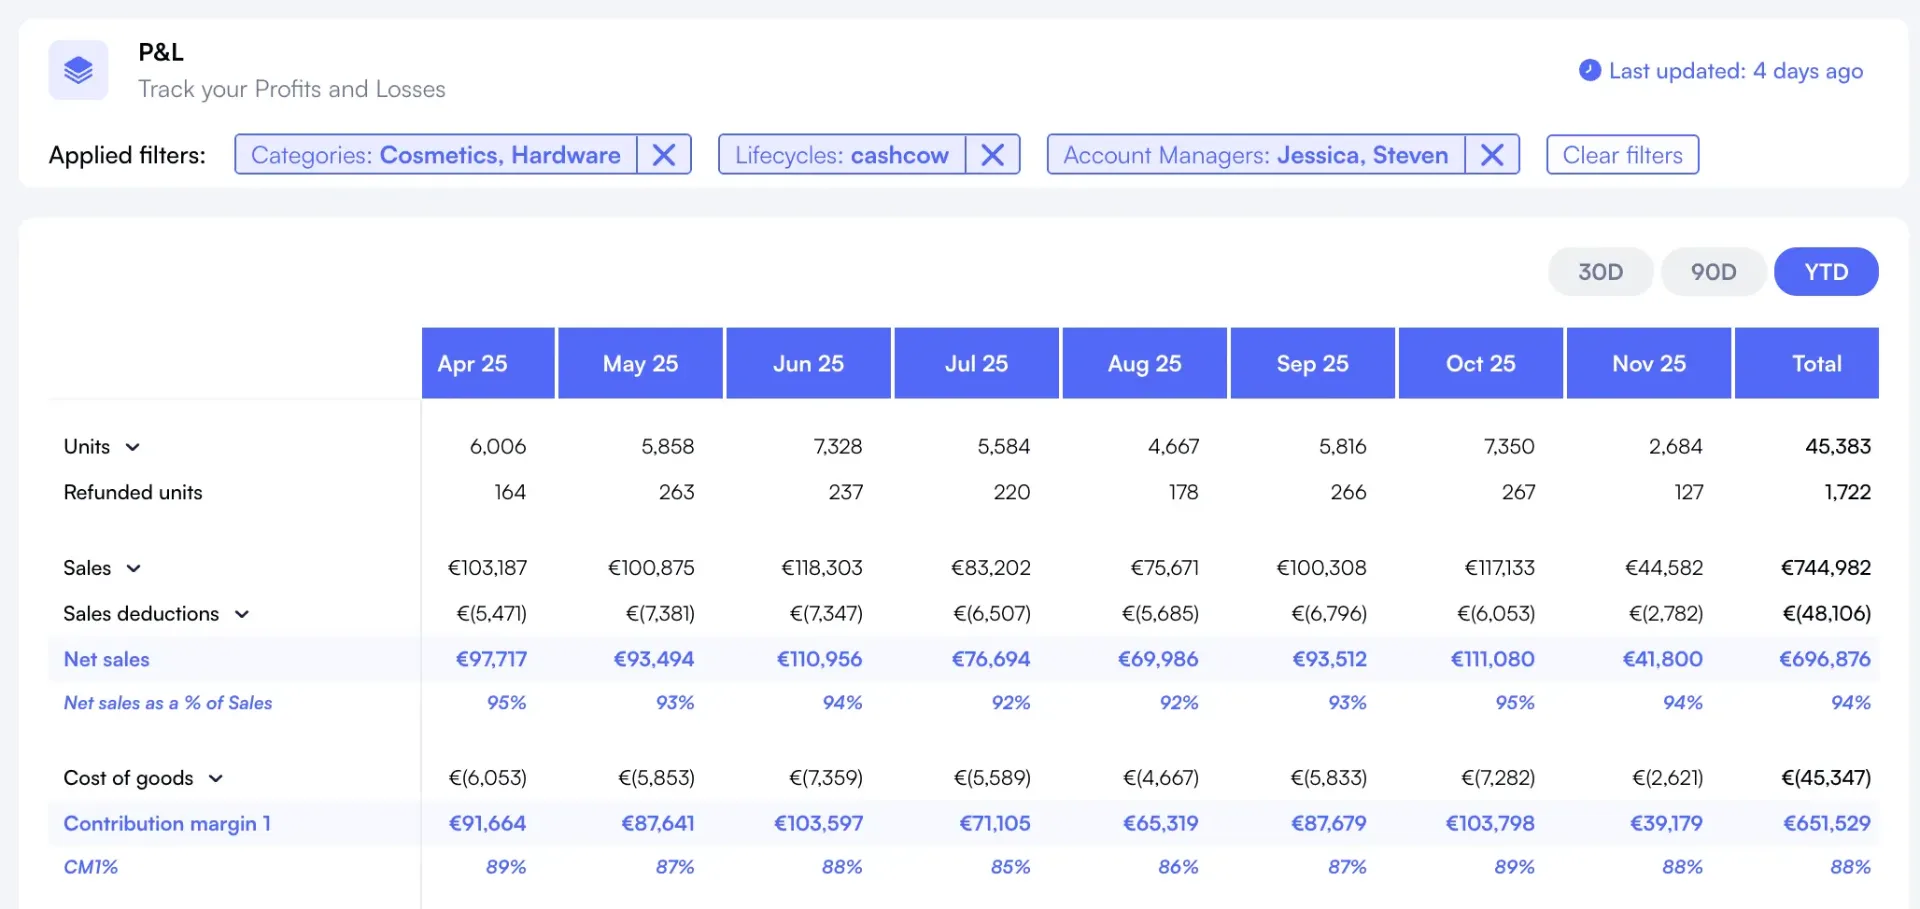
Step 1: Open your P&L Dashboard and sort by CM1 descending
Step 2: Filter to products with CM1 above 45%
Step 3: Cross-check velocity trends. Stable or growing units sold? Pricing candidate.
Step 4: Test a 5% increase. Monitor velocity for 14 days. If units drop less than 5%, you've found margin.
Nova P&L dashboard with CM columns showing pricing opportunity candidates
Pro Tip: Test Quietly First
Raise prices on a Monday morning when competitor monitoring is lightest. If velocity holds for 48 hours, the market accepted the increase. This approach minimizes competitive response risk.
Case Study: A kitchen accessories seller tested $29.99 to $34.99 on a silicone mat with 48% CM1. Units dropped 8% while revenue increased 9%. CM3 jumped from 16% to 22%. Net result: $4,200 more annual profit from one price change.
Your CM1 defines the maximum ACoS you can sustain without losing money on advertising. Most sellers violate this math constantly. They see a high-converting keyword and bid aggressively, ignoring the margin impact.
The CM1-to-ACoS Rule
Maximum Sustainable ACoS = CM1 - Target CM2
Example: 42% CM1, target 15% CM2 → Maximum ACoS is 27%. Any keyword running above 27% ACoS destroys margin on that product.
This formula gives you product-specific ACoS targets. A high-margin product can sustain higher ACoS. A thin-margin product needs aggressive ACoS limits. One-size-fits-all ACoS targets fail because they ignore unit economics.
Budget Reallocation Example
Product
CM1
Current ACoS
Max ACoS (15% CM2 Target)
Budget Action
Product A
48%
35%
33%
Reduce 25%
Product B
52%
18%
37%
Increase 40%
Product C
31%
25%
16%
Reduce 35%
Product B has headroom. Its ACoS is 18% but could go to 37% while maintaining your 15% CM2 target. Meanwhile, Product A and C are over their sustainable ACoS limits. That budget should move to Product B.
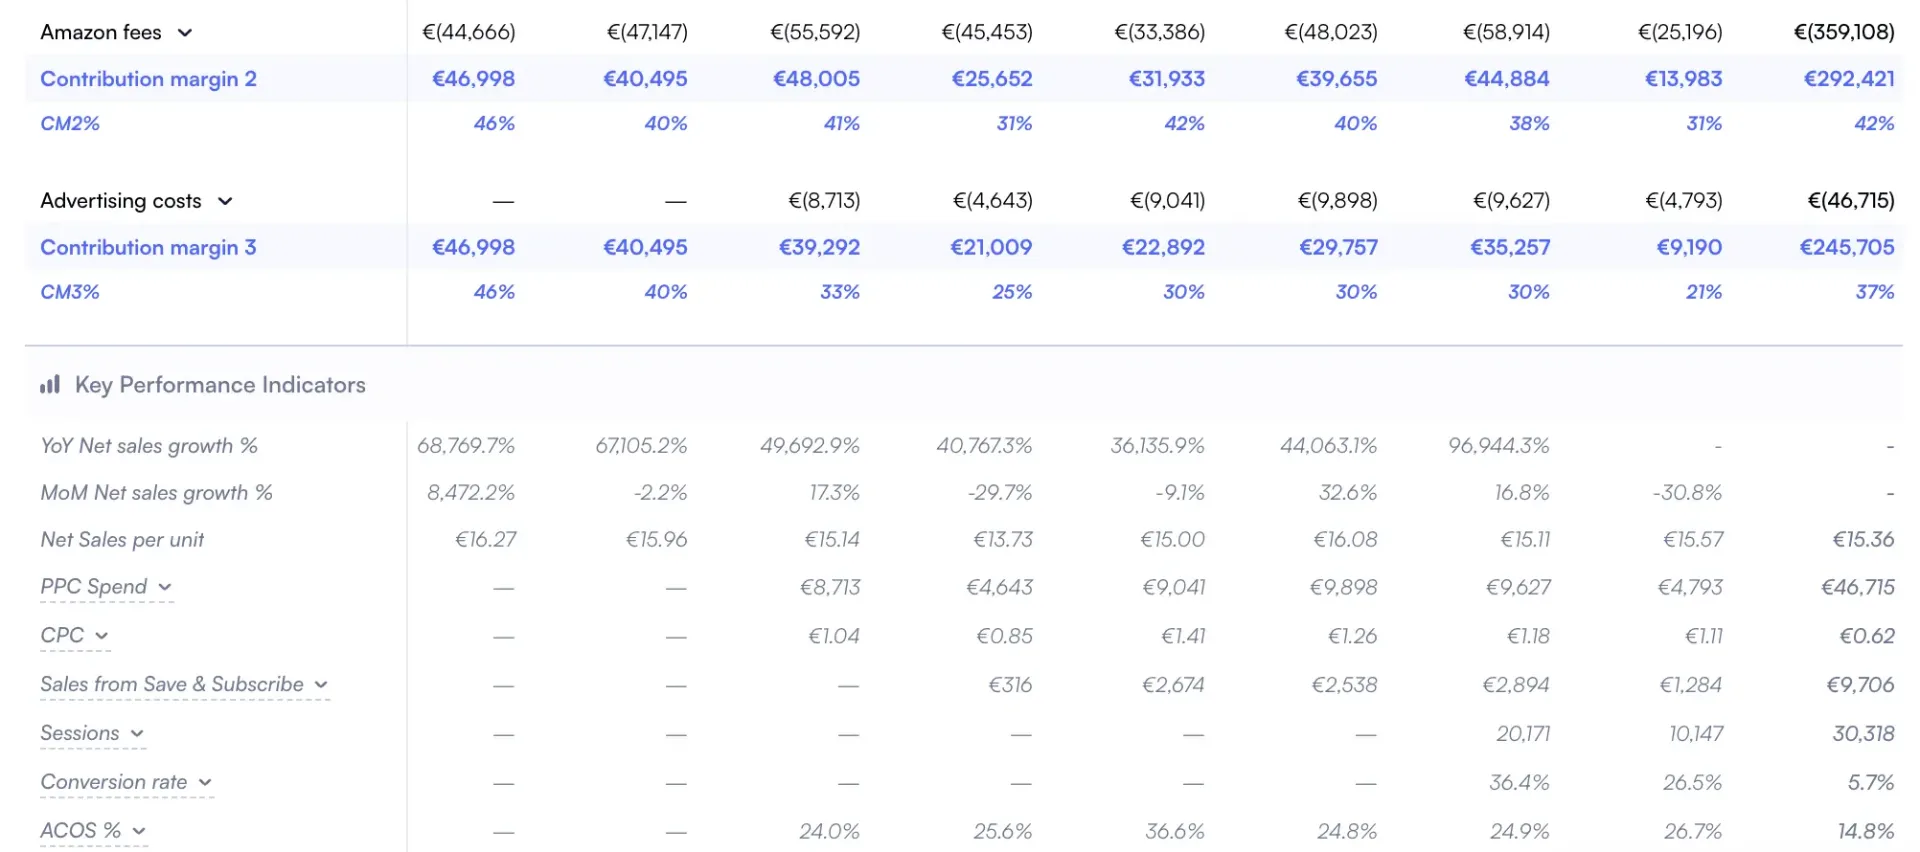
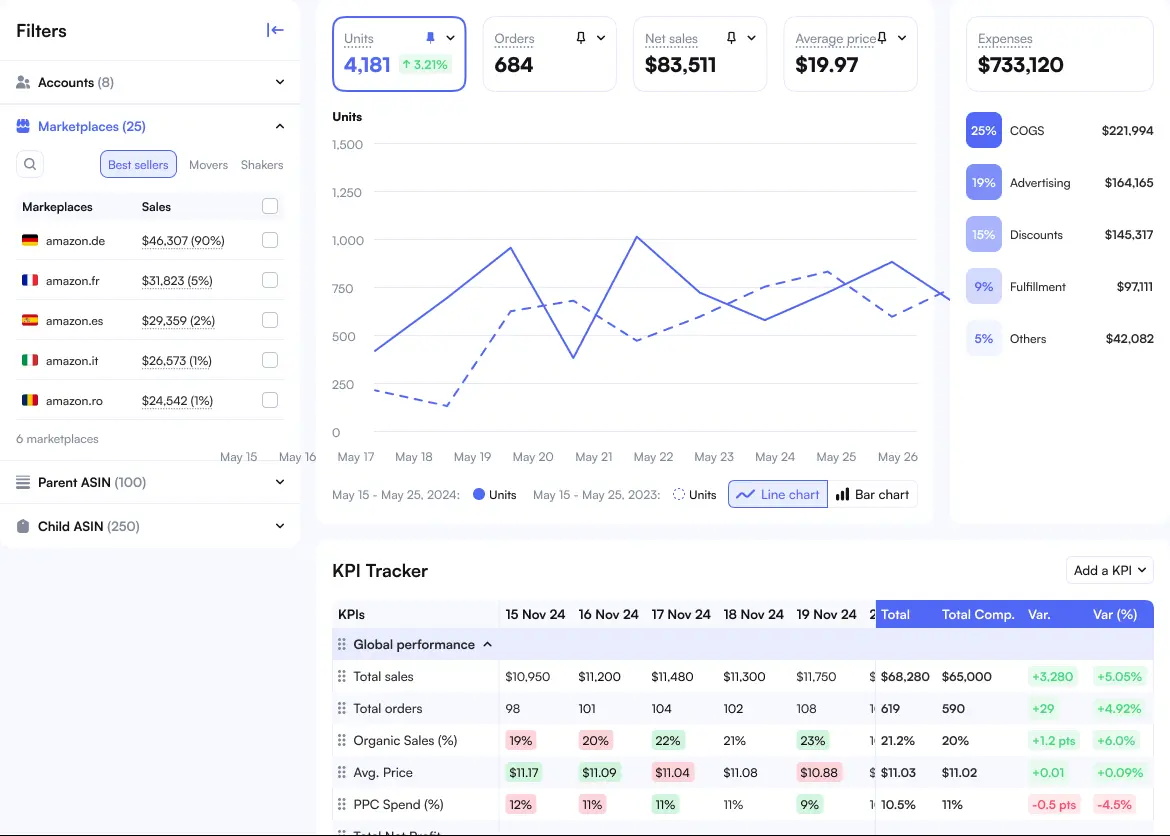
Integrated P&L and PPC metrics in Nova for advertising budget decisions
This reallocation process should happen monthly at minimum. Track PPC ROI per product to see exactly which ASINs deserve more budget and which are burning margin.
Decision Framework #3: Portfolio Rationalization
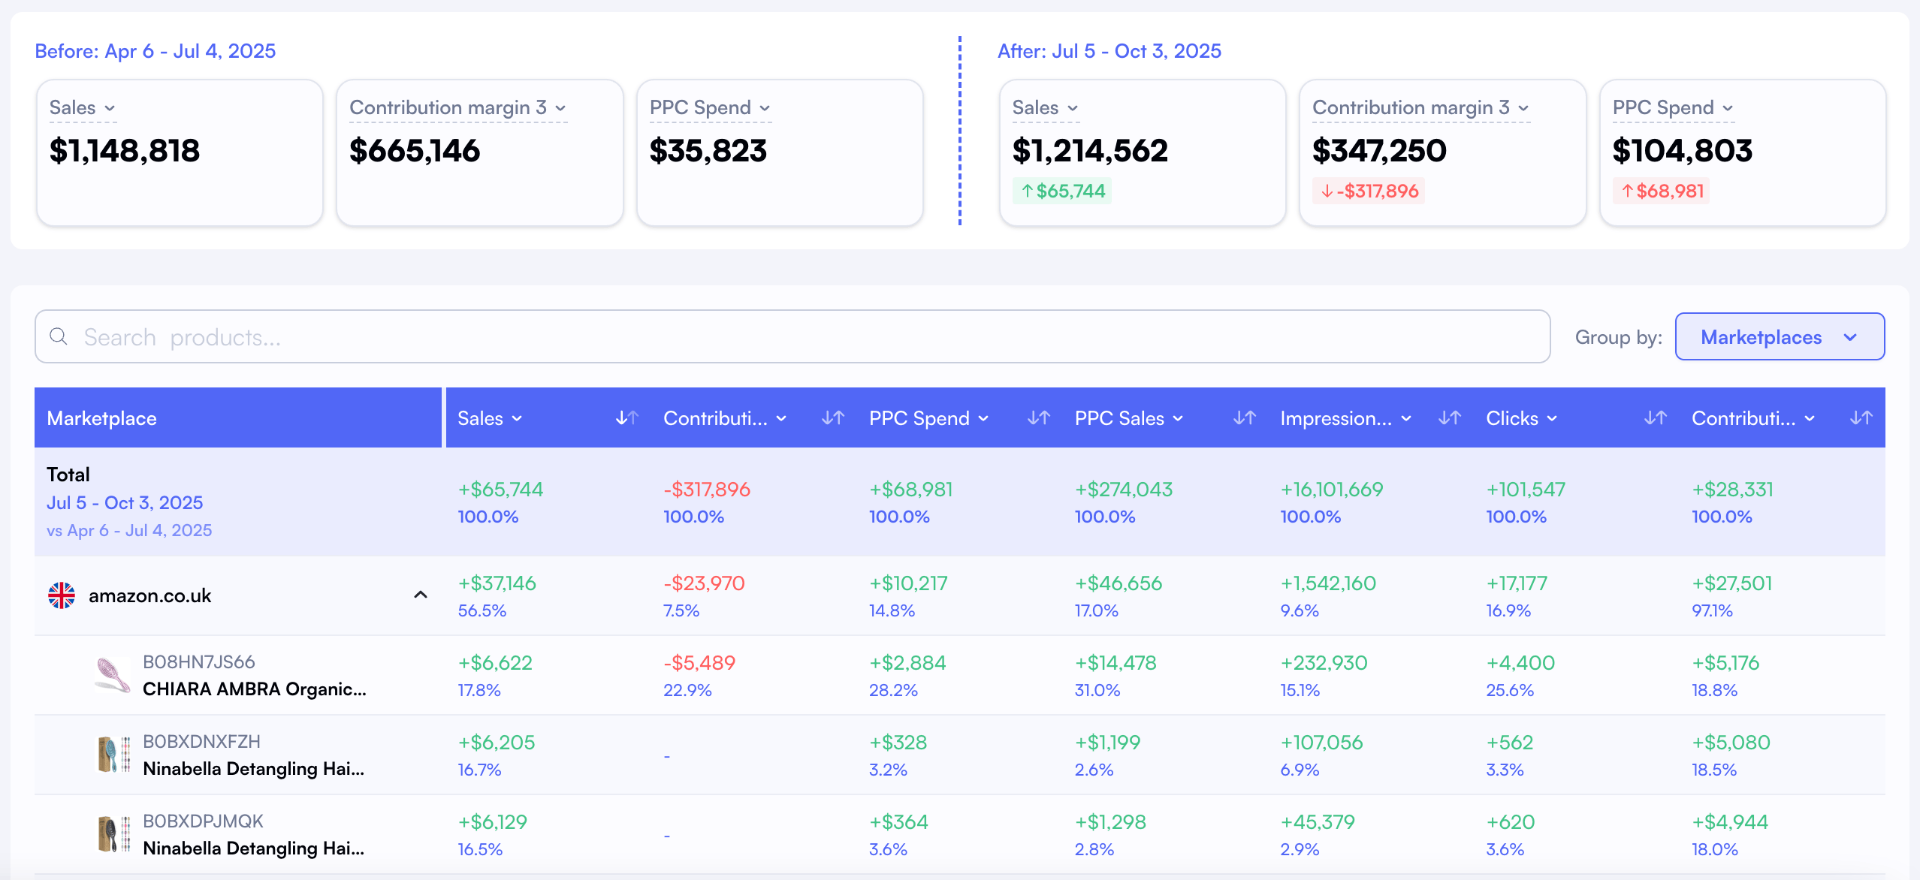
Every portfolio has SKUs that should exit. The question is when. CM3 provides the clearest signal because it includes all variable costs including storage, long-term storage, and advertising.
The CM3 Cut Line
Exit candidates: Products below 8% CM3 for 3 consecutive months
Immediate review: Products at 0% or negative CM3. These actively destroy capital.
Exception: New launches intentionally run negative CM2 during rank building. Exclude products launched within the past 90 days from this rule. They need time to mature.
Our full SKU Rationalization guide covers the complete exit process including liquidation strategies, bundling dead inventory, and calculating exit timing.
Winners & Losers dashboard in Nova showing CM3-based portfolio analysis
The Hidden Cost of Delay
Sellers hold onto negative-CM3 products hoping for turnaround. The math punishes this behavior. A product at negative 5% CM3 doing $3,000/month in revenue costs you $150/month in margin destruction, plus storage fees, plus opportunity cost of that capital. According to Investopedia, contribution margin analysis should drive these exit decisions, not emotional attachment.
Decision Framework #4: Promotion Strategy
Promotions destroy more margin than most sellers realize. The math is simple but frequently ignored. A 10% coupon requires a 12% volume increase just to break even on gross margin. Factor in the higher return rates on promotional purchases, and the required volume increase climbs to 15%.
The Promotion Viability Rule
Never run a Lightning Deal or coupon on a product with CM2 below 20%. The margin destruction is virtually unrecoverable unless you're strategically building rank for a new launch.
Before running any promotion, calculate the break-even volume increase:
Discount
Required Volume Increase (Break-Even)
With 15% Higher Return Rate
5%
5.3%
7.1%
10%
11.1%
14.8%
15%
17.6%
23.5%
20%
25%
33.3%
Use Day-to-Day Performance tracking to monitor CM3 during and after promotions. If CM3 goes negative during the promotion window, you're funding customer acquisition at your own expense.
CM1 compression signals upstream cost problems. When your CM1 drops while selling prices remain stable, your COGS or fulfillment costs are climbing. This is the trigger for supplier conversations.
The Negotiation Trigger
5-point CM1 drop over 3 months → Schedule supplier call within 2 weeks
A CM1 sliding from 42% to 37% means $5 of margin disappeared per $100 in revenue. On a product doing $50K/month, that's $2,500 monthly margin loss. Act quickly.
How to calculate the target COGS for negotiation:
Step 1: Identify your target CM1 (historical average or category benchmark)
Step 3: the gap between current COGS and target COGS is your negotiation objective
If your supplier won't negotiate, consider alternatives: product redesign for lower fulfillment fees, packaging optimization, or supplier diversification. Single-supplier dependency creates both cost and resilience risks.
Setting Up CM Tracking in Nova
These frameworks only work with accurate, timely CM data. Here's the setup workflow in Nova to operationalize contribution margin tracking:
Step 1: Configure COGS in Cost Manager
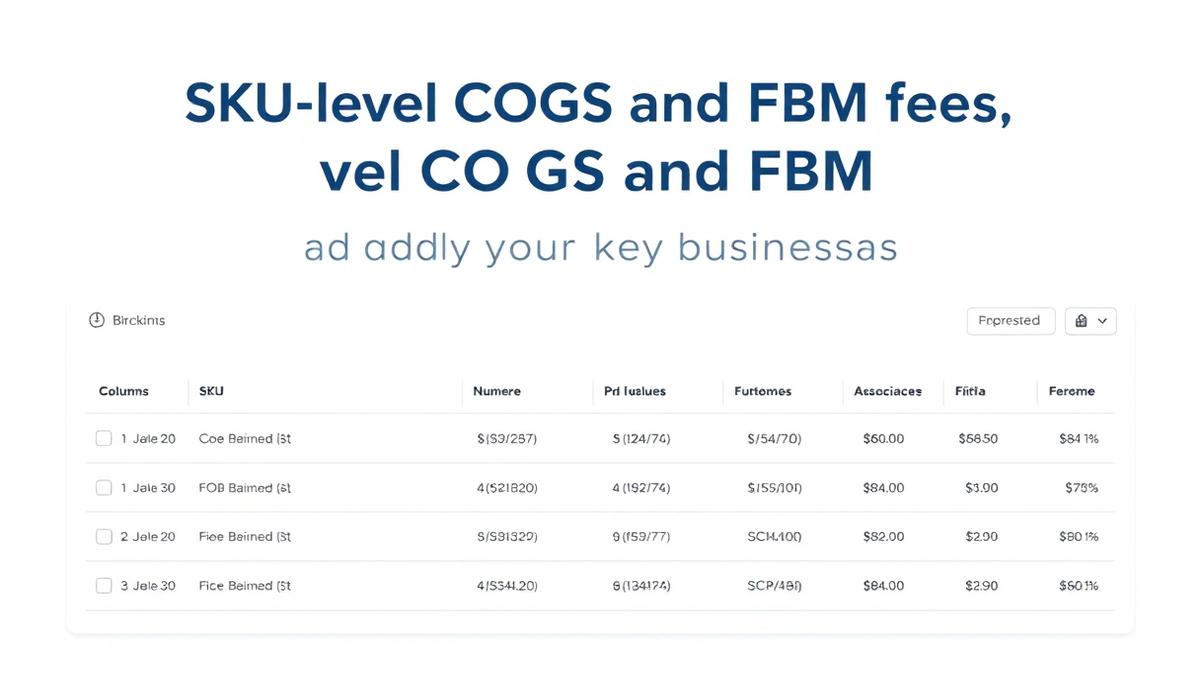
Your CM1 calculation depends on accurate product costs. Nova's cost manager lets you bulk upload COGS by SKU, set effective dates for cost changes, and handle multi-currency sourcing.
COGS management in Nova with effective date tracking
Step 2: Create CM-Based Product Segments with Smart Tags
Custom Breakdowns lets you group products by CM tier. Create tags like "High CM (>30%)", "Medium CM (15-30%)", and "Low CM (<15%)". These segments flow through all dashboards.
Custom Breakdowns for CM-based portfolio segmentation
Step 3: Establish Weekly CM Review Routine
Create a weekly review routine. Sort your P&L dashboard by CM2 or CM3 ascending to surface your weakest products first. Products below 15% CM2 or 10% CM3 need immediate attention. This catches margin compression before it compounds.
Step 4: Schedule Weekly CM Reviews
Use Day-to-Day Performance for quick daily checks, and the full P&L dashboard for weekly deep dives. Block 45 minutes weekly to review CM trends and apply the decision frameworks above.
Day-to-Day Performance for daily CM monitoring
Common CM Optimization Mistakes
Even sellers with good CM data make avoidable errors. Here's what NOT to do:
❌ Cutting All Low-CM3 Products
Some products serve strategic purposes. A "gateway product" that brings customers into your brand might have 5% CM3 but generate 40% of first-time buyers. Evaluate products in context, not isolation.
❌ Ignoring CM2 During Launches
New product launches intentionally run aggressive PPC to build rank. Negative CM2 is expected and budgeted. The mistake is not tracking when that investment should shift to profitability mode. Set a 90-day review trigger for launches.
❌ Using CM Targets From Other Categories
A healthy CM3 in Electronics (12%) looks disastrous in Supplements (where 25%+ is normal). Category benchmarks matter. According to Deloitte's retail research, category-specific margin analysis outperforms generic targets by 3x in decision accuracy.
❌ Over-Optimizing for CM3 at Expense of Growth
Maximum CM3 means zero growth spending. At some point, you're optimizing a shrinking business. Balance margin optimization with sustainable growth investment. Target 15-20% of revenue for growth initiatives.
Frequently Asked Questions
Common questions about contribution margin optimization
Weekly for tactical decisions, monthly for strategic ones. Your highest-impact products warrant daily monitoring, while long-tail SKUs can follow a bi-weekly review. Review your P&L dashboard with CM columns visible and sort by lowest margin first. This catches problems before they compound.
CM2 is critical for advertising decisions since it shows margin after ad spend. CM3 matters for portfolio decisions since it includes storage and other variable costs. For PPC budget allocation, focus on CM2. For keep-or-kill decisions, CM3 tells the full story.
ASIN level for most decisions, but SKU level when variations have different costs. A Large variant with higher COGS needs separate CM tracking from a Small variant. Nova tracks both levels, letting you aggregate up or drill down as needed.
Compare CM trends year-over-year, not month-over-month. A 15% CM3 drop in January might look concerning until you realize it happens every January due to post-holiday competition. Use rolling 12-month averages for exit decisions on seasonal products.
Three alternatives exist: redesign packaging to reduce fulfillment fees, optimize your PPC to improve CM2, or raise prices. If none of those work and CM3 stays negative for 6+ months, that's a clear exit signal. Some products simply don't work economically.
Turn CM Data Into Decisions This Week
Contribution margin data becomes valuable when you act on it. Start with one framework this week. For most sellers, the advertising budget reallocation (Framework #2) delivers the fastest wins since it requires no price changes or supplier negotiations.
Your action plan:
Today: Calculate your max sustainable ACoS per product using the CM1-to-ACoS rule
This week: Reallocate 20% of budget from over-ACoS products to under-ACoS products
This month: Apply the CM Decision Matrix to your full portfolio
Ongoing: Review CM trends weekly using the frameworks above