
Amazon Subscribe & Save Report - Analytics Guide for FBA Sellers
The Seller Central Subscribe & Save report leaves out contribution margin, cross-marketplace views, and refund-adjusted revenue. This guide covers the report structure, the three analytics questions worth answering, and the quarterly pruning rule that keeps the mix healthy.
 Claude
 Gemini
 ChatGPT
The Seller Central Subscribe & Save report tells you how many active subscribers you have and what they bought. It does not tell you the contribution margin per S&S order, the S&S share of an ASIN's total sales, or how the program is trending across marketplaces. This guide covers what the report actually contains, the three analytics questions worth answering, and the quarterly pruning rule that keeps the mix healthy. For the profitability side of the same question, the companion post on Subscribe & Save profitability goes deep on tier economics and category fit.
TL;DR - Key Takeaways
- •The S&S report in Seller Central lists forecasted deliveries, active subscribers, and historical S&S sales. Contribution margin, mix share and cross-marketplace views are not in it.
- •Only three analytics questions matter for reporting: is S&S growing as a share of sales, is the active-subscriber count compounding, and which ASINs are pulling the mix.
- •Subscribers-per-active-SKU is the health ratio to watch. A brand with 500 subscribers across 5 SKUs is meaningfully healthier than 500 across 40.
- •Nova surfaces the three S&S data points alongside contribution margin and PPC in one view across all 23 marketplaces, so pruning decisions do not require a spreadsheet join.
- •Set the pruning rule before you enroll anything: if margin is under the floor for two quarters, or net subscribers are flat for six months, the SKU comes out.
Our take
If you only do one thing this quarter
Pull the Seller Central S&S Forecasting and Performance report, join it against your Business Report, and compute two numbers per top-20 ASIN: S&S share of that ASIN's total sales, and net subscriber change over the last 90 days. The pair tells you which SKUs to double down on and which to prune, and it takes about 45 minutes in a sheet. Nova ships the join by default across every connected marketplace.
Best fit if
- •Brand operators running S&S on 5 or more consumable ASINs
- •Analysts who reconcile Amazon revenue and want S&S mix visible in the same view
- •Multi-brand operators who need per-brand S&S mix across a portfolio
Skip if
- •Sellers still deciding whether to enroll their first S&S SKU (start with the profitability guide instead)
- •Sellers with no consumable or replenishable ASINs in the catalog
What the Seller Central S&S report actually contains
Amazon publishes S&S data through the Subscribe & Save Forecasting and Performance report, under Reports, Fulfillment. Three views ship in the file: upcoming scheduled deliveries by ASIN and week, current active-subscriber count per ASIN, and historical S&S sales over a rolling window. That is useful, and it is also the ceiling of what Seller Central gives you without a join.
What is missing from the report:
- Contribution margin per S&S order. The report has S&S revenue but no fees, no promo cost, no COGS. Margin lives in the settlement and finance reports and has to be joined in.
- S&S share of total ASIN sales. The report shows S&S revenue in isolation. The share number (S&S revenue over that ASIN's total revenue) requires the Business Report as a second source.
- Cross-marketplace view. Each marketplace ships its own S&S report. There is no unified file across marketplaces even if the same ASIN sells in five countries.
- Refund-adjusted subscriber revenue. Cancelled deliveries and refunds show up in settlements, not in the S&S report.
- Subscriber cohort or tenure detail. Amazon does not expose which subscribers signed up when, so tenure and churn cohorts are not reconstructable from Seller Central data alone.
Nova insight
The gap most sellers hit first is the join. Building "S&S as a percentage of total ASIN sales" in a spreadsheet works for 10 SKUs; at 100 SKUs across three marketplaces it becomes a weekly chore, and the number is stale by the time the sheet is refreshed. Get the mix number in the same view as contribution margin from day one, and the pruning decision becomes a 5-minute review instead of a project.
The three analytics questions worth answering
Most S&S reporting is noise. Three questions do the actual work:
- Is S&S growing as a share of total sales. If S&S is 8% of revenue this month and 5% six months ago, the program is doing what it should. If it is flat or shrinking despite steady enrollment, the discount is not converting into recurring behavior.
- Is the active-subscriber count compounding. New signups minus cancellations equals net subscriber growth. Watch the net, not the gross. A rising cancel rate on a specific ASIN is usually a product problem (formulation change, quality drift, shipping damage) that shows up in reviews a month later.
- Which ASINs are pulling the mix. A healthy S&S program has 3 to 8 SKUs doing 70%+ of subscriber volume. If the top S&S ASIN is one you would rather not lock into a discount tier (a hero SKU that already sells at full price), that is a signal to prune, not scale.
Related read
The profitability side: is S&S actually worth it for your catalog
Subscribers per active SKU is the health ratio
Absolute subscriber counts are vanity. The ratio that predicts whether the program is healthy or drifting is subscribers per active S&S SKU: total active subscribers divided by the count of ASINs enrolled and receiving at least one delivery per month. A brand with 500 subscribers across 5 SKUs (ratio: 100) has real product-market fit on a small set. A brand with 500 subscribers across 40 SKUs (ratio: 12) is subsidising a long tail of enrolled ASINs that will never build a real subscriber base. Same subscriber count, very different health.
The pruning decision follows from the ratio. When the ratio drops below your portfolio benchmark two quarters in a row, the fix is not more enrollment; it is unenrolling the ASINs that never took. Concentration is the health signal, not spread.
What Nova surfaces for Subscribe & Save
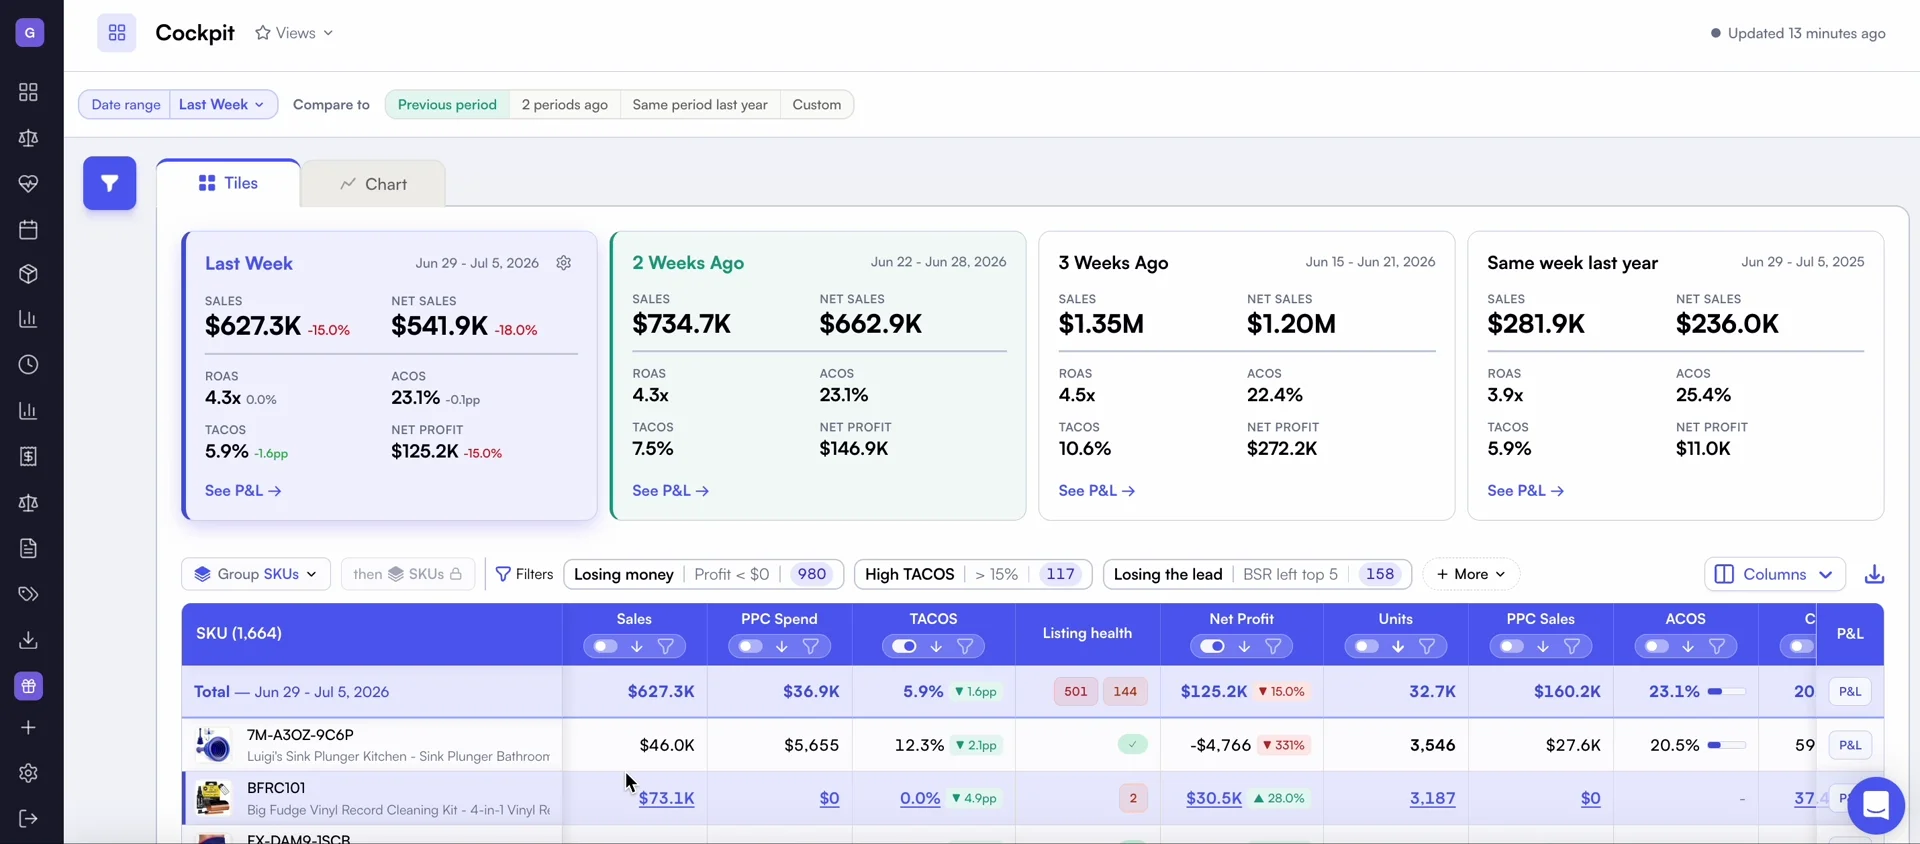
Nova reports three S&S data points on every dashboard where they are relevant:
- S&S sales in the selected period. The gross revenue attributed to S&S orders, per SKU, per marketplace.
- S&S as a percentage of total sales. The mix number that tells you whether the program is growing, shrinking, or flat.
- Active subscribers. The current subscriber count per ASIN, so net growth is visible week over week.
Nova deliberately does not model tenure cohorts, churn curves, or subscription CLV; that analysis needs cohort-level data that Seller Central does not expose, and rebuilding it in a dashboard adds noise without adding accuracy. What Nova does do is put S&S mix and subscriber count in the same view as contribution margin, promo cost, and FBA fees, so the pruning decision is a review instead of a research project. Use Custom Breakdowns to segment S&S performance by brand or product line, and the S&S profitability guide to set the per-portfolio contribution floor that decides enrollment in the first place.
See your Subscribe & Save mix without the spreadsheet join
Nova surfaces S&S sales, mix percentage, and active subscribers per ASIN, alongside contribution margin. 14-day free trial, no card.
Reporting playbook: monitor, review, prune
A quarterly S&S review takes about 90 minutes and prevents the mix from silently rotting.
Monitor
Weekly: S&S mix per top-20 SKU and net subscriber change. Monthly: subscribers per active S&S SKU (health ratio). Quarterly: full contribution-margin review with the pruning decision below. See the daily dashboard metrics guide for the surrounding set of numbers most brand operators keep in view.
Review
Rank enrolled ASINs by S&S share of that ASIN's total sales, descending. The top decile is the program. The bottom decile is usually the pruning candidate: enrolled, discounted, and doing under 3% of that ASIN's revenue as S&S. Cross-reference each pruning candidate against the review trend and BSR for the last 90 days; if reviews are declining and BSR is drifting, the product is the problem, not the program.
Prune
Any ASIN where S&S contribution margin is under your floor for two consecutive quarters, or where subscribers are flat or falling despite the discount, comes out. Pause enrollment (do not delist); the ASIN stays live at full price and one-time buyers rebuild the baseline. Revisit in a quarter with fresh data.
Common reporting mistakes that mask margin leaks
- Reading subscriber count as a locked contract. Shoppers can cancel in two clicks, and the FTC negative-option rule makes easy cancellation a baseline. Watch net change, not cumulative signups.
- Reporting S&S revenue without S&S share. A rising S&S revenue line during a rising overall sales trend can hide a shrinking S&S share. Always report both.
- Ignoring subscribers-per-SKU. A brand with 40 enrolled SKUs and 500 subscribers is paying the discount on 35 ASINs that will never contribute meaningfully.
- Never revisiting the mix. S&S is a compounding decision. A quarter without a pruning review usually costs more than the review itself.
- Reporting one marketplace at a time. Seller Central splits S&S reports per country. A single ASIN that runs in the US, UK and Germany needs the three files joined before the trend line means anything.
Pruning rule
Write the pruning rule down before you enroll anything: "If an S&S SKU has contribution margin under X for two consecutive quarters, or net subscriber change is flat or negative for six months, it comes out of the program." Operators who set this rule up front prune quarterly. Operators who do not accumulate a long tail of enrolled ASINs that quietly compound margin loss for years.
Where this connects in the wider Nova stack
The S&S mix is one of the three levers in the consumables playbook, alongside pricing strategy and PPC ROI per product. If S&S share is rising, PPC per unit typically falls (recurring orders are organic by definition), which changes the true blended ACoS on the SKU. Cross-reference the two reports every quarter and adjust ad budget at the SKU level accordingly. For the monthly finance view once the S&S program is running, the monthly P&L template is the format most brand-finance teams standardize on.
Frequently asked questions
The bottom line
The Seller Central S&S report is a start, not a system. Join it against total ASIN sales and settlement fees, watch three numbers (mix share, net subscribers, subscribers per active SKU), and prune quarterly. Do that and S&S compounds. Skip the review and it silently thins margin on every subscription that renews.
Ready to Transform Your Amazon Business?
Join thousands of successful sellers who use Nova Analytics to make data-driven decisions and maximize their profits.
Continue Learning
Explore more expert insights to grow your Amazon business
Amazon Settlement Report - How to Read and Reconcile It in 2026
The settlement report is the only Seller Central file that lists every order, refund, fee, and adjustment as a separate row. This guide covers what is inside a cycle, the six columns that matter, the reconciliation mistakes that overstate margin, and how to roll settlements up into a clean monthly P&L.
Subscribe & Save profitability
Amazon reports Subscribe & Save through three metrics on purpose: S&S sales, share of total, and active subscriber count. Here is how to read them and grow recurring revenue without over-discounting.
Best Amazon Inventory Management Tools 2026
Compare SoStocked, RestockPro, InventoryLab, Forecastly, and more. Which inventory tool fits your business: forecasting, profit analytics, or restock automation?