
Amazon PPC tool: spot where ad spend bleeds
The Amazon PPC tool that connects ad spend to real profit. Parent ASIN attribution with SKU-level TACoS, ACoS and ROAS in one view, refreshed hourly.
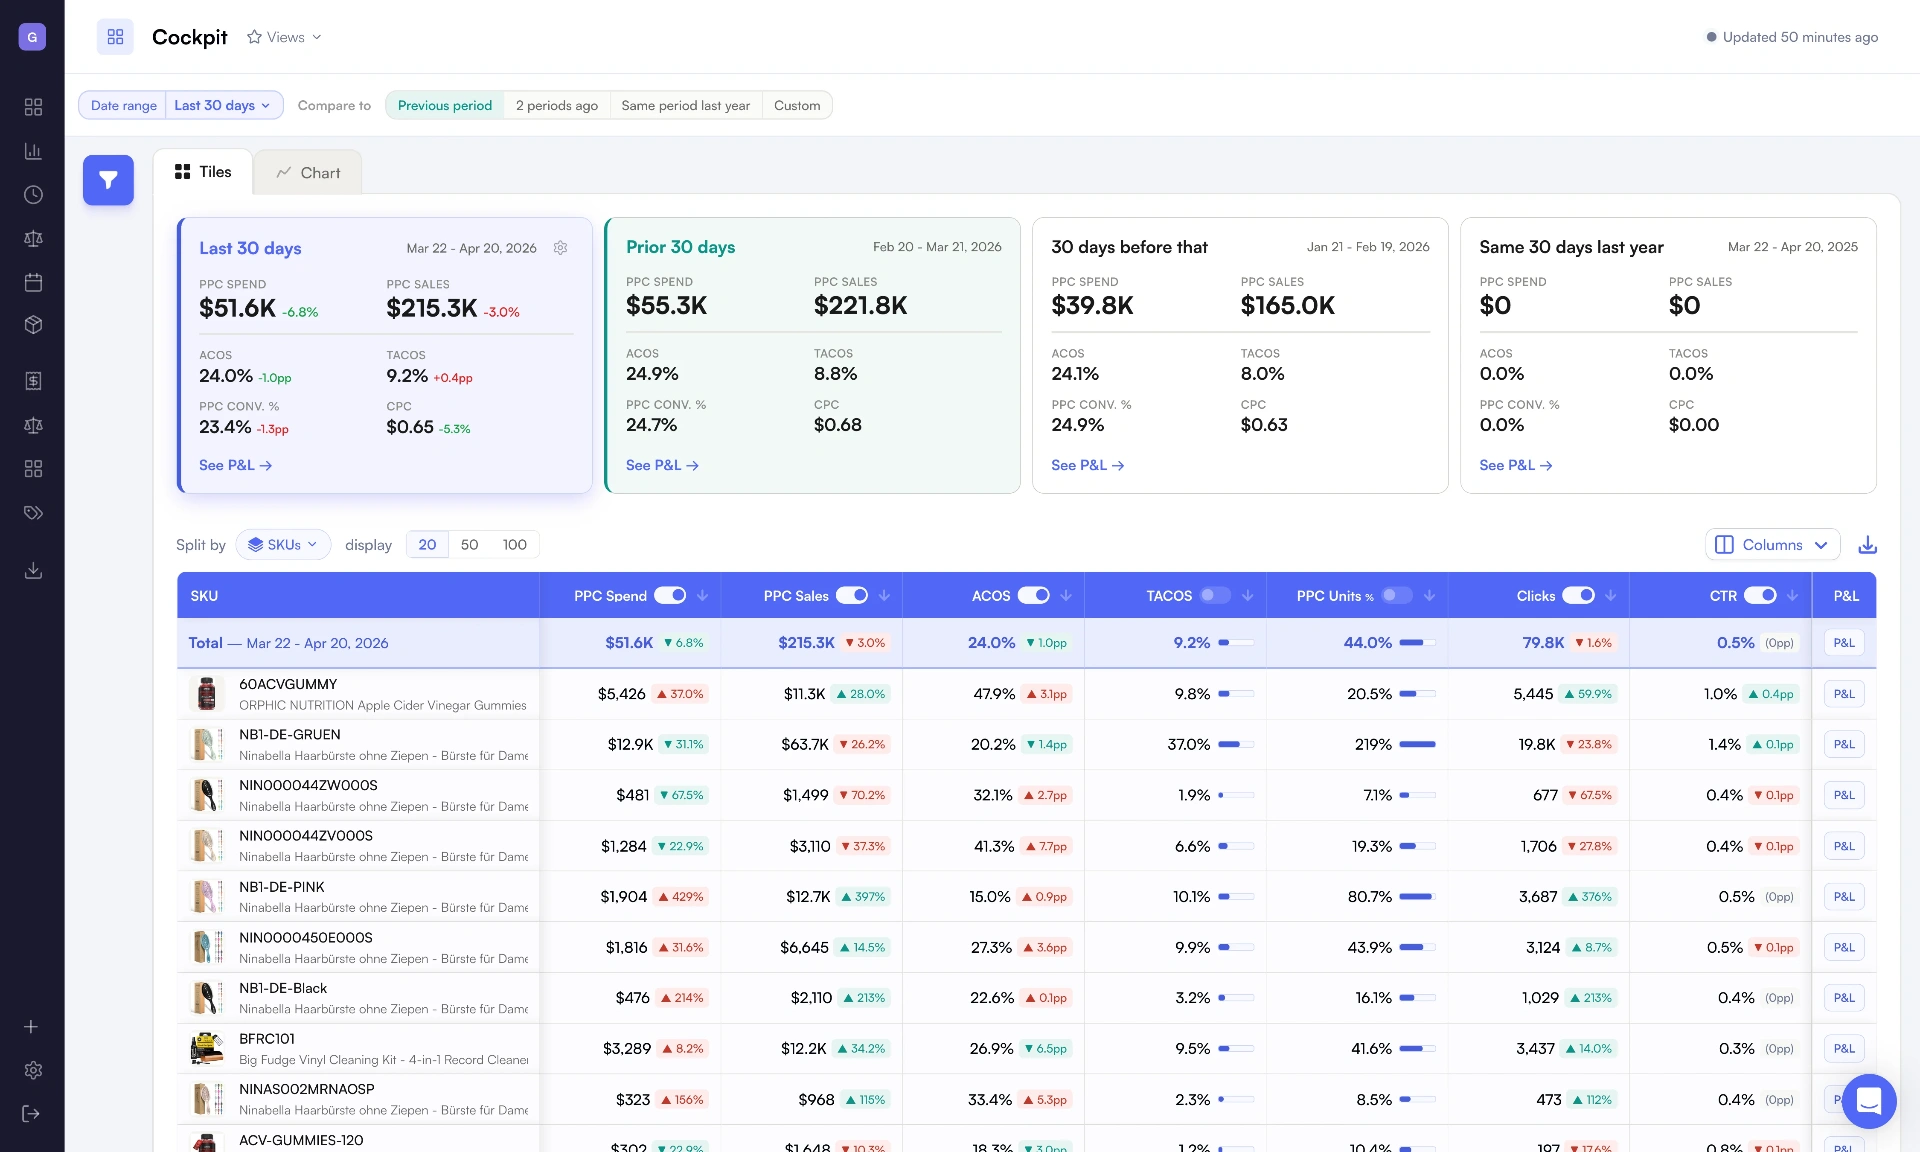
Drill down by product
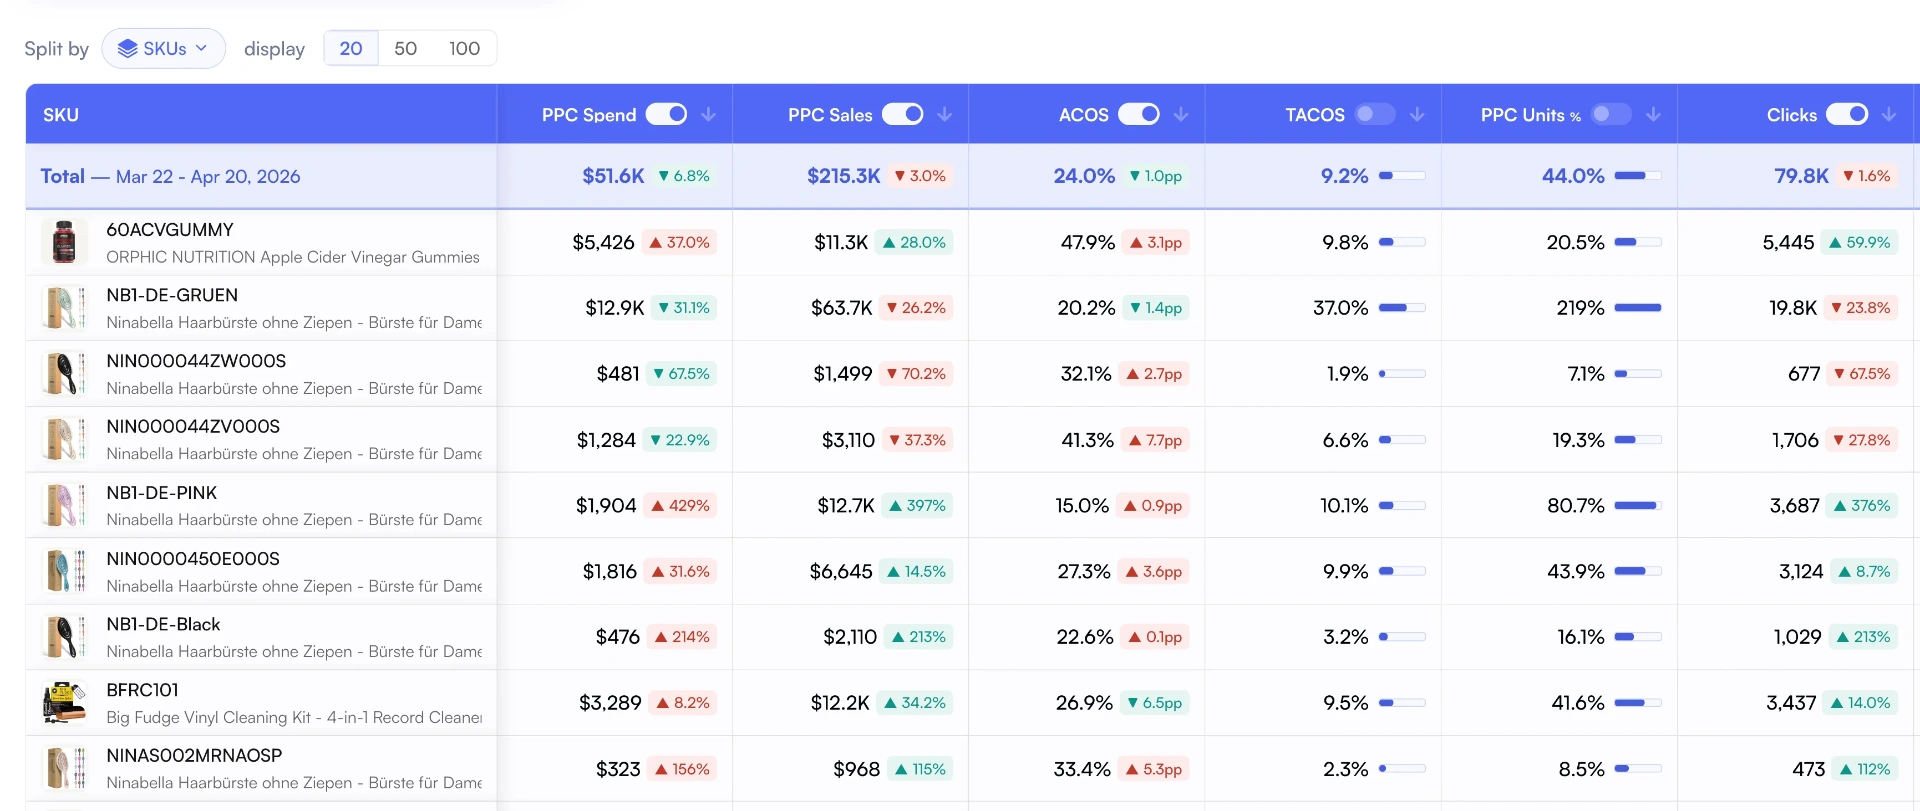
See every ASIN's PPC Sales, Impressions, CTR, TACoS% and ACoS% in one table
PPC Sales & Spend
Track exactly how much each product earns and costs in advertising.
Impressions & CTR
Spot products with high impressions but low clicks. Fix them before they drain budget.
TACoS% & ACoS%
The metrics that matter. See which ASINs are profitable and which ones bleed.
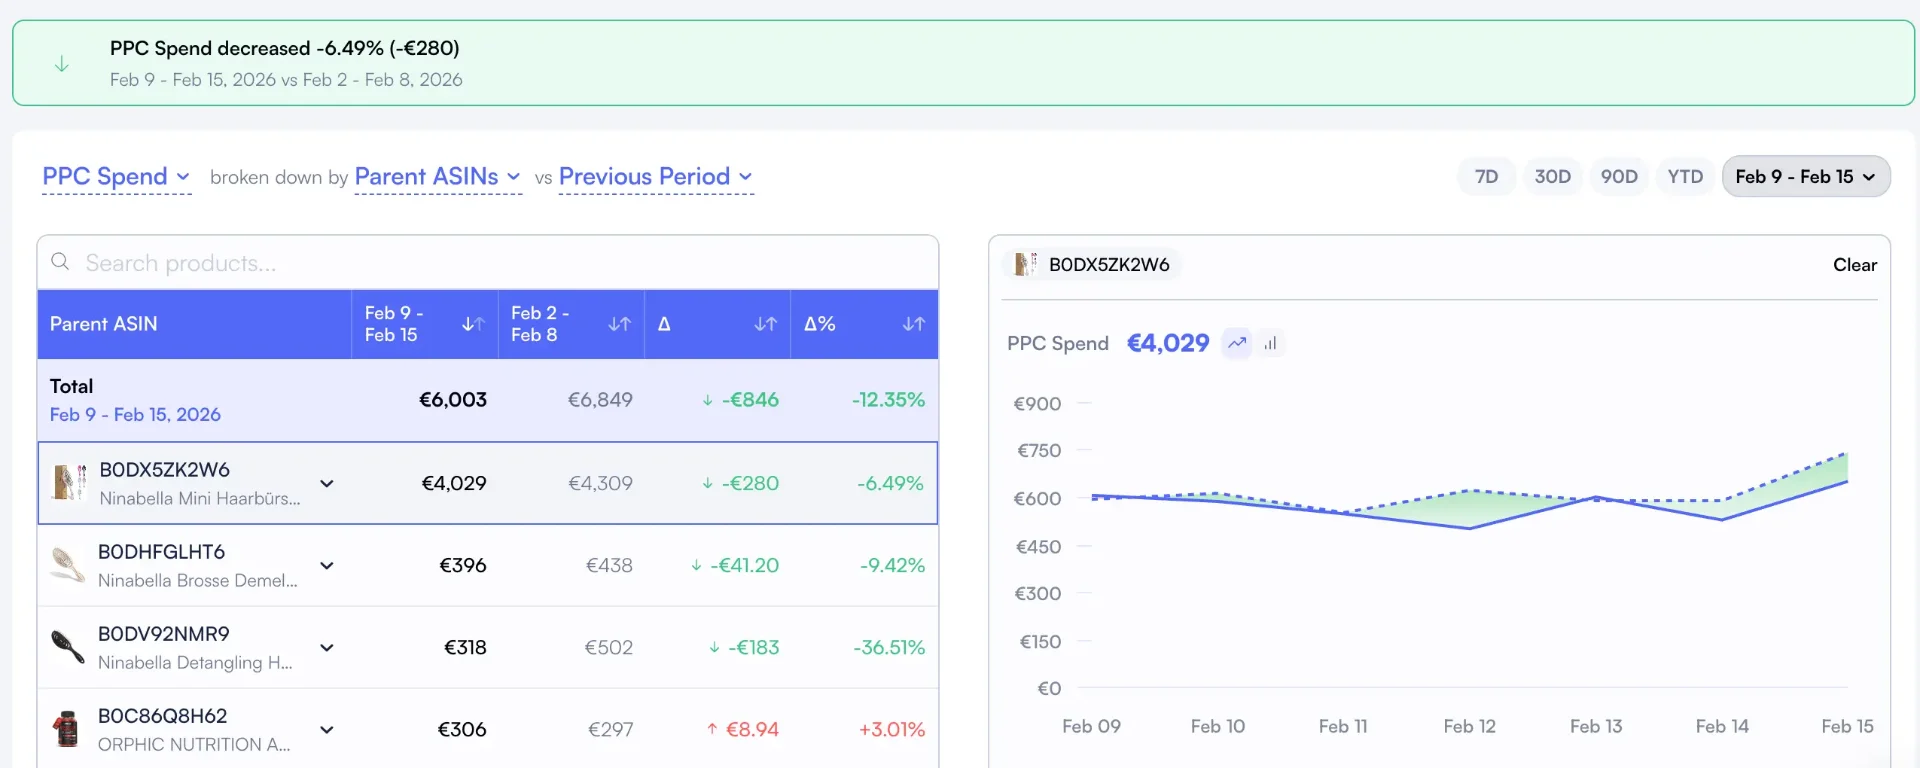
PPC attribution at the Parent ASIN level
See the true cost and return of every listing by grouping ad data where it belongs
The halo effect problem
Ads on one variant convert sales on another. Child ASIN reports hide it, leaving spend unattributed.
Why Parent ASIN fixes it
Roll all variants under one listing to see true TACoS and ACoS per product family — and act on it.
Who this is for
Product-level PPC analytics for every role that touches ad spend
Brand managers
Track TACoS by product family. Know which listings need budget and which to pause.
Agencies
Manage PPC across client accounts. Compare ad performance per brand in one view.
Sellers cutting waste
Find products bleeding ad budget. Reallocate spend to profitable SKUs.
Switching from a PPC bid manager?
Nova isn't a bid automation tool. It's the Amazon PPC analytics layer that tells you what your ads actually earn after fees, COGS and returns.
From Helium 10
Keep your keyword research workflow. Pipe spend and sales into Nova to see TACoS, ROAS and profit per Parent ASIN — across SP, SB, SD.
From Perpetua or M19
Keep automating bids where it works. Use Nova to audit what every campaign actually earns once fees, returns and COGS are subtracted.
From Sellerboard PPC
Get the same profit lens with hourly refresh, Parent ASIN attribution and 40+ fee types reconciled across 21 marketplaces.
How sellers find ad waste with Nova
SKU-level patterns Nova surfaces in week one
3 ASINs
Negative margin under ads
A typical mid-size catalog hides 2 to 5 SKUs whose true margin turns negative once ad spend is loaded against real fees and returns.
28% → 14%
TACoS after pause
Pausing the worst SKUs and reallocating budget to top Parent ASINs typically cuts blended TACoS roughly in half within 60 days.
Hourly
Refresh cycle
Spend, sales, fees and returns reconcile every hour, so optimisation decisions never lag a day behind the actual ad performance.
They talk about Nova







Related solutions
Explore other tools that complement your Amazon selling strategy
Amazon PPC Analytics Tool
Analyze PPC spend, ACoS, and advertising ROI at the product level
Amazon ACoS Calculator
Calculate and track your advertising cost of sales by campaign
Amazon TACoS Calculator
Measure total advertising cost of sales including organic lift
Amazon Sales Tracker
Track daily, weekly, and monthly sales across all marketplaces
Related Insights
Explore in-depth guides to get the most from this feature
Track PPC ROI Per Product
Learn how to measure the true return on investment for your Amazon PPC campaigns at the product level.
TACoS Explained: The Complete Guide for Amazon Sellers
Learn how TACoS (Total Advertising Cost of Sale) impacts your profitability and how to optimize it.
Contribution Margin Optimization Guide
Turn your CM1/CM2/CM3 data into profitable decisions with practical frameworks.
Simple, transparent pricing
Start free. Scale when you're ready.
14-day free trial • No credit card required • Cancel anytime
- Profit & loss analytics
- PPC Analytics
- Custom breakdowns
- Buy Box %
- BSR Tracker
- Returns Analytics
- Consolidated Data Exports
- Priority support
Unlimited accounts. Dedicated support.
- Unlimited orders
- Unlimited accounts
- Unlimited team seats
- Advanced User Management System
- Client-first view
- Dedicated account manager
- Custom data exports
- SLA guarantees