 MCP
MCPNova MCP for Claude goes live in
The bridge that gives Claude context on your reconciled Amazon data.
FBA vs FBM: Compare Performance Across Your Catalog
Track margins, spot trends, and compare performance by fulfillment type for every SKU. Nova filters your entire analytics suite by FBA or FBM so you can make data-driven fulfillment decisions.

Try the free FBA vs FBM calculator
Enter your selling price, weight, and product cost to compare net profit and margin for both fulfillment models.
FBA vs FBM Cost Calculator
Compare profitability for your product
Enter your email to unlock the full calculator and compare unlimited products.
Why sellers can't compare FBA vs FBM performance
Seller Central doesn't split analytics by fulfillment type. Without that visibility, you're making fulfillment decisions blind.
Seller Central doesn't split P&L
Seller Central doesn't split P&L by fulfillment type. You see total revenue, total fees, total profit. There's no way to isolate FBA margins from FBM margins without exporting data and building your own spreadsheet.
FBM trends are invisible
You can't see which FBM SKUs are gaining or losing margin over time. Without trend data by fulfillment type, you won't notice a product slowly becoming unprofitable under FBM until it's too late.
No daily KPI split
No way to compare daily KPIs between FBA and FBM products. CM3%, TACoS, and contribution margin should be tracked separately for each model. Seller Central blends everything together.
Performance drivers are invisible
You don't know if your FBA products or FBM products are dragging overall numbers. Without a breakdown, you can't act on what's actually driving margin changes.
See Nova in action
Filter your entire analytics by fulfillment type. See which model performs better across margins, fees, and daily KPIs.
P&L by Fulfillment Type
Filter your P&L by FBA or FBM. See waterfall breakdown per model.
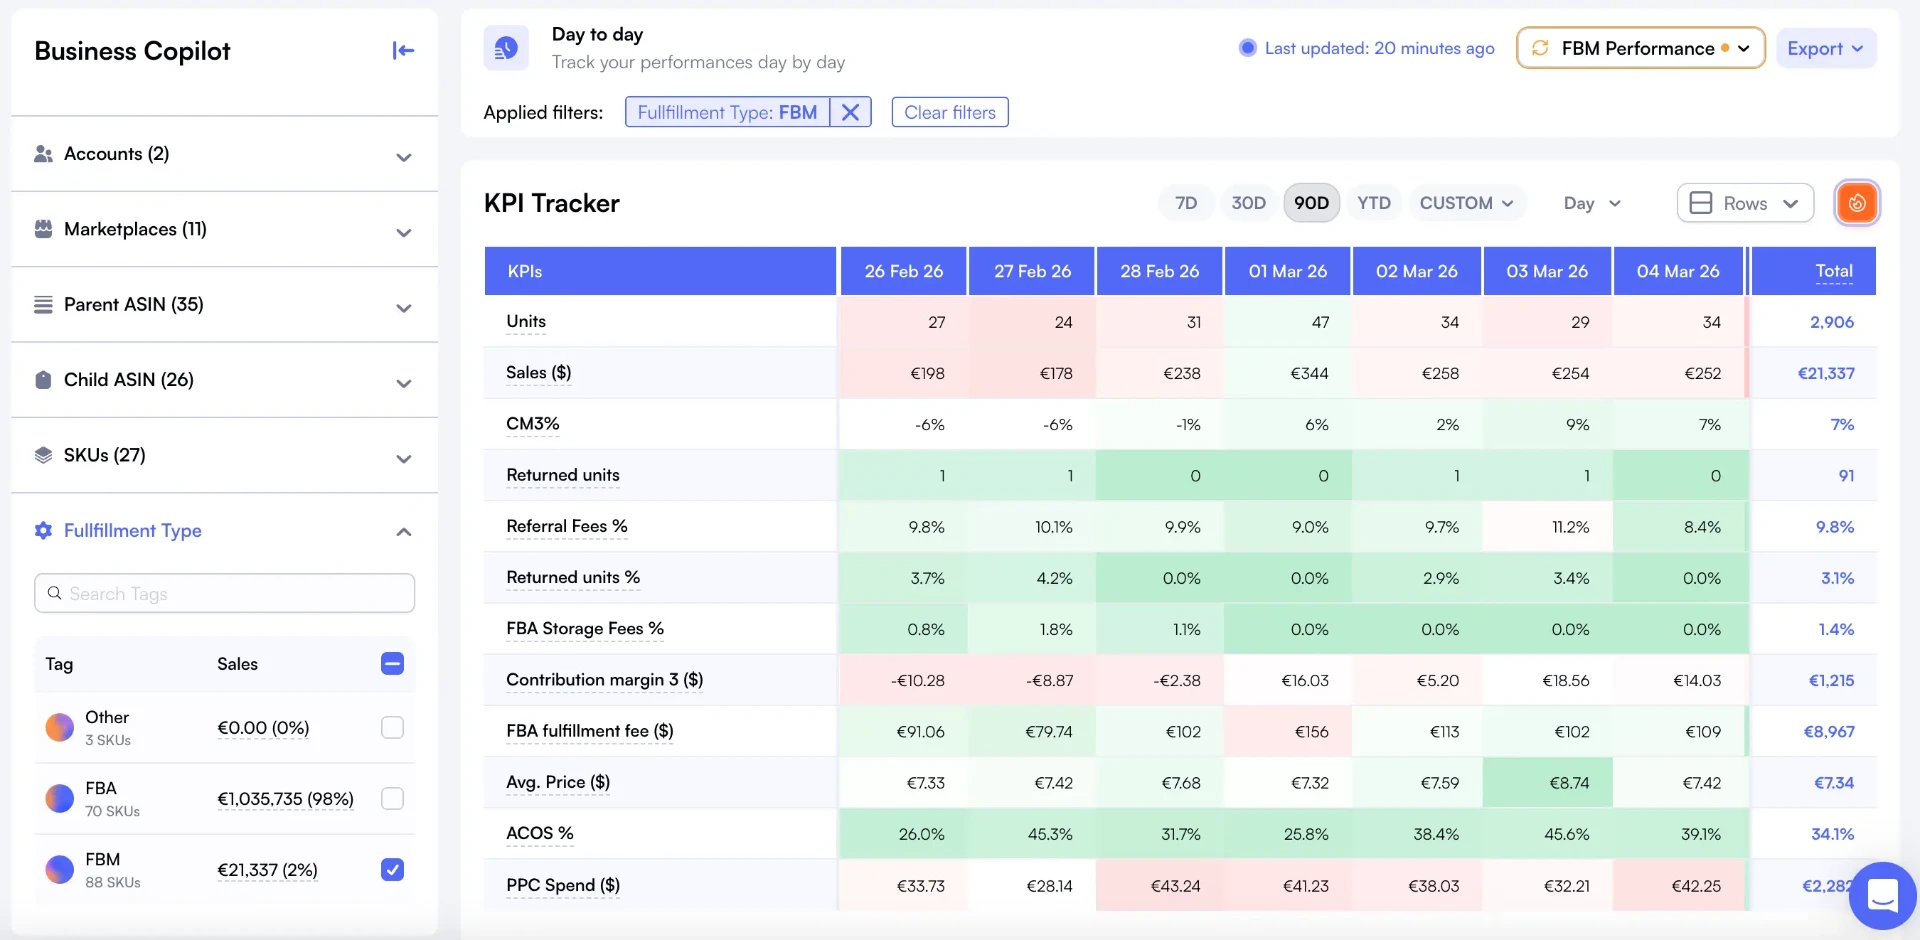
Daily KPI Tracking
Track CM3%, TACoS, and margins daily for FBA and FBM separately.
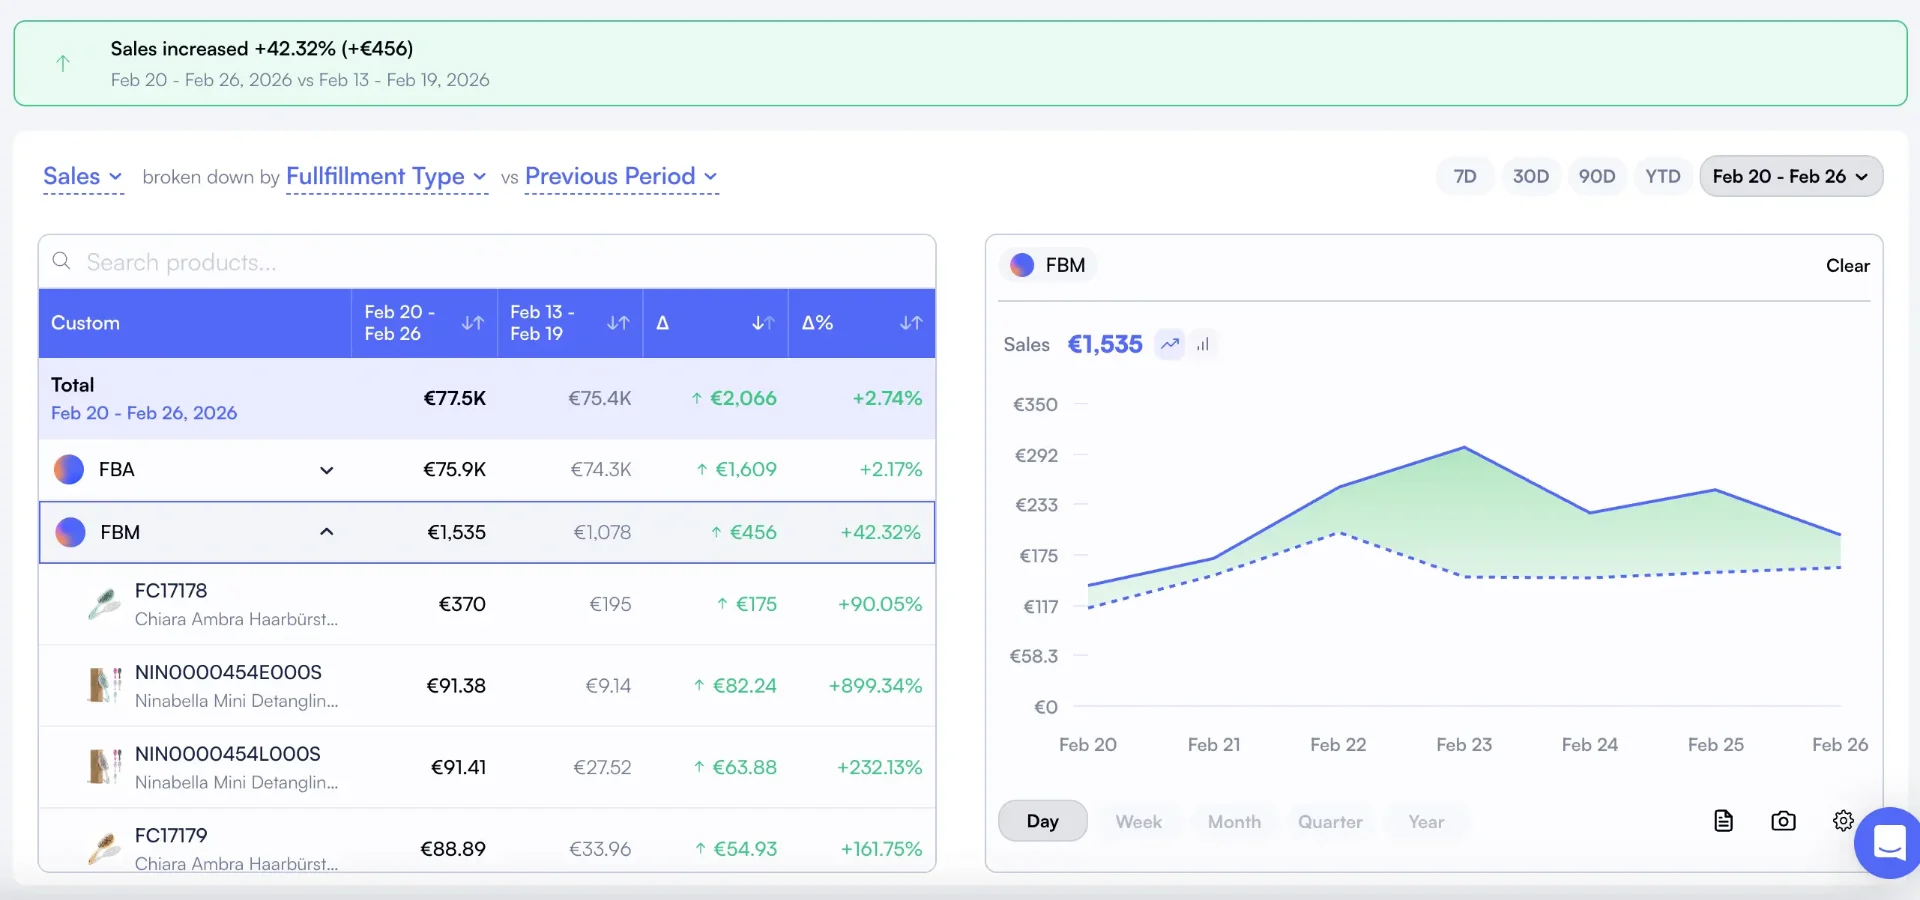
Performance Drivers
See which fulfillment type is driving margin gains or losses.
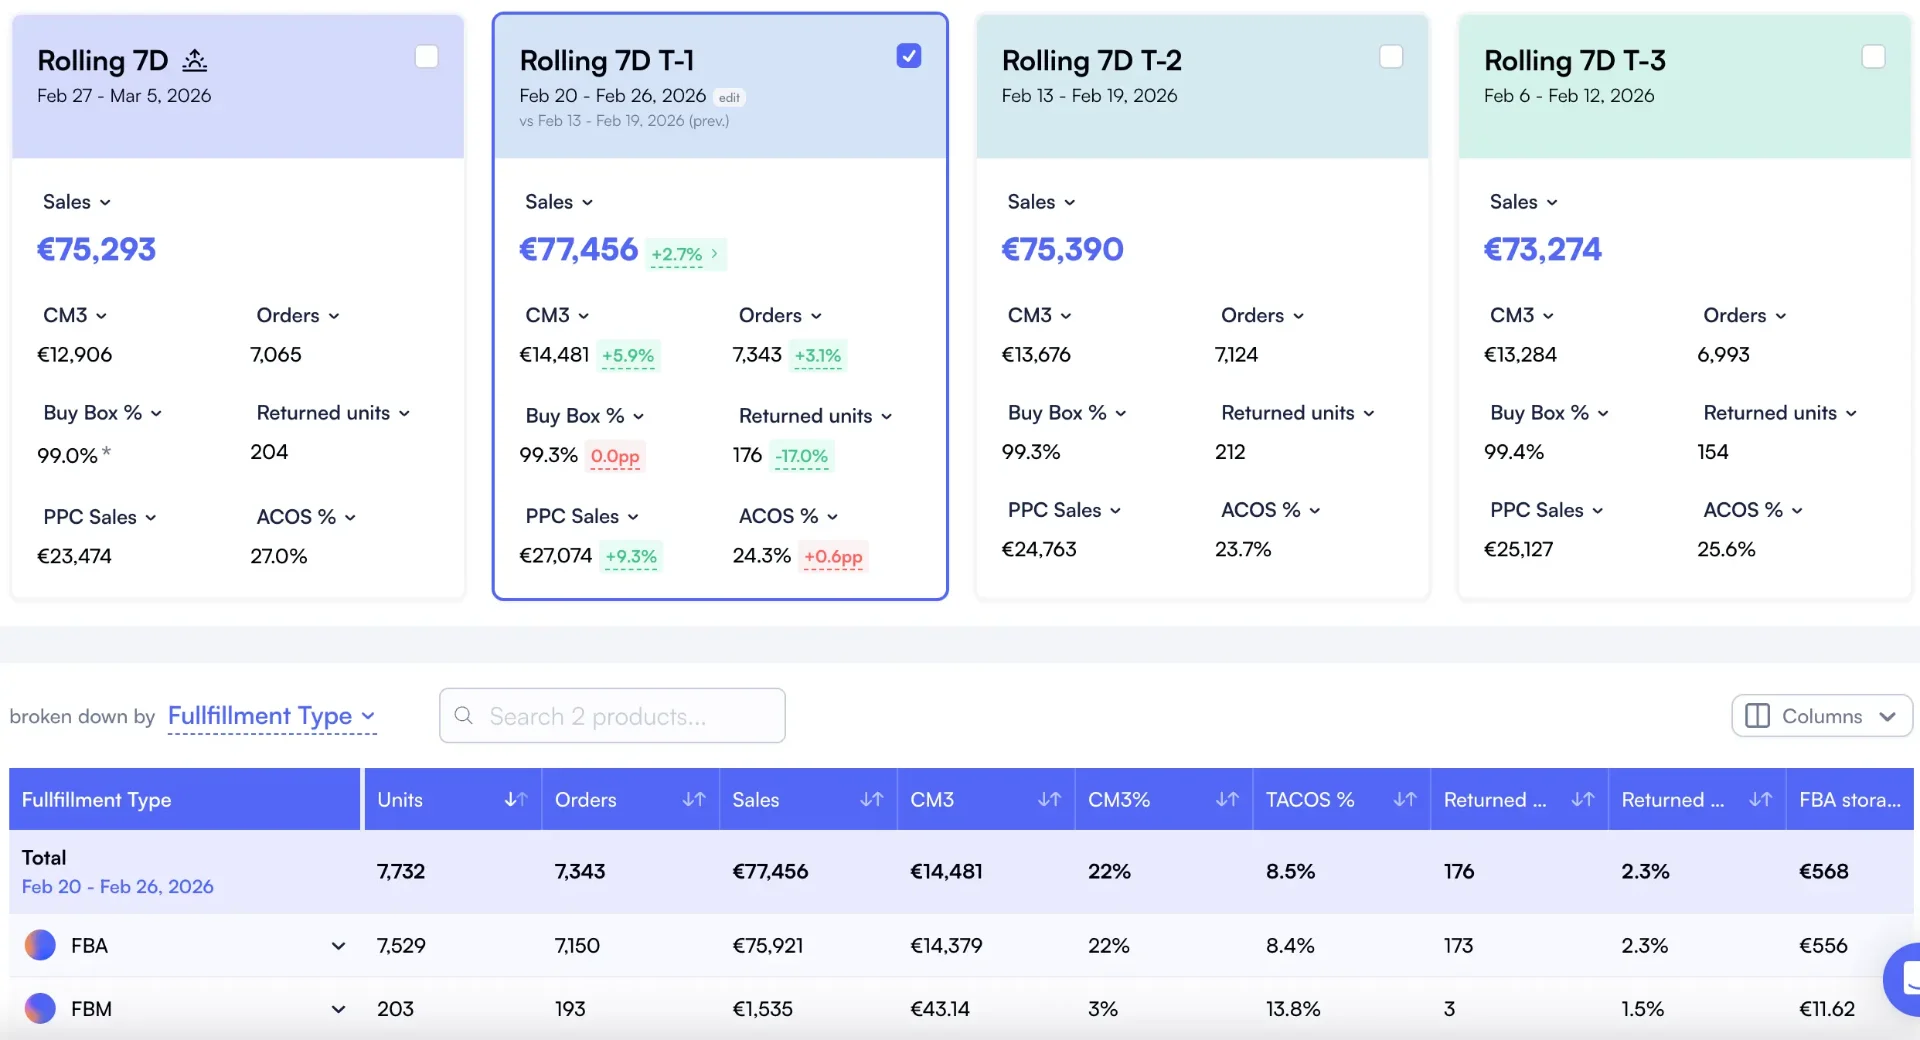
Product Cockpit Filter
Rolling 7-day cockpit with FBA/FBM breakdown per product.
Custom Metrics Comparison
Select 10+ KPIs and compare them side by side by fulfillment type.
Multi-Marketplace Performance
Compare fulfillment performance across 21 Amazon marketplaces.
40+
Fee Types Tracked
Every referral, FBA, storage, and return fee. Automatically.
99.8%
Accuracy
Verified against Amazon Settlement Reports.
21
Marketplaces
All Amazon regions. Automatic currency conversion.
Compare FBA vs FBM Performance in 5 Minutes
Connect your Seller Central account and see how each fulfillment type performs across margins, fees, and daily KPIs. No spreadsheets, no guessing. Start your 14-day free trial today.
Start Free TrialNova vs Seller Central vs Spreadsheets
Three approaches to comparing FBA and FBM performance. Only one gives you fulfillment-level analytics in real time.
| Capability | Spreadsheets | Seller Central | Nova |
|---|---|---|---|
| P&L by fulfillment type | Manual pivot tables | Not available | One-click filter |
| Daily KPI split (FBA vs FBM) | Manual calculation | Not available | Automatic, daily |
| Performance drivers by fulfillment | Not possible | Not available | Per-SKU delta breakdown |
| Margin trend by model | Time-consuming charts | No trend data | Built-in trend analysis |
| Product cockpit with filter | Separate sheets | No cockpit view | Rolling 7D with FBA/FBM |
| Custom KPI columns | Manual setup | Fixed columns | 10+ selectable metrics |
| PPC included in margins | Separate tracking | No | Yes, automatic |
| Multi-marketplace | Separate sheets | One marketplace | 21 marketplaces |
| Catalog-wide analysis | Impractical at scale | One ASIN at a time | Entire catalog |
| Accuracy vs Settlement | ~75-85% | Estimate only | 99.8% |
How it works
From zero to full FBA vs FBM performance comparison in 5 minutes. No spreadsheets needed.
Connect Your Amazon Account
Link your Seller Central account through Amazon's official SP-API. Nova pulls your orders, fees, returns, and ad data automatically. Takes under 2 minutes.
Filter by Fulfillment Type
Instantly filter your P&L, cockpit, and performance drivers by FBA or FBM. See margins, fees, and KPIs isolated by fulfillment model.
Spot Winners & Losers
Identify which FBM products are gaining margin and which FBA products need attention. Use performance drivers to see per-SKU deltas by fulfillment type.
They talk about Nova


Who uses Nova's FBM calculator?
From hybrid sellers optimizing fulfillment to operators scaling FBM-first brands.
$10K - $200K/mo
FBM-First Sellers
- Track true FBM costs: shipping, labor, packaging
- Compare margins against FBA for each product
- Identify when to switch products to FBA
- Factor in return processing costs
$100K - $500K/mo
Hybrid FBA/FBM Sellers
- Side-by-side fulfillment cost comparison per SKU
- Optimize fulfillment mix for peak vs off-peak
- Track seasonal shipping rate changes
- COGS tracking across both fulfillment models
$500K+/mo
Agencies & Multi-Brand Operators
- Consolidate FBM cost tracking across 100+ accounts
- Per-client fulfillment profitability dashboards
- Compare FBM strategies across different brands
- Multi-marketplace FBM cost analysis
Nova connects to your entire Amazon ecosystem. Explore our P&L Analytics, Fees Calculator, and Profit Calculator for complete cost visibility. Compare across regions with marketplace analytics.
What Is FBA vs FBM Performance Comparison?
FBA vs FBM performance comparison means analyzing your Amazon business metrics separately for each fulfillment model. Instead of looking at blended numbers, you filter your P&L, daily KPIs, and product-level data by FBA or FBM. This reveals which fulfillment type drives better margins, where you're losing money, and which products should switch models.
Seller Central doesn't offer this. Amazon's Revenue Calculator estimates FBA fees for a single ASIN. It doesn't track performance over time, compare daily KPIs across fulfillment types, or show you which model is actually delivering better results across your catalog. Without fulfillment-level analytics, sellers make gut-feel decisions about where to fulfill each product.
Nova solves this by letting you filter every analytics view by fulfillment type. Your P&L, Day-to-Day dashboard, Product Cockpit, and Performance Drivers all support FBA/FBM filtering. You see exactly how each model performs across margins, fees, and trends. That's how you make data-driven fulfillment decisions instead of guessing.
Why Sellers Choose Nova for FBA vs FBM Analytics
"We moved 40% of our catalog from FBA to FBM after Nova showed us the real performance difference. Our margins improved by $8K/month."
Hybrid FBA/FBM Seller
120 SKUs, $180K/month revenue
"I was losing margin on FBM for my heavy items without realizing it. Nova's fulfillment filter made the switch to FBA obvious for those products."
Home & Garden Seller
65 SKUs across US and UK
Simple, transparent pricing
Start free. Scale when you're ready.
14-day free trial • No credit card required • Cancel anytime
- Profit & loss analytics
- PPC Analytics
- Custom breakdowns
- Buy Box %
- BSR Tracker
- Returns Analytics
- Consolidated Data Exports
- Priority support
Unlimited accounts. Dedicated support.
- Unlimited orders
- Unlimited accounts
- Unlimited team seats
- Advanced User Management System
- Client-first view
- Dedicated account manager
- Custom data exports
- SLA guarantees
Amazon FBM Calculator: Frequently Asked Questions
Everything you need to know about comparing FBA vs FBM performance through Nova's analytics.
Learn More About FBM vs FBA Profitability
Explore in-depth guides to get the most from this feature
FBA vs FBM: Which Fulfillment Model Is More Profitable?
Side-by-side cost analysis of FBA and FBM with real margin comparisons by category.
Amazon FBA Fees 2026: Complete Breakdown
Every Amazon FBA fee explained with exact dollar amounts, size tiers, and seasonal surcharges for 2026.
How to Reduce Amazon FBA Fees in 2026
Proven strategies to lower your FBA costs through packaging optimization, storage management, and fee auditing.
Amazon Accounting Software: Best Tools for Sellers
Compare the top accounting and profit tracking tools for Amazon sellers in 2026.
Related solutions
Explore other tools that complement your Amazon selling strategy
Amazon FBA Fee Calculator
Calculate exact FBA fulfillment, storage, and referral fees
Amazon Seller Calculator
All-in-one calculator for fees, profit, margins, and PPC costs
Amazon Profit Tracker
Track profit trends over time across your entire portfolio
Amazon FBA Analytics Software
Complete FBA analytics with inventory, fees, and profitability
Stop Guessing. Compare FBA vs FBM Performance.
Join 2,000+ Amazon sellers who use Nova to compare fulfillment performance. Connect your account in 5 minutes, filter by FBA or FBM, and see which model drives better margins.