 MCP
MCPNova MCP for Claude goes live in
The bridge that gives Claude context on your reconciled Amazon data.
Amazon ACoS Calculator: See If Your Ads Actually Make Money
Your ACoS looks fine. But are those campaigns actually profitable after fees, COGS, and returns? Nova connects ad spend to real product costs so you know for sure.

Why ACoS Alone Doesn't Tell You If Ads Are Profitable
A 20% ACoS sounds great. But if your product margin is 18% after fees, every ad sale loses money. Here's what most sellers miss.
Amazon's ad console shows ACoS against
Amazon's ad console shows ACoS against revenue, not profit. A 25% ACoS looks efficient until your margin after fees and COGS is only 22%. Every 'profitable' campaign is actually losing money.
Break-even ACoS varies by product
Break-even ACoS varies by product. A supplement with 60% margins handles 40% ACoS easily. An electronics accessory at 15% margins can't survive above 12%. Per-SKU margin data is essential.
Fee changes shift your break-even ACoS
Fee changes shift your break-even ACoS silently. When Amazon raises FBA or storage fees, profitable campaigns can flip to unprofitable overnight. Static ACoS targets don't adapt.
Returns erode ad ROI invisibly
Returns erode ad ROI invisibly. You paid for the click, Amazon charged the referral fee, and the customer returned it. That sale went from profitable to a net loss, but ACoS still counts it.
See Nova in Action
ACoS connected to real margins. Not just ad metrics in isolation.
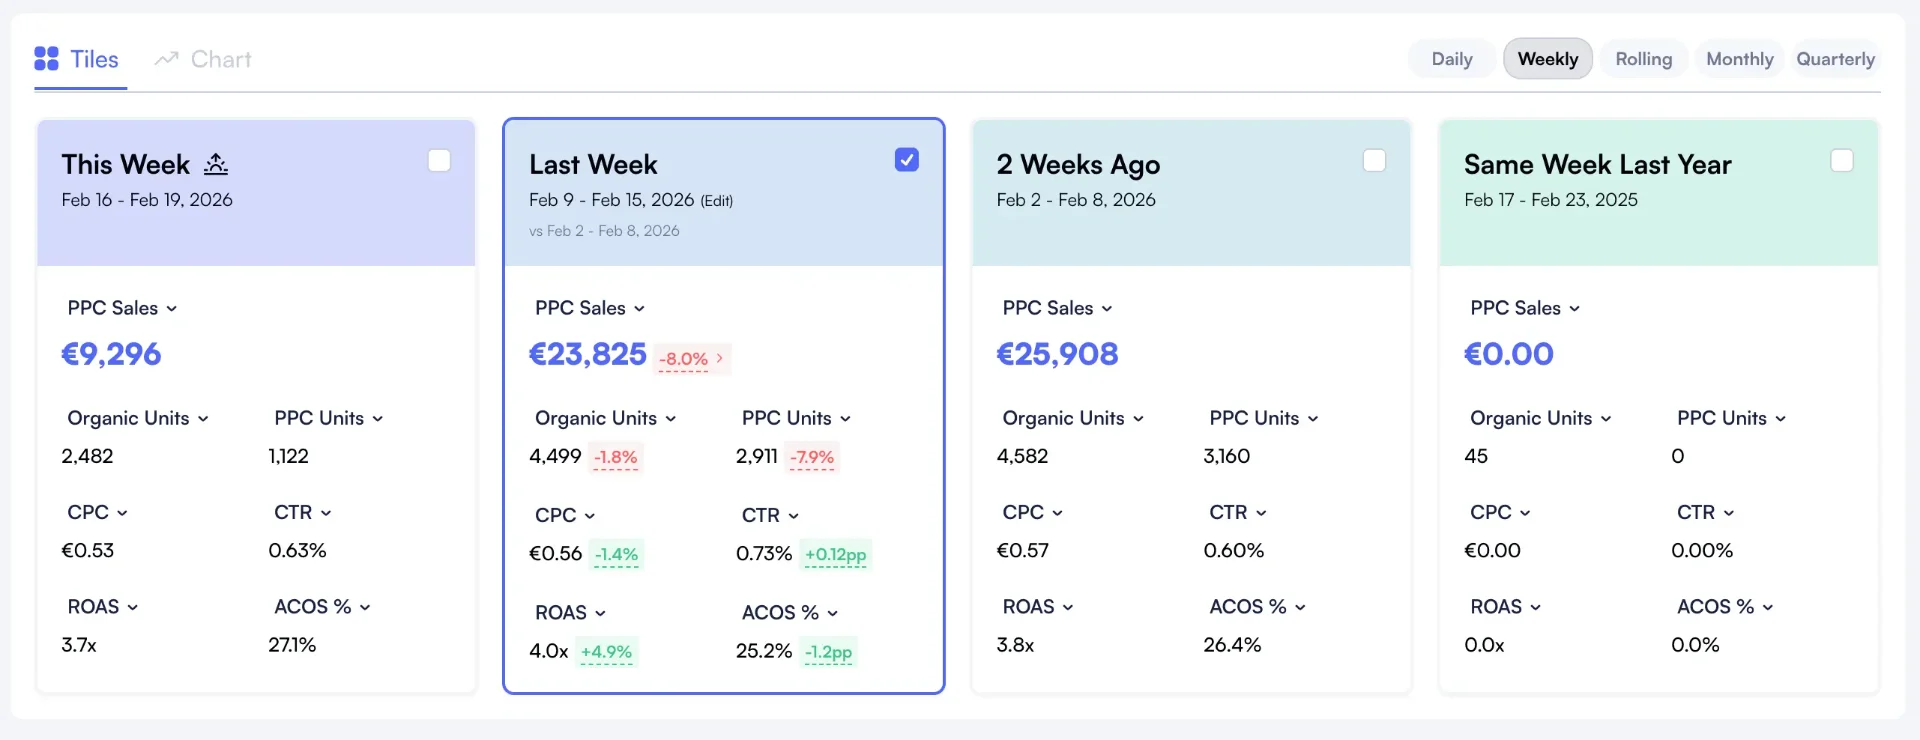
ACoS by Ad Type
See true profitability across Sponsored Products, Brands, and Display.
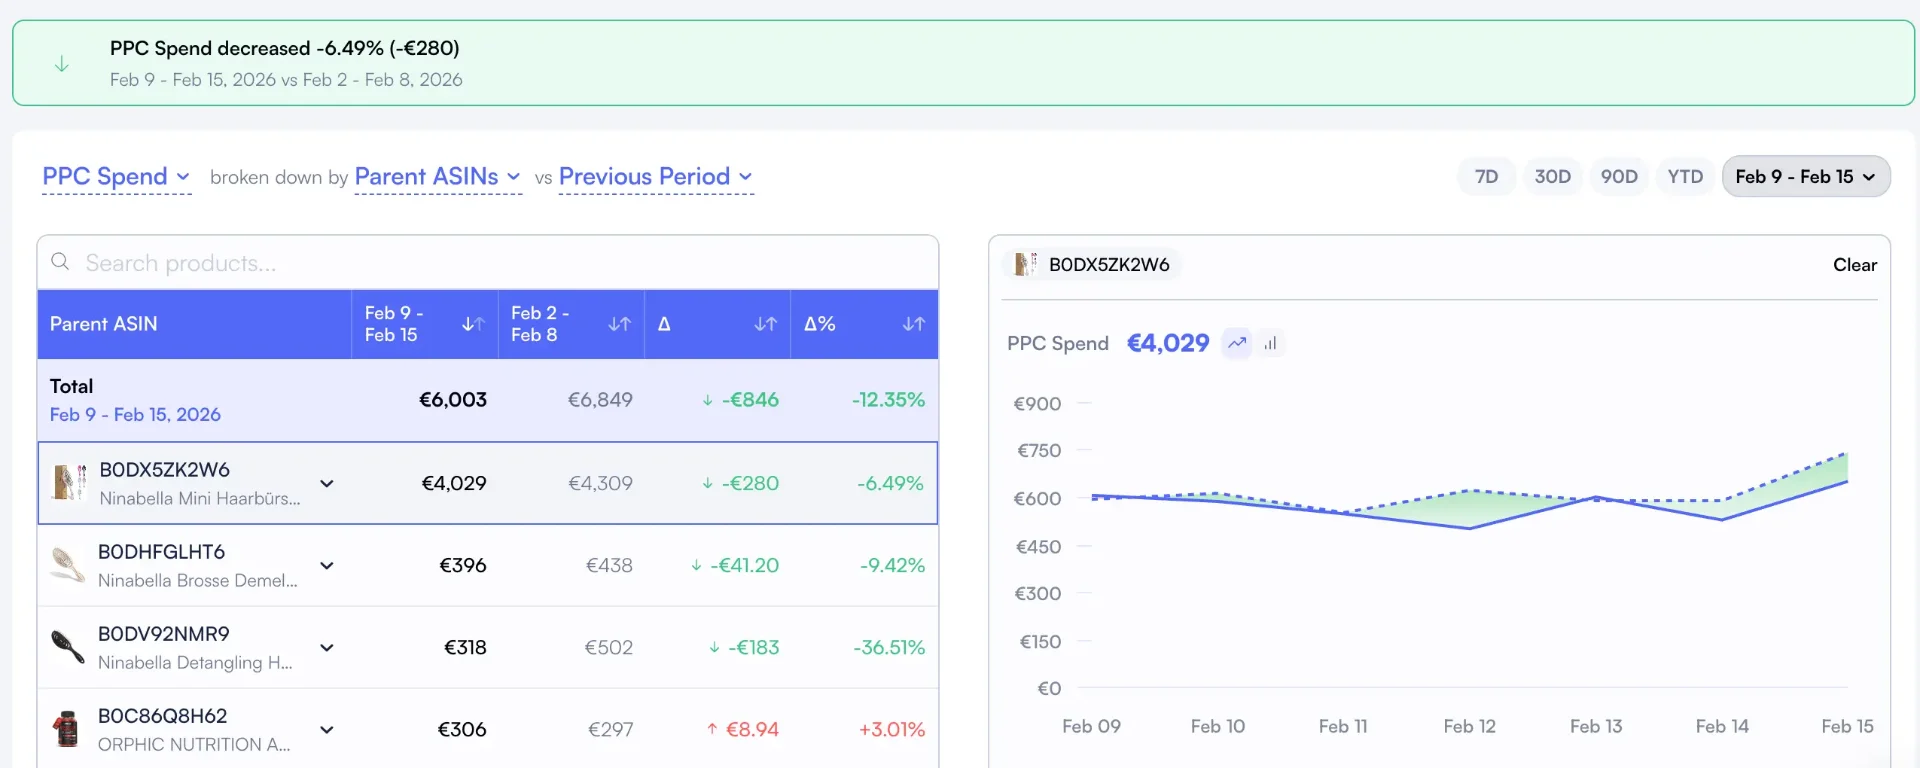
ACoS by Product
Break-even ACoS calculated per SKU using real fees and COGS.
ACoS vs TACoS
Compare ad efficiency against total business impact side by side.
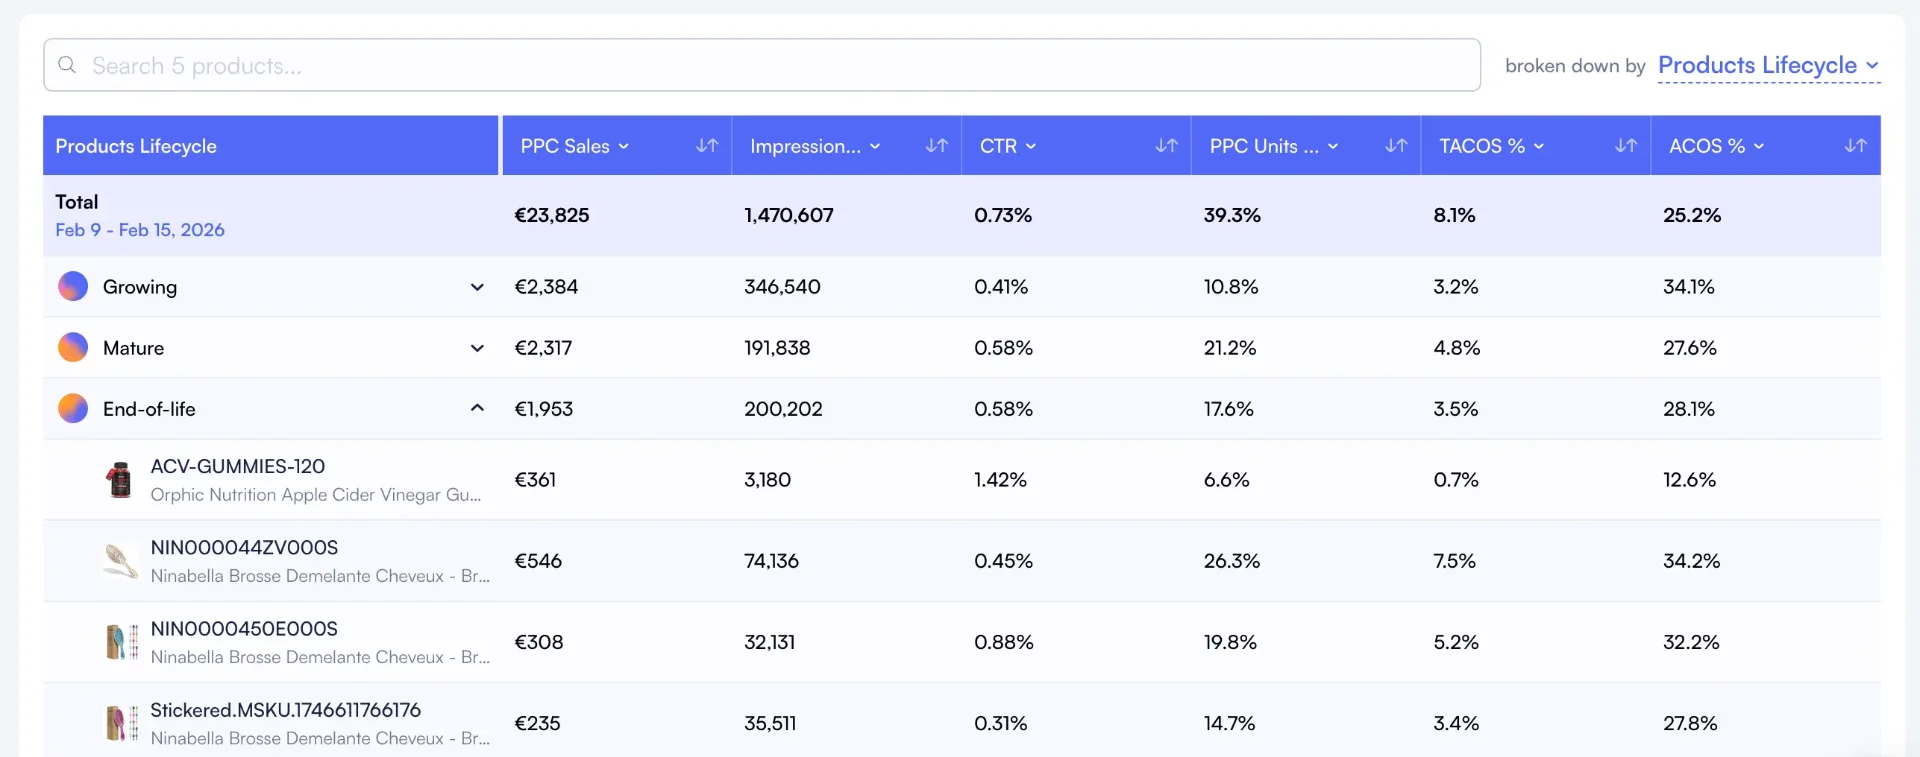
Profit-Connected ACoS
ACoS displayed alongside CM1, CM2, CM3 margins per product.
Ad Type Performance
Compare SP, SB, and SD performance with profit context.
Multi-Marketplace ACoS
Track ad efficiency across 21 Amazon regions in one view.
40+
Fee Types in ACoS Calc
Every Amazon fee deducted before calculating your true break-even ACoS.
99.8%
Cost Accuracy
Matched line-by-line against Amazon Settlement Reports.
23
Marketplaces
Compare ACoS performance across every Amazon region.
Find Your Break-Even ACoS in 5 Minutes
Connect your Seller Central and Advertising accounts. Nova calculates your break-even ACoS per product using real fees, COGS, and return rates. No spreadsheets needed.
Try For FreeNova vs Amazon Console vs Spreadsheets
Three ways to evaluate ACoS. Only one connects ads to actual profit.
| Capability | Amazon Console | Spreadsheets | Nova |
|---|---|---|---|
| ACoS calculation | Ad spend / ad revenue | Manual formula | Automatic, real-time |
| Break-even ACoS | Not available | Manual per product | Auto per SKU |
| Fees in calculation | None | 5-10 (if you find them) | 40+ (automatic) |
| COGS connected | No | Manual entry | Yes, per SKU |
| Returns impact on ACoS | Separate report | Usually missed | Auto-deducted |
| ACoS vs TACoS | Separate views | Complex formulas | Side-by-side, live |
| Ad profitability per product | Revenue only | Hours of calculation | Instant, per ASIN |
| Multi-marketplace | Separate consoles | Separate sheets | 21 marketplaces unified |
| Fee change impact | Not tracked | Manual updates | Automatic adjustment |
| Time investment | None (limited data) | Hours per week | 5 min setup, then zero |
How It Works
From isolated ACoS numbers to profit-connected ad analytics in 5 minutes.
Connect Advertising API
Link both Seller Central and Amazon Advertising accounts via official APIs. Nova pulls campaign spend, impressions, clicks, and attributed revenue alongside your order and fee data.
See ACoS With Real Costs
Nova deducts all 40+ fee types, COGS, and return costs from your ad revenue. You get break-even ACoS per product and true ad profitability after all costs. Not just ad spend vs revenue.
Track Ad Profitability Per Product
Your ad dashboard updates automatically. When fees change or return rates spike, break-even ACoS adjusts in real time. Spot unprofitable products before they drain margin.
They talk about Nova


Who Uses Nova's ACoS Calculator?
From solo sellers optimizing 5 campaigns to agencies managing ad budgets across 100+ brands.
$10K - $500K/mo
FBA Sellers
- Break-even ACoS per product
- Spot unprofitable campaigns instantly
- Connect PPC spend to net margins
- Compare SP vs SB vs SD profitability
$100K - $1M/mo
Brand Managers
- Portfolio-level ad efficiency
- ACoS trends by product category
- Budget allocation based on margins
- Export ad profitability reports
$1M+/mo
Agencies & Aggregators
- Client-level ACoS benchmarking
- Multi-brand ad spend tracking
- Cross-marketplace ACoS comparison
- Export-ready PPC profitability reports
ACoS is one piece of the profitability puzzle. See our TACoS Calculator, PPC Analytics Tool, Profit Tracker, and Profit Calculator.
What Is an Amazon ACoS Calculator?
An Amazon ACoS calculator measures how much of your ad-attributed revenue goes to advertising costs. The basic formula is simple: ad spend divided by ad revenue. But the basic formula misses a critical point. It doesn't tell you whether those ad sales are actually profitable.
A profit-connected ACoS calculator like Nova goes further. It deducts all 40+ Amazon fee types (referral, fulfillment, storage, returns, refund admin), your COGS, and shipping costs from ad revenue. What's left is your true margin on ad sales. That margin is your break-even ACoS: the maximum you can spend on ads without losing money.
Most sellers discover their break-even ACoS is 10-20% lower than they assumed. A product they thought could handle 30% ACoS actually breaks even at 18% after all costs are factored in. Nova calculates this per SKU, per marketplace, and updates it automatically as fees and costs change.
Why Sellers Choose Nova for ACoS Tracking
"Knowing our break-even ACoS per product changed how we bid. We stopped guessing and started profiting from ads."
PPC Manager
60+ campaigns, $90K/month ad spend
"Nova shows ACoS alongside real margins, not just revenue. We found 8 products where 'profitable' ads were actually losing money."
FBA Seller
35 SKUs, home & kitchen category
Simple, transparent pricing
Start free. Scale when you're ready.
14-day free trial • No credit card required • Cancel anytime
- Profit & loss analytics
- PPC Analytics
- Custom breakdowns
- Buy Box %
- BSR Tracker
- Returns Analytics
- Consolidated Data Exports
- Priority support
Unlimited accounts. Dedicated support.
- Unlimited orders
- Unlimited accounts
- Unlimited team seats
- Advanced User Management System
- Client-first view
- Dedicated account manager
- Custom data exports
- SLA guarantees
Amazon ACoS Calculator: Frequently Asked Questions
Everything you need to know about calculating ACoS with real profit data.
Learn More About Amazon PPC Profitability
Explore in-depth guides to get the most from this feature
Amazon PPC Analytics: Complete 2026 Guide
Master PPC analytics with profit-connected campaign tracking, ACoS optimization, and TACoS monitoring.
How to Calculate Amazon TACoS
Understand the difference between ACoS and TACoS, and why TACoS matters more for long-term growth.
Amazon Profit Dashboard Setup Guide
Set up profit tracking in 30 minutes. Step-by-step guide covering COGS, connections, and quick wins.
Contribution Margin Optimization Guide
Turn your CM1/CM2/CM3 data into profitable decisions with practical frameworks and strategies.
Related solutions
Explore other tools that complement your Amazon selling strategy
Amazon TACoS Calculator
Measure total advertising cost of sales including organic lift
Amazon PPC Analytics Tool
Analyze PPC spend, ACoS, and advertising ROI at the product level
Amazon Profit Tracker
Track profit trends over time across your entire portfolio
Advertising Dashboard
Unified view of all ad types with profit-connected ROAS
Stop Guessing If Your Ads Make Money. Start Knowing.
2,000+ sellers discovered their real break-even ACoS was lower than they assumed. Connect your account in 5 minutes and see your true ad profitability.