 MCP
MCPNova MCP for Claude goes live in
The bridge that gives Claude context on your reconciled Amazon data.
Know Which Products Make You Money. And Which Don't.
Track every SKU's true performance. Revenue, profit, PPC efficiency and return rates in one dashboard. Spot winners and losers before they move the needle.

Why Most Sellers Can't Spot Underperformers Fast Enough
Your catalog grows. Visibility shrinks. Here's what happens when product tracking falls behind.
A product losing $3 per unit
Hides behind strong revenue numbers. Without SKU-level profit tracking, you keep investing in losers for weeks before the P&L reveals the damage.
Return rates creep up silently
A product going from 3% to 8% returns costs thousands in processing fees and lost inventory. Seller Central buries this data across multiple reports.
PPC eats profit on 30% of your catalog
Some products have great organic sales but terrible ad efficiency. Without connecting ad spend to unit economics, you overspend on the wrong SKUs.
Seasonal shifts catch sellers off guard
A product performing well in Q3 can bleed money in Q1 due to storage fees and slow velocity. Only continuous tracking prevents these surprises.
See Nova in Action
From catalog-wide trends to individual SKU deep dives. Every product tells a story.
Winners & Losers
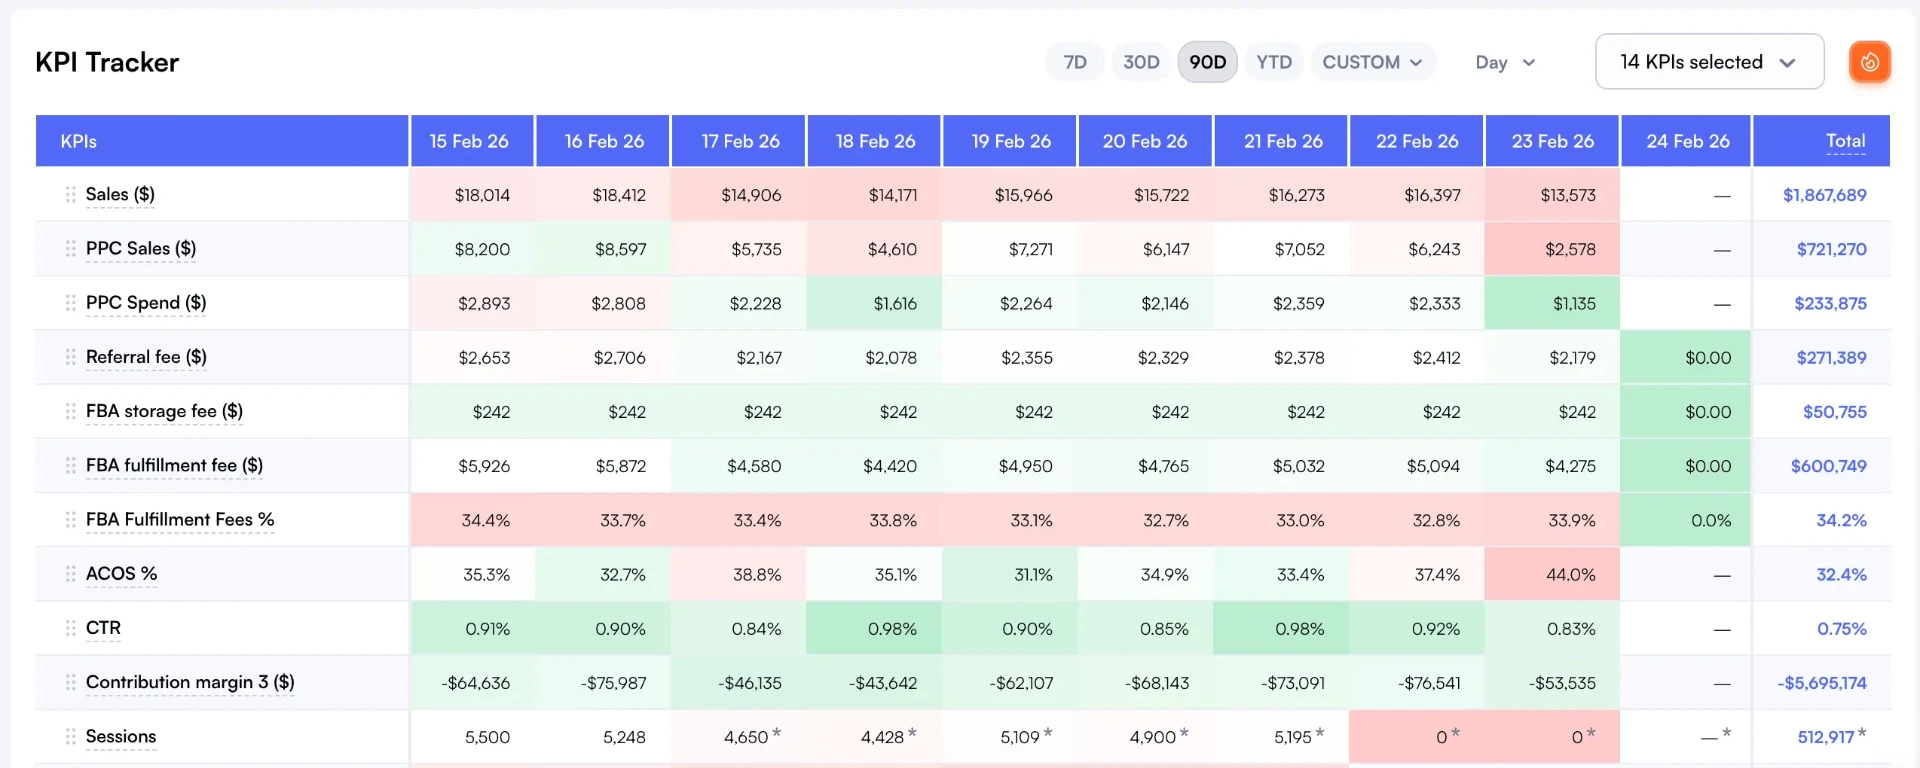
Instantly see which SKUs drive profit and which drain it.
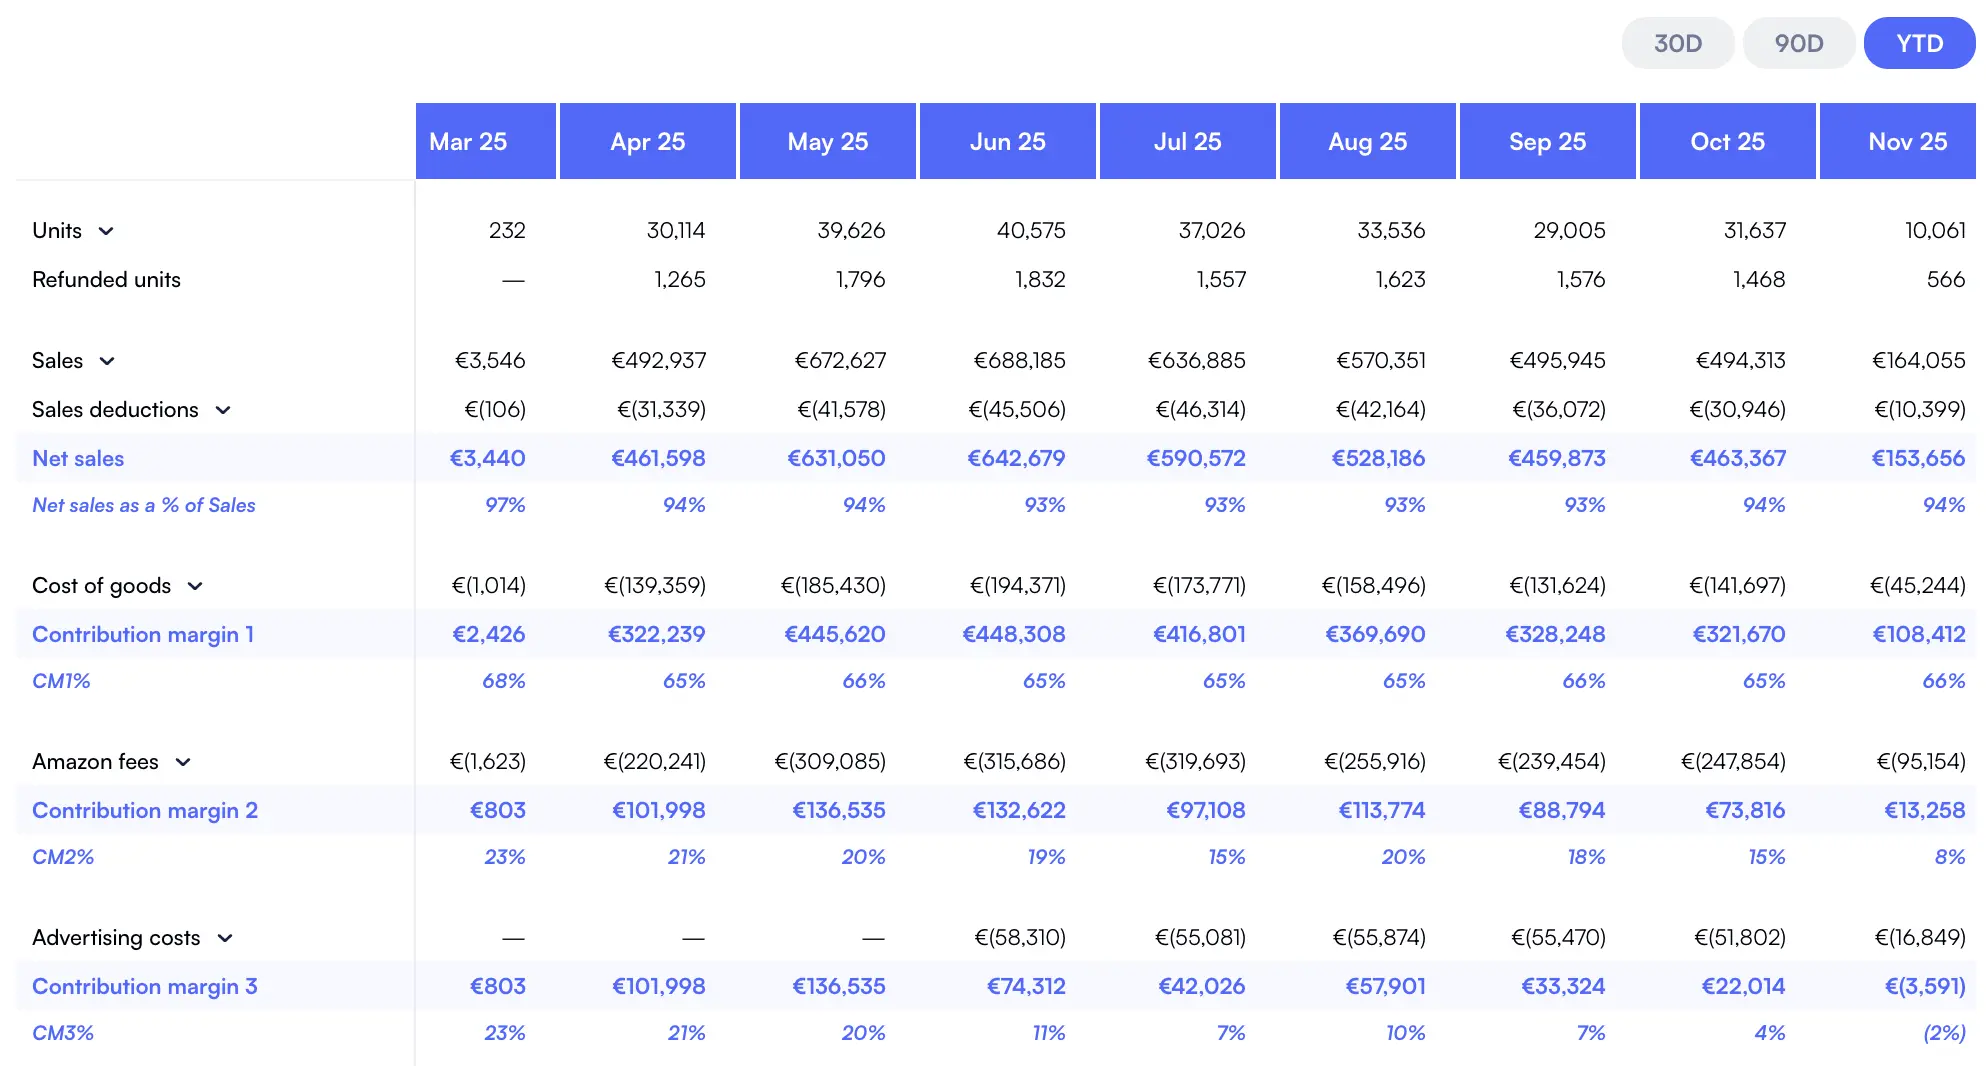
Margin Trend Analysis
Track how each product's margins evolve over days, weeks and months.
Return Rate Monitoring
Spot return spikes before they eat into your profit.
PPC Efficiency per SKU
See which products convert ads profitably and which don't.
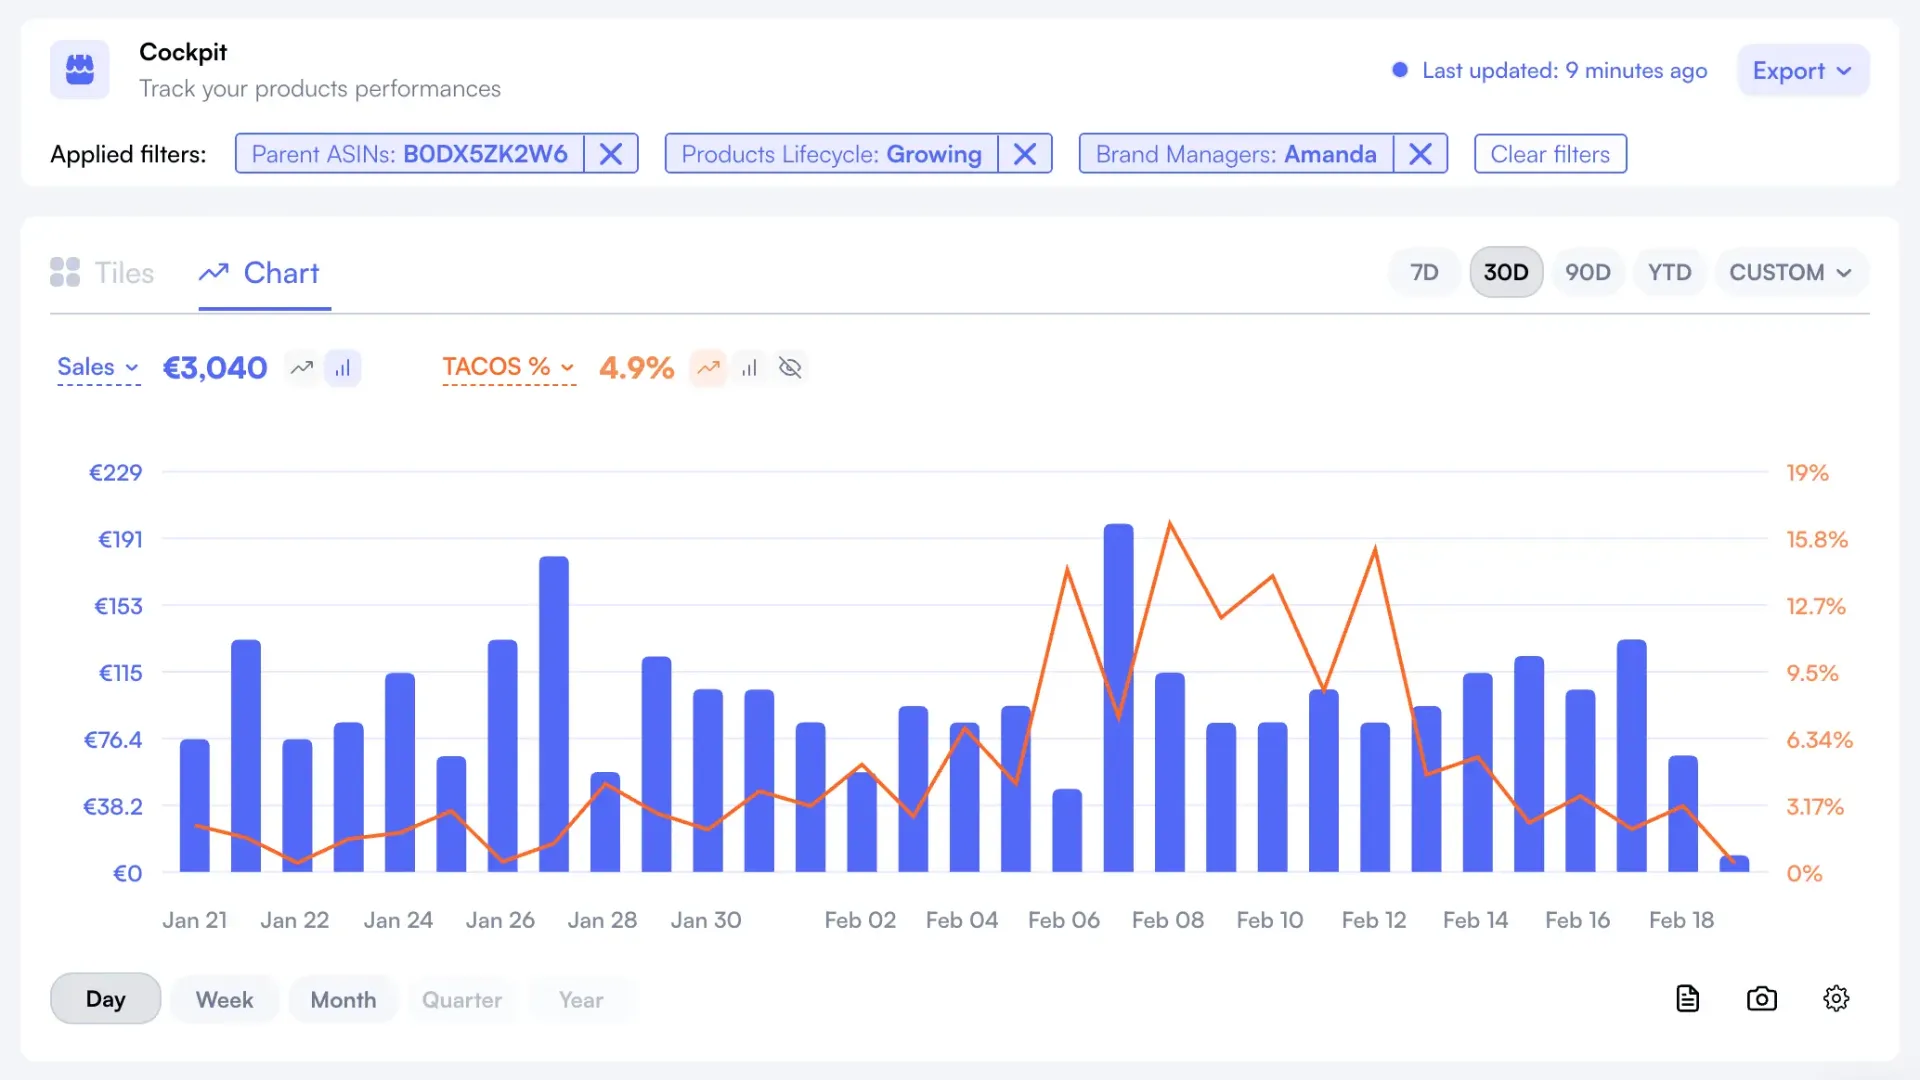
Custom Product Tags
Group by brand, lifecycle, price tier or any custom logic.
Period Comparison
Compare performance across time periods to catch trends early.
40+
Fee Types Tracked
Every Amazon fee deducted automatically per product.
99.8%
P&L Accuracy
Verified against Settlement Reports, line by line.
21
Marketplaces
Compare product performance across every Amazon region.
Stop guessing. Start seeing which products perform.
Connect Seller Central and get instant visibility into every product's true performance. Winners, losers and everything in between.
Start Free TrialNova vs Manual Tracking vs Seller Central
Three ways to track product performance. Only one gives you the full picture.
| Capability | Seller Central | Manual Tracking | Nova |
|---|---|---|---|
| SKU-level profit | No (revenue only) | Manual formulas | Automatic, every SKU |
| Winners & losers view | No | Pivot tables | Built-in, real-time |
| Return rate tracking | Separate report | Often missed | Auto-connected to P&L |
| PPC per product | Campaign-level only | Complex joins | Product-level, automatic |
| Trend analysis | No | Chart building | Daily trends, automatic |
| Custom product groups | No | Manual tagging | Smart tags, instant |
| Multi-marketplace | Separate dashboards | Separate sheets | 21 regions, unified |
| Period comparison | Limited | Manual | Any range, one click |
| Fee accuracy | ~8 fee types | 5-10 (manual) | 40+ (automatic) |
| Setup time | None (limited data) | Hours per week | 5 min setup, then zero |
How it works
From zero to full product intelligence in under 5 minutes.
Connect Your Amazon Account
Link Seller Central via Amazon's official SP-API. Nova pulls orders, fees, returns and ad data automatically.
Add Your Costs
Enter COGS per SKU or bulk import. Nova combines these with Amazon's fees to calculate true margins for every product.
Track Performance Automatically
See which products make money, which lose money and which need attention. Updated daily. No manual work.
They talk about Nova


Who uses Nova's product performance tracker?
FBA Sellers ($10K-$500K/mo)
Spot underperformers draining ad budget. Track margin trends across 50-500 SKUs. Cut losers fast, double down on winners.
Built for FBA sellers →Brand Managers ($100K-$1M/mo)
Category-level dashboards, product lifecycle tracking, custom breakdowns by brand or line, data-driven launch decisions.
How brand managers use it →Agencies & Aggregators ($1M+/mo)
Per-client performance views, portfolio-wide winner/loser analysis, custom tagging across 100+ accounts.
How agencies use it →Product tracking connects to everything else. See our Profit Tracker, Sales Tracker, FBA Analytics and Seller Dashboard.
What is an Amazon product performance tracker?
An Amazon product performance tracker monitors how each SKU in your catalog performs over time. It goes beyond basic sales data to show true profitability, margin trends, return rates and advertising efficiency at the individual product level.
The best performance trackers combine revenue data with every cost input: Amazon's 40+ fee types, cost of goods sold, PPC advertising spend, return processing costs and promotional discounts. This shows which products actually make money and which erode margins.
Nova adds custom tagging, period comparisons and multi-marketplace support. Group products by brand, lifecycle stage or any custom logic, then track aggregate performance per segment. Most sellers discover that 20-30% of their catalog operates at break-even or a loss.
Why Sellers Choose Nova for Product Performance
"SKU-level insights showed us that our top 10% of products drove 65% of profit. We doubled inventory on those and scaled back the rest."
FBA Brand Owner
90 SKUs, sports category
"The winner/loser identification saved us from sinking more ad budget into products that would never be profitable."
E-commerce Analyst
Analyzing 150+ ASINs
Simple, transparent pricing
Start free. Scale when you're ready.
14-day free trial • No credit card required • Cancel anytime
- Profit & loss analytics
- PPC Analytics
- Custom breakdowns
- Buy Box %
- BSR Tracker
- Returns Analytics
- Consolidated Data Exports
- Priority support
Unlimited accounts. Dedicated support.
- Unlimited orders
- Unlimited accounts
- Unlimited team seats
- Advanced User Management System
- Client-first view
- Dedicated account manager
- Custom data exports
- SLA guarantees
Amazon Product Performance Tracker: FAQ
Everything you need to know about tracking product performance on Amazon.
Related solutions
Explore other tools that complement your Amazon selling strategy
Amazon Profit Tracker
Track profit trends over time across your entire portfolio
Amazon Sales Tracker
Track daily, weekly, and monthly sales across all marketplaces
Amazon FBA Analytics Software
Complete FBA analytics with inventory, fees, and profitability
Amazon Seller Dashboard
Centralized dashboard for all your Amazon seller metrics
Know your winners. Cut your losers. Grow what works.
Join 2,000+ Amazon sellers tracking real product performance with Nova. Connect in 5 minutes.