 MCP
MCPNova MCP for Claude goes live in
The bridge that gives Claude context on your reconciled Amazon data.
Amazon Marketplace Analytics: Every Region. One P&L.
Amazon marketplace analytics across 21 regions in a single dashboard. Compare profits, normalize currencies, rank marketplaces by true margin, and make portfolio decisions backed by data. Not spreadsheets.

The problem with managing marketplaces separately
Most sellers treat each Amazon region as an isolated business. That creates blind spots that cost real money.
You log into 5 Seller Central
You log into 5 Seller Central accounts every morning and still can't answer which region is most profitable. Comparing marketplaces requires downloading and merging data from each one.
You convert EUR
You convert EUR, GBP, and JPY in spreadsheets manually. One formula error and your entire P&L is wrong. Currency fluctuations add another layer of margin risk you can't track in real time.
Germany's ad spend is 3x higher
Germany's ad spend is 3x higher than the UK's for half the return. Without cross-marketplace PPC comparison, you burn thousands on underperforming regions before spotting the imbalance.
Your Japan expansion looked promising
Your Japan expansion looked promising in revenue. But after local FBA fees, higher return rates, and currency conversion, it's been underwater for months. Marketplace P&L would have caught it.
What you can compare across marketplaces
Stop treating each Amazon region as a separate business. See your entire portfolio's performance, consolidated and comparable.
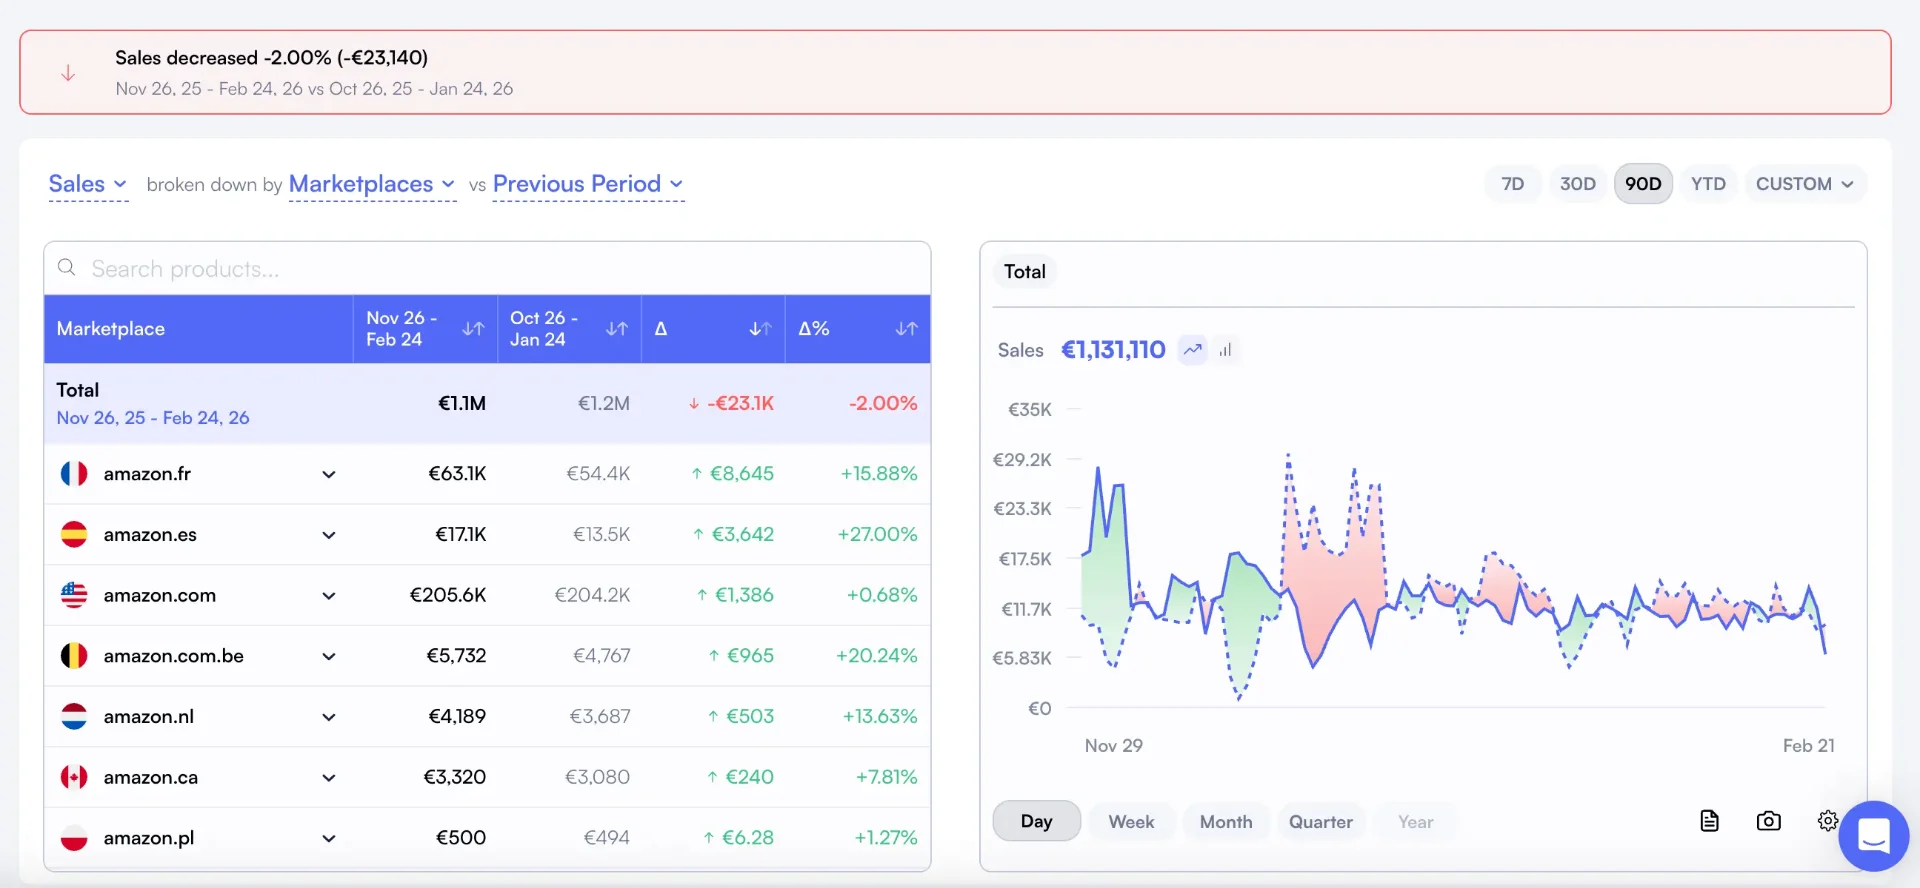
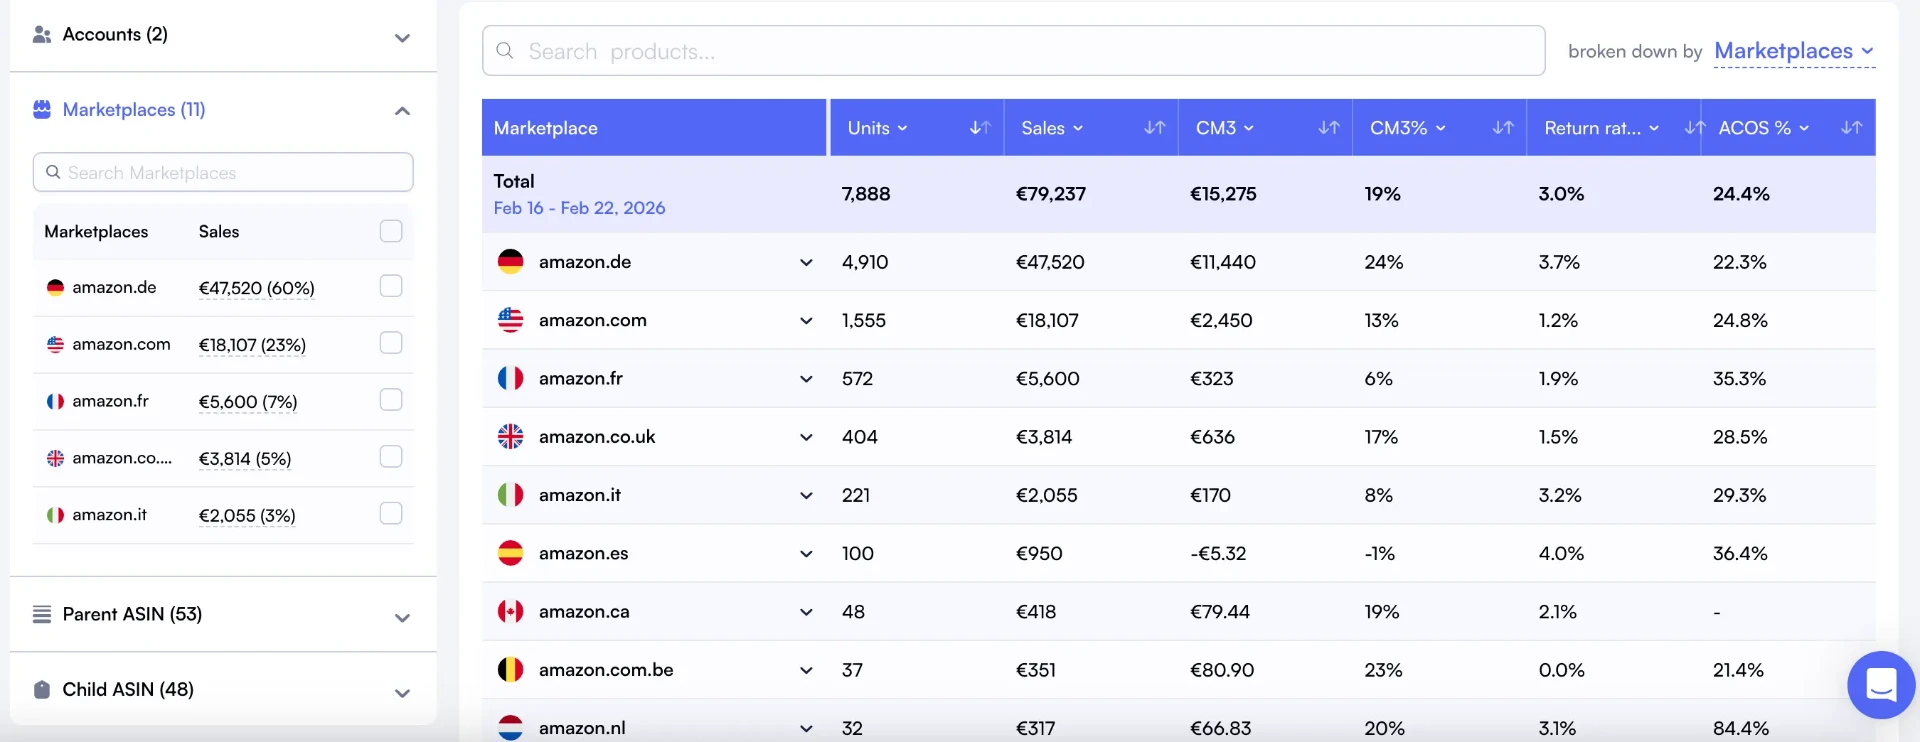
Regional P&L comparison
See true profit per marketplace side by side. Rank regions by contribution margin, not just revenue.
Automatic currency normalization
EUR, GBP, JPY, USD. All converted to your reporting currency in real time.
Portfolio-level trend analysis
Compare growth rates, return rates, and ad efficiency across regions.
Marketplace-specific ad spend
Each region's advertising cost flows into its own P&L automatically.
Consolidated or granular views
Zoom out to your whole portfolio or drill into a single marketplace in one click.
Custom groupings by region
Group marketplaces by geography (EU, NA, APAC) or by brand.
21
Marketplaces
Every Amazon region worldwide in one dashboard.
Auto
Currency Conversion
EUR, GBP, JPY, USD normalized to your base currency.
99.8%
Accuracy
Verified against Amazon Settlement Reports.
Every marketplace P&L on one screen
Drill from portfolio total down to a single ASIN in one click, with fees and currency already normalised.
See Every Marketplace in One View
Connect your Seller Central accounts and compare regional performance instantly. Currencies normalize automatically. Start your 14-day free trial today.
Start Free Trial21 Supported Marketplaces
Single-marketplace vs. cross-marketplace analytics
If you sell in more than one region, single-marketplace tools leave you flying blind.
| Aspect | Single-Marketplace Tools | Cross-Marketplace (Nova) |
|---|---|---|
| Marketplace view | One account at a time, log in and out | All 21 marketplaces in one dashboard |
| Currency handling | Manual conversion in spreadsheets | Automatic normalization to your base currency |
| Regional P&L | Revenue only, no true profit per region | Full P&L per marketplace including fees, COGS, ads |
| Portfolio decisions | Gut feeling on which regions to invest in | Data-driven ranking by contribution margin |
| Trend comparison | Download CSVs, align dates manually | Side-by-side regional trends, any date range |
| Ad spend context | Separate console per marketplace | Integrated into each marketplace's P&L automatically |
Connect All Your Marketplaces in Minutes
No spreadsheets. No manual currency conversion. Just connect and compare.
Link Every Region
Connect your Seller Central accounts for each marketplace. US, EU, Japan, Australia. One secure setup covers all 21 regions.
Currencies Normalize Automatically
Nova converts every marketplace's data into your base currency. Your consolidated P&L is accurate from the first sync.
Compare and Decide
Rank marketplaces by true profit. Spot underperformers. Allocate ad spend where it actually drives margin, not just revenue.
They talk about Nova


Built for Sellers Who Think in Portfolios
Cross-marketplace analytics isn't for everyone. It's for sellers who've outgrown single-region thinking.
Multi-Region FBA Sellers
You sell in 3+ marketplaces and need to know which regions justify the logistics complexity. Nova ranks each marketplace by actual margin so you can double down or pull back with confidence.
Learn how FBA sellers use Nova →Agencies Managing Client Portfolios
Your clients sell across EU and NA. They expect a single report showing regional performance without currency confusion. Nova gives you client-level, marketplace-level P&L in one view.
See the agency solution →Brand Managers Expanding Internationally
You're evaluating whether to launch in Japan, Australia, or the Middle East. Nova shows you exactly how existing marketplaces perform so you can model new launches against real data.
Explore brand manager tools →What Is Amazon Marketplace Analytics?
Amazon marketplace analytics is the practice of collecting, comparing, and acting on seller data across multiple Amazon regions. Instead of viewing each marketplace in isolation, it consolidates revenue, fees, advertising costs, COGS, and returns from every region into a unified view that enables portfolio-level decision-making.
The core challenge for multi-marketplace sellers is that Amazon Seller Central treats each region as a completely separate account. You can't compare US performance to Germany's in a single view. You can't see which marketplace drives the highest margin after accounting for region-specific fees and ad costs. And you certainly can't normalize currencies across regions without manual spreadsheet work.
Cross-marketplace analytics tools like Nova solve this by connecting all your Seller Central accounts into a single dashboard with automatic currency normalization and unified P&L reporting. You can rank regions by contribution margin, compare growth trajectories, and make data-backed decisions about where to invest your expansion budget.
Why Sellers Choose Nova for Marketplace Analytics
"We sell on 5 Amazon marketplaces. Nova is the only tool that gives us a unified view of profit across all of them."
International Seller
5 marketplaces, $800K/month combined
"Cross-marketplace comparison showed us that DE was our most profitable market, not the US. We shifted budget accordingly."
EU Brand Manager
Selling in US, UK, DE, FR, IT
Simple, transparent pricing
Start free. Scale when you're ready.
14-day free trial • No credit card required • Cancel anytime
- Profit & loss analytics
- PPC Analytics
- Custom breakdowns
- Buy Box %
- BSR Tracker
- Returns Analytics
- Consolidated Data Exports
- Priority support
Unlimited accounts. Dedicated support.
- Unlimited orders
- Unlimited accounts
- Unlimited team seats
- Advanced User Management System
- Client-first view
- Dedicated account manager
- Custom data exports
- SLA guarantees
Amazon Marketplace Analytics: Frequently Asked Questions
Everything you need to know about cross-marketplace analytics with Nova.
Related solutions
Explore other tools that complement your Amazon selling strategy
Amazon Profit Tracker
Track profit trends over time across your entire portfolio
Amazon Sales Tracker
Track daily, weekly, and monthly sales across all marketplaces
Product Performance Tracker
Track every product's sales, margins, and ranking over time
Amazon FBA Analytics Software
Complete FBA analytics with inventory, fees, and profitability
Stop Managing Marketplaces Blindly.
Join 2,000+ Amazon sellers who use Nova to compare regional performance. Connect your marketplaces in minutes, see your portfolio's true P&L today.