The difference between a 2.5x and 4.5x exit multiple often comes down to clean analytics. Learn the 12-month preparation checklist, 7 metrics acquirers scrutinize, and how accurate P&L tracking adds 0.3-0.8x to your valuation.
The difference between a 2.5x and 4.5x exit multiple often comes down to one thing: clean analytics. Acquirers pay premiums for businesses they can audit quickly and trust completely. This guide shows you exactly how to prepare your Amazon business for a successful exit using data-driven preparation.
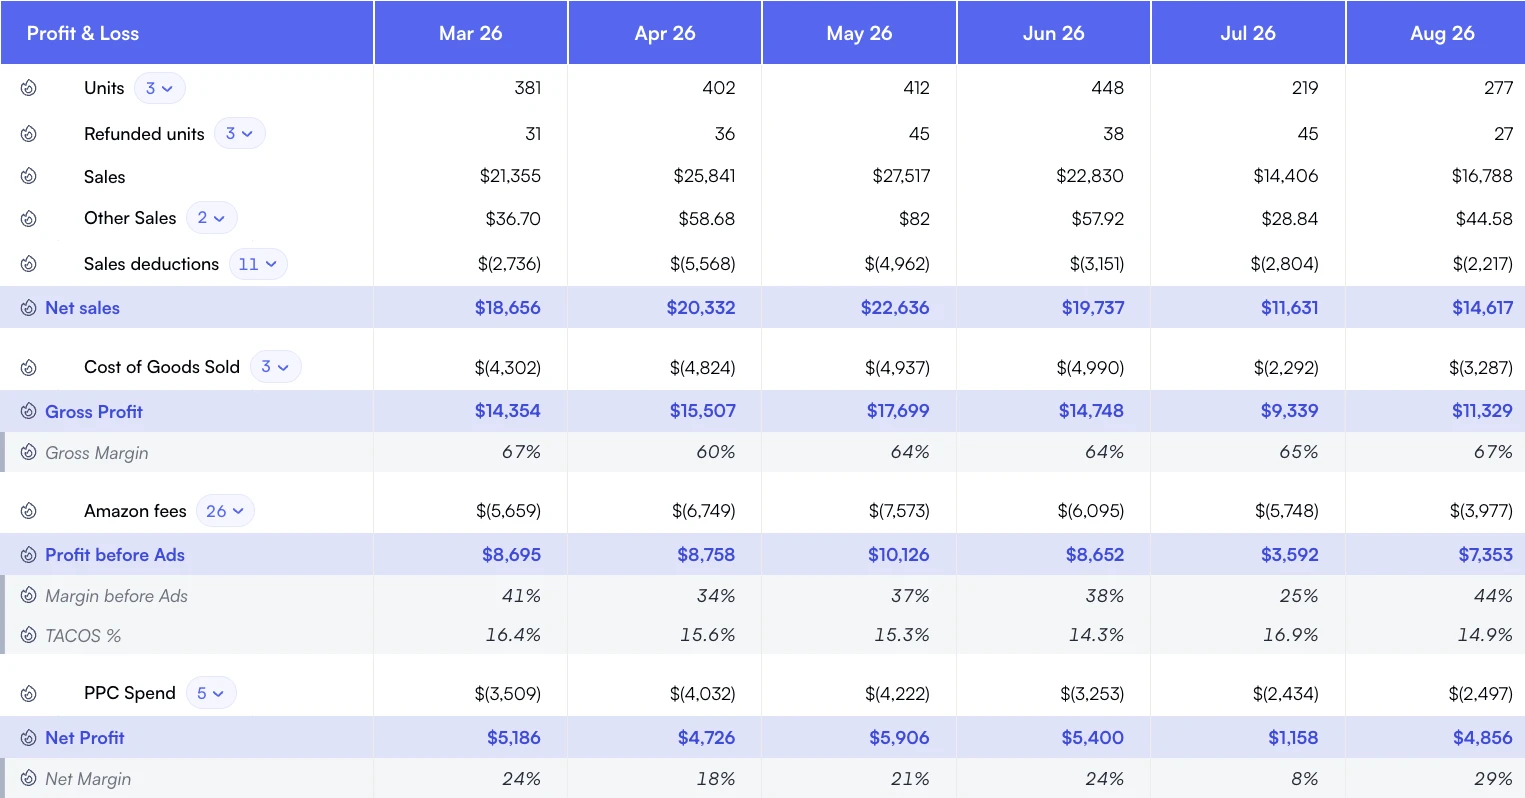
Read sales alongside every cost layer to see how much profit remains.
We've worked with sellers who've exited for $2M+ and those whose deals fell apart during due diligence. The pattern is clear. Sellers with organized, accurate financial data close faster and at higher multiples. Those with messy spreadsheets and manual calculations watch buyers walk away.
Here's the timeline: start preparing 12-18 months before your target exit. The work you do now determines whether you're negotiating from strength or desperation.
Why Clean Analytics Drive Higher Multiples
Amazon FBA businesses typically sell for 2.5x to 5x annual seller discretionary earnings (SDE). According to Empire Flippers marketplace data, the range depends heavily on business quality signals. Clean financials are the number one quality signal buyers look for.[1]
Think about it from the buyer's perspective. They're investing hundreds of thousands (or millions) in a business they don't fully understand yet. Every hour spent reconciling your numbers is an hour questioning whether the deal makes sense.
The multiple math is compelling: A $400K SDE business at 3x sells for $1.2M. At 4x, it's $1.6M. That's a $400,000 difference. Clean analytics typically add 0.3x to 0.8x to your multiple. On a $400K SDE business, that's $120K to $320K in your pocket.
Quiet Light Brokerage analysis shows that businesses with audit-ready financials sell 40% faster than those requiring extensive due diligence cleanup.[2] Speed matters because deals die in delays.
The 7 Financial Metrics Acquirers Scrutinize
Every sophisticated buyer runs the same playbook during due diligence. They're looking for consistency, accuracy, and trends. Here's what they examine:
1. True Net Profit Margin
15-25%
Healthy range after ALL expenses
2. Revenue Trend (YoY)
20%+
Growth commands premium multiples
3. TACoS Stability
10-15%
Shows sustainable ad dependency
4. SKU Concentration
<40%
Top SKU share of revenue (diversified)
The Complete Metrics List
True Net Profit Margin: Not gross margin. Net profit after COGS, FBA fees, advertising, returns, software, and overhead. Buyers verify this against bank deposits.
Revenue Trend: 24-month trailing data showing growth trajectory. Declining businesses sell at 1.5-2x, growing businesses at 3.5-5x.
TACoS (Total Advertising Cost of Sale): shows how dependent you are on paid traffic. Rising TACoS with flat revenue is a red flag.
SKU Concentration Risk: If one SKU drives 60%+ of profits, buyers discount heavily. Diversification de-risks the business.
Return Rate by Product: High returns signal quality or listing issues. Buyers want under 5% for most categories.
Inventory Health: sell-through rates, aged inventory percentage, and IPI score. Dead inventory is a liability transfer.
Customer Acquisition Cost: How much do you spend to acquire each new customer? Trending up or down?
12-Month Exit Preparation Checklist
Start this process at least 12 months before you plan to list. Some items take time to show results. Rushed preparations lead to lower valuations.[3]
Months 12-10: Foundation
Implement product-level P&L tracking (not just account-level)
Set up automated COGS tracking with supplier invoices
Reduce hero SKU dependency to under 40% of revenue
Clear aged inventory before it hits your numbers
Address high-return products (fix or remove)
Months 6-4: Documentation
Compile 24 months of clean P&L statements
Document all SOPs for operations and advertising
Organize supplier contracts and agreements
Prepare brand registry and IP documentation
Create cash flow projections with realistic assumptions
Months 3-1: Final Preparation
Reconcile all financial data against Seller Central
Prepare due diligence data room
Create executive summary of business performance
Identify and document growth opportunities for buyers
Brief your team (if applicable) on transition plans
How Accurate P&L Creates Audit-Ready Reports
Buyers don't trust seller-provided P&Ls without verification. They'll cross-reference your claimed profits against Amazon settlement reports, bank statements, and supplier invoices. Any discrepancy raises questions about what else might be wrong.
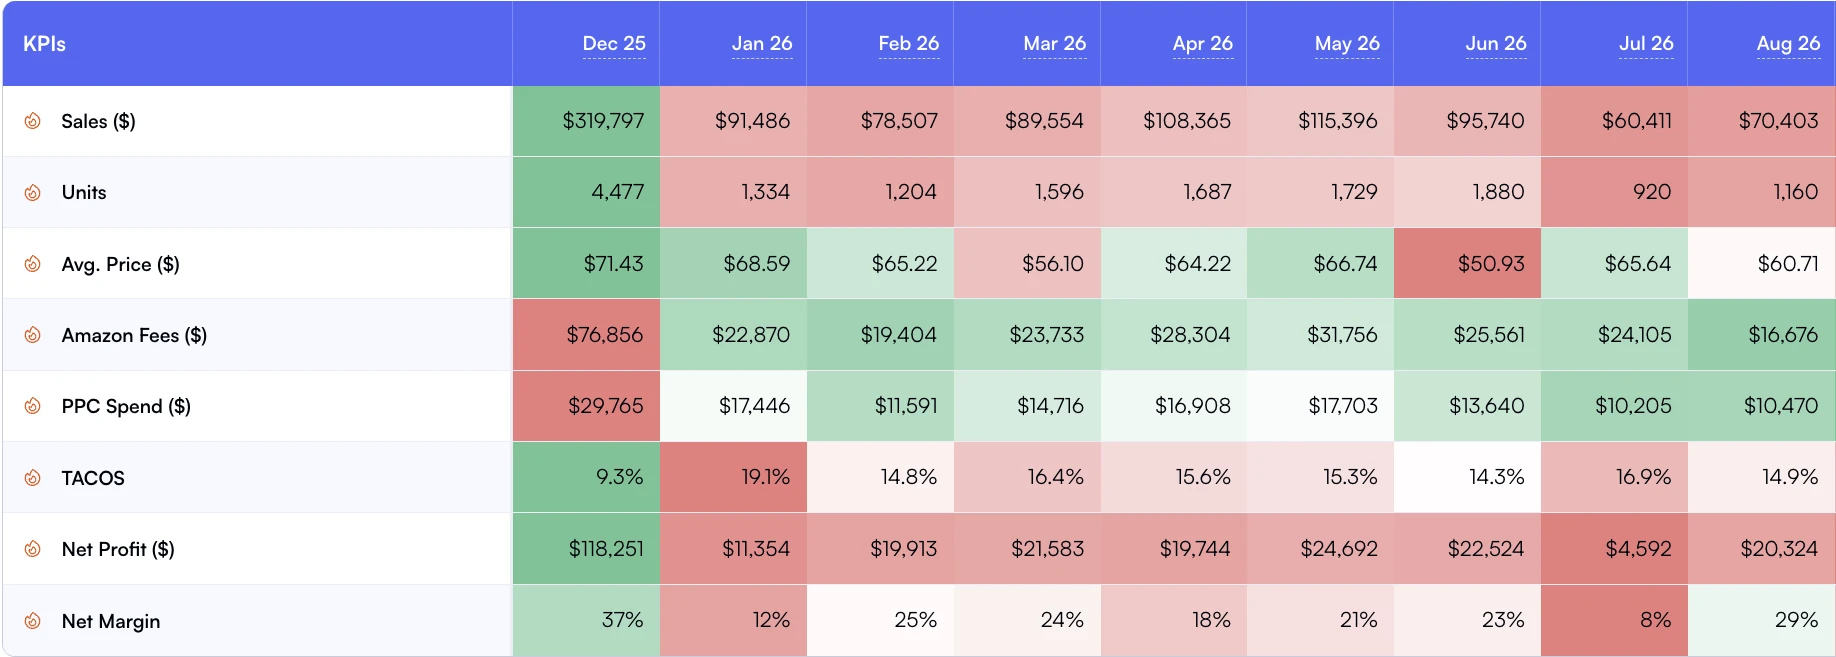
Monthly trends show whether sales growth is keeping pace with profit.
The challenge: Amazon's reports don't match reality. Amazon's settlement reports contain timing differences, missing fees, and categorization issues that make reconciliation difficult.[4]
Deal killer warning: profit discrepancies can undermine buyer trust, regardless of their size. If your numbers don't tie out perfectly, buyers assume there's more you're hiding or don't understand.
What audit-ready means in practice:
99%+ accuracy: your P&L matches bank deposits within 1% every month
COGS documentation: every purchase order tied to landed cost per unit
Fee breakdown: FBA fees, referral fees, advertising broken out clearly
Adjustment trail: any manual adjustments documented with reasoning
Historical consistency: same methodology applied across all periods
Tools like Nova's P&L analytics automate this reconciliation process, pulling data directly from Amazon's API and maintaining 99.5% accuracy. This eliminates the manual spreadsheet errors that plague most seller financials.
Case Study: Brand Increased Exit Multiple by 0.8x
A home goods brand approached us 14 months before their target exit. Initial assessment showed classic problems: spreadsheet-based tracking, inconsistent COGS allocation, and no product-level profitability visibility.
Metric
Before
After 12 Months
Impact
Reported Net Margin
18%
22%
Found hidden costs, then optimized
P&L Accuracy
~85%
99.3%
Automated reconciliation
Top SKU Revenue Share
52%
34%
Launched complementary products
TACoS
19%
13%
Optimized spend efficiency
Due Diligence Time
Estimated 6-8 weeks
3 weeks
Clean data room
The result: initial broker valuation was 3.1x SDE. After 12 months of preparation, they sold at 3.9x. On their $480K SDE, that 0.8x improvement meant an additional $384,000 at closing.
Key insight: during preparation, they discovered two SKUs were actually losing money after all costs. Eliminating them improved margins by 4 points. They would never have found this without product-level analytics. The exit preparation process itself made the business more valuable.
Tools for Exit-Ready Analytics
Manual spreadsheets won't cut it for serious exits. Buyers expect professional-grade reporting. Here's what you need:
Essential Capabilities
Automated P&L generation: Daily updates from Amazon API, not manual exports
Product-level profitability: True margin for every SKU including all fees
COGS tracking: per-unit costs with landed cost calculations
Historical data: at least 24 months of clean, comparable data
Export capability: Easy export for due diligence sharing
Nova's analytics platform was built with exit preparation in mind. The hourly data refresh and 99.5% accuracy give buyers confidence in the numbers. The custom analytics dashboards let you create exactly the reports acquirers want to see.
Professional analytics tools are now table stakes for exits above $500K.[5]
Red Flags That Kill Deals
Buyers have seen every trick. They know what to look for. Avoid these deal-killers:
Inconsistent data: Different numbers in different documents
Missing COGS: "We estimate costs at 30%" doesn't work
Declining organic rank: Rising TACoS with flat sales
Account health issues: Policy violations, IP complaints
Supplier concentration: Single supplier creates risk
Trademark gaps: Incomplete brand protection
Frequently asked questions
Start 12-18 months before your target exit date. Some optimizations (like reducing SKU concentration) take time to show in your numbers. Rushing preparation typically costs 0.3-0.5x in multiple.
Most Amazon FBA businesses sell for 2.5x to 4.5x SDE. Factors include: growth trajectory, profit margins, brand strength, diversification, and operational complexity. Clean analytics typically add 0.3-0.8x to your baseline multiple.
For businesses under $500K, you can potentially sell directly through marketplaces. Above $500K, a broker typically adds value through buyer networks and negotiation expertise. Above $2M, M&A advisors become relevant.
They cross-reference your P&L against Amazon settlement reports, bank statements, and supplier invoices. They'll request API access to pull data directly. Any discrepancy triggers deeper investigation.
Be transparent about when you implemented proper tracking. Show clean data from that point forward. Buyers accept this if you demonstrate current systems are solid. Don't try to retroactively "clean up" old numbers.
Start Preparing Today
Exit preparation isn't just about selling. The same analytics rigor that commands premium multiples also makes your business more profitable while you're running it. Sellers who implement proper P&L tracking typically find 5-15% in hidden costs they can eliminate.
Whether you're planning to exit in 18 months or 5 years, clean analytics is an investment that pays dividends now and compounds at sale time. Start with product-level P&L tracking, document your COGS properly, and build the foundation that buyers will pay premium multiples for.