Amazon launched a Custom Analytics Dashboard in late 2025. But there's a catch: no advertising data. If you're running PPC campaigns, Amazon's free tool shows half the picture. This guide compares Amazon's native dashboard against specialized tools like Nova.
Amazon quietly launched a Custom Analytics Dashboard in late 2025. For the first time, sellers can build custom reports inside Seller Central. But there's a catch: no advertising data. If you're running PPC campaigns, Amazon's free tool shows half the picture. This guide breaks down exactly what Amazon offers, where it falls short, and when third-party tools like Nova deliver better ROI.
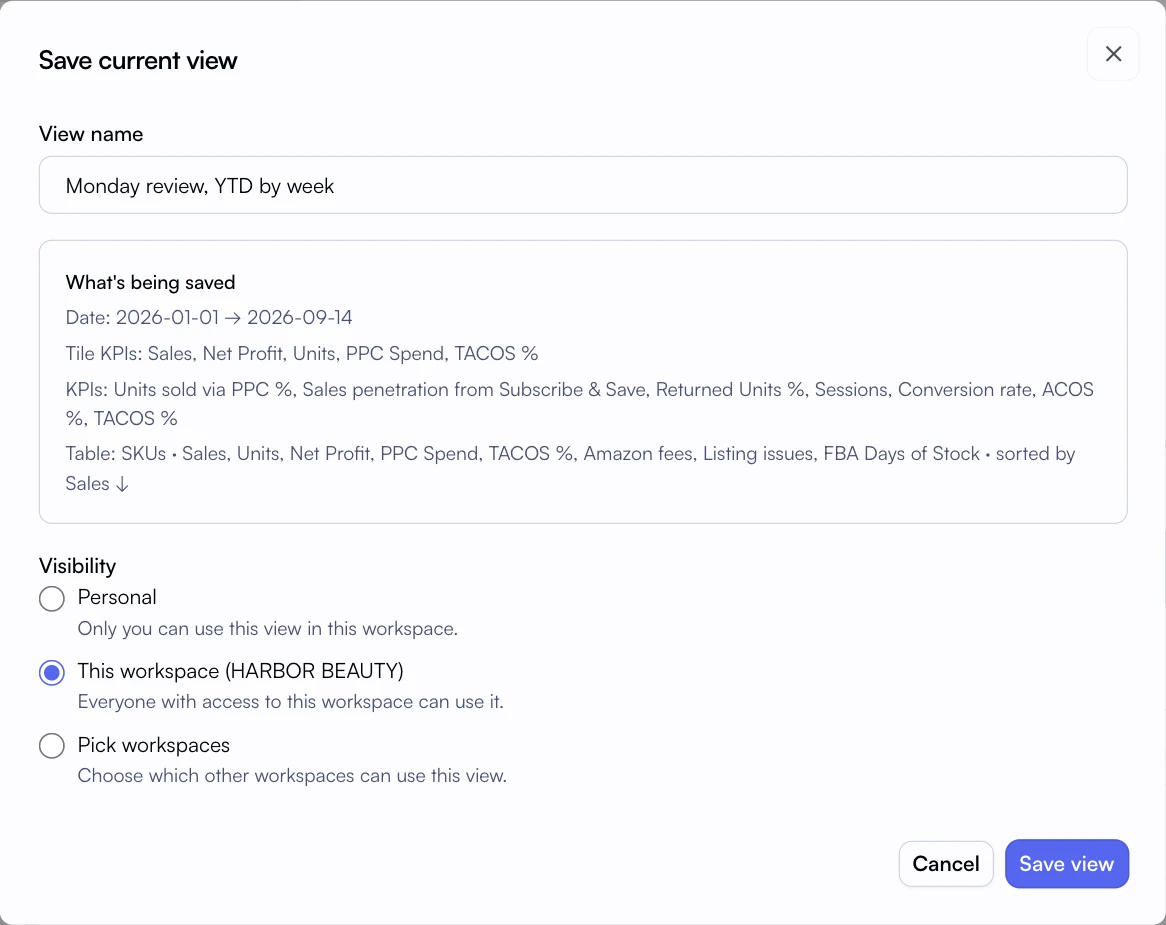
Saving a view keeps the same KPIs and columns ready for the next review.
We've tested Amazon's new Custom Analytics Dashboard extensively against specialized tools. The verdict? It's a solid starting point for new sellers. But for anyone spending $5K+ monthly on ads, the missing PPC data creates a TACoS blind spot that costs real money.
Let's break down exactly what you get with each option and help you decide which approach fits your business.
Key Takeaways
Amazon's Custom Analytics: Free, 100+ metrics, but zero advertising data
The TACoS Problem: you can't optimize ad spend without seeing ads + sales together
Decision Point: Use Amazon's tool under $100K/month with minimal PPC; upgrade above
Amazon's New Custom Analytics Dashboard (Late 2025)
Amazon's Custom Analytics feature launched quietly in late 2025, giving sellers the ability to build custom reports for the first time. The dashboard offers pre-built templates and customizable tiles1.
What Amazon Now Offers for Free
The new dashboard includes legitimate functionality that didn't exist before:
100+ metrics available across sales, inventory, and customer data
Pre-built templates: Prime Day Recap, Coupons & Deals Performance, Sales & Pricing Trends
Custom report builder: Up to 20 metrics per tile, 18 tiles per report
Visual flexibility: Line charts, bar charts, tables, and KPI cards
Date range controls: Compare periods, set custom ranges
For sellers who previously relied on downloading CSVs and building spreadsheets, this is a meaningful upgrade. You can finally see trends without manual data manipulation.
What Amazon Got Right
The template library is genuinely useful. The Prime Day Recap template alone saves hours of post-event analysis. And the visual builder is intuitive enough that non-technical sellers can create useful dashboards in minutes.
The Critical Gap: No Advertising Data
Here's the problem Amazon doesn't advertise: the Custom Analytics Dashboard contains zero advertising metrics. No ACoS, no ROAS, no ad spend, no TACoS.
Why does this matter? Because for most sellers, advertising and organic sales aren't separate businesses. They're interconnected. The average Amazon seller spends 15-25% of revenue on advertising2. That spending directly impacts organic rank, which affects organic sales.
Without advertising data in your custom dashboards, you can't answer questions like:
Which products have healthy TACoS vs. Which are bleeding money?
Is my ad spend increasing organic velocity or just buying sales?
What's my true customer acquisition cost by product?
How do my margins look after ad costs?
The TACoS Blind Spot
TACoS (Total Advertising Cost of Sale) is the single most important metric for advertising efficiency. It shows ad spend as a percentage of total revenue. Amazon's Custom Analytics can't calculate it because it doesn't have access to advertising data. You're flying blind on your biggest controllable expense.
Other Limitations Worth Knowing
Limitation
Impact
Who It Affects
Single marketplace only
Can't consolidate US + EU + UK data
International sellers
No custom product segmentation
Can't group by brand, lifecycle, profitability tier
Portfolio managers, agencies
Daily data refresh
No real-time decision making
High-volume sellers, deal days
No team sharing
Can't create views for different roles
Teams with dedicated PPC/ops roles
No COGS integration
Can't see true profit margins
Anyone tracking actual profitability
When Amazon's Native Tool Is Enough
Amazon's Custom Analytics Dashboard works well for specific seller profiles. You don't need third-party tools if:
Amazon's Dashboard Is Sufficient When:
Revenue under $100K/month: Complexity doesn't justify tool costs
Minimal PPC spend: under 10% of revenue on advertising
Single marketplace: only selling on Amazon US
Simple catalog: under 50 SKUs with clear categories
Solo operation: No team needing different dashboard views
If this describes your business, start with Amazon's free tool. It's genuinely useful and costs nothing. You can always upgrade later when complexity increases.
When You Need a Third-Party Custom Analytics Tool
The math changes quickly as your business grows. Here are the triggers that signal it's time to upgrade:
PPC Advertisers Need Integrated Data
If you're spending $5,000+ monthly on advertising, the TACoS blind spot costs more than any analytics tool. Sellers who track TACoS at the product level improve advertising ROI by 23% on average3.
The calculation is simple: if you're spending $60K annually on ads, a 23% efficiency improvement saves $13,800. That's 10x+ ROI on any analytics investment.
Multi-Marketplace Sellers Need Consolidation
Running separate dashboards for US, UK, Germany, and Japan isn't just inconvenient. It hides cross-marketplace patterns. Products failing in one region might be cannibalizing success in another. Currency fluctuations affect true profitability. Without consolidated views, you're making regional decisions without global context.
Teams Need Shared, Real-Time Dashboards
Your PPC manager cares about different metrics than your operations lead. Your CFO wants different views than your catalog manager. Amazon's tool creates one dashboard per account. Third-party tools let you build role-specific views that update in real-time.
Portfolio Owners Need Custom Segmentation
Here's where Custom Breakdowns becomes essential. Amazon categories don't match your business reality. You need to segment by:
Product lifecycle: New launches, growth phase, mature, decline
Profitability tier: High margin, break-even, loss leaders
Brand: If managing multiple brands in one account
Supplier: track performance by manufacturing source
Investment priority: Hero products vs. Long-tail
Amazon's dashboard uses Amazon's categories. Custom Breakdowns lets you create drawers that match your actual business structure.
Feature Comparison: Amazon vs. Nova Custom Analytics
Here's a detailed breakdown of what each platform offers. We're comparing Amazon's native Custom Analytics Dashboard against Nova's Custom Analytics with Custom Breakdowns.
Feature
Amazon Native
Nova Custom Analytics
Price
Free
Included in Nova plans
Sales metrics
100+ metrics
371 metrics
Advertising data (ACoS, ROAS, TACoS)
Not available
Full PPC integration
COGS & profit margins
Not available
Full P&L tracking
Data refresh rate
Daily
in real time
Multi-marketplace
Single marketplace
Consolidated view
Custom product segmentation
Amazon categories only
Custom Breakdowns
Widget builder
Basic (20 metrics/tile)
Advanced (unlimited)
Pre-built templates
5 templates
25+ templates
Team sharing
Not available
Role-based views
Automated alerts
Not available
Not available
Data export
CSV
CSV, API, warehouse delivery
Nova Custom Analytics: What Amazon's Dashboard Can't Do
Let's dig deeper into the capabilities that separate third-party custom analytics from Amazon's native offering.
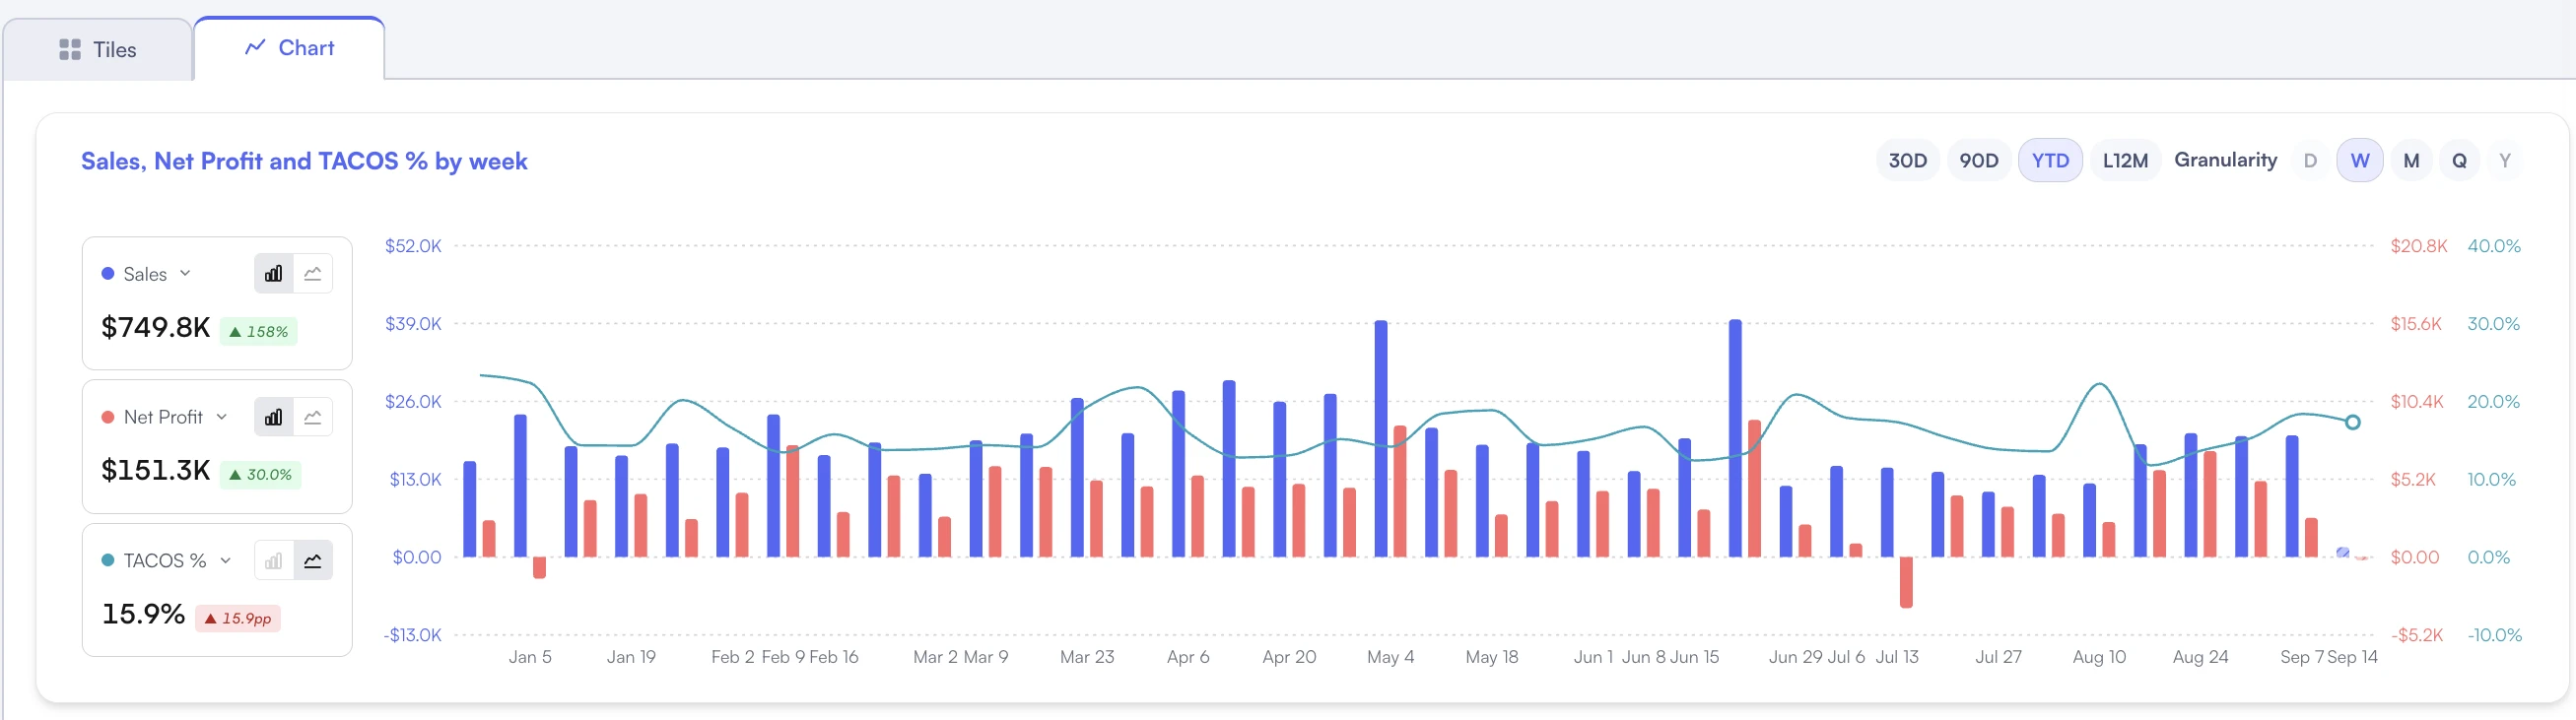
Weekly sales, profit and TACOS connect dashboard trends to advertising pressure.
PPC Performance Widgets Built-In
Nova's Custom Analytics beta includes advertising data by default. Every widget can include:
TACoS by product, brand, or custom segment
ACoS trends alongside organic sales
Ad spend vs. Total revenue over time
ROAS by campaign type (SP, SB, SD)
Advertising contribution to total sales
This isn't separate from your sales data. It's unified in the same dashboard, same widgets, same filters. When you filter by a Smart Tag like "Hero Products," you see sales, margins, AND advertising performance together.
Pro Tip: The TACoS Widget
Build a TACoS trend widget that shows the last 90 days by product. Sort by highest TACoS. You'll immediately see which products are burning ad budget without sufficient sales velocity. This single view has helped sellers cut wasteful ad spend by 15-30%.
Real-time sales (Not Daily)
Amazon's dashboard updates daily. Nova receives orders and units in real time. The difference matters most during:
Prime Day / Deal Days: Real-time decisions on ad spend adjustments
Product launches: Monitor velocity and make same-day optimizations
Stock-out prevention: Catch velocity spikes before inventory depletes
PPC bid adjustments: Respond to performance changes within hours, not days
For high-volume sellers, the 24-hour delay in Amazon's dashboard means decisions are always based on yesterday's data.
Custom Breakdowns: Segment P&L by Any Dimension
This is the feature that transforms custom analytics from "nice to have" to "essential." Custom Breakdowns lets you create custom product segments that Amazon's categories can't replicate.
Step 1: Create Custom Drawers
Define segmentation dimensions that match your business: Brand Manager, Product Lifecycle, Profitability Tier, Supplier, Investment Priority.
Step 2: Tag Your Products
Assign each SKU to relevant tags. A product can be "Hero Product" + "High Margin" + "Supplier A" simultaneously.
Step 3: Filter Dashboards
Every custom widget automatically supports Smart Tag filters. See P&L for just your "Growth Phase" products.
Step 4: Segment Analysis
Build widgets that compare segments. "Hero Products" TACoS vs. "Long Tail" TACoS in one chart.
The power is in the combination. Custom widgets + Custom Breakdowns = dashboards that answer YOUR questions, not Amazon's generic templates.
Multi-Marketplace in One View
For international sellers, Nova consolidates all marketplaces into unified dashboards:
Currency normalization: see all revenue in your base currency
Cross-market comparison: same product, different regions, one chart
Consolidated P&L: True global profitability, not marketplace fragments
Market-specific filters: Drill into individual regions when needed
Try Nova's Custom Analytics Beta
Build dashboards with PPC data, Custom Breakdowns, and real-time sales data. See what Amazon's tool is missing.
Case Study: How a $2M Seller Combines Both Tools
Let's look at a real scenario. A home goods brand doing $2M annually faced a common challenge: their PPC manager used Amazon Ads Console, their finance team used spreadsheets, and their ops lead used Seller Central. Nobody had unified visibility.
Monthly Revenue
$167K
Average monthly sales
Ad Spend
$28K
17% of revenue on PPC
SKU Count
127
Across 4 product lines
The Problem: Siloed Data, Slow Decisions
Before implementing integrated custom analytics:
6 hours weekly spent compiling data from multiple sources
No TACoS visibility at the product level
Advertising decisions made without margin context
Product segmentation Done manually in Excel
Performance reviews Always used stale data (3-5 days old)
The Hidden Cost
They discovered 12 SKUs with TACoS above 35% that were actually losing money after COGS. These products looked profitable in Seller Central (positive gross margin) but were underwater after advertising costs. Without unified data, they'd been feeding money into a loss.
The Solution: Custom Dashboards with Custom Breakdowns
They implemented Nova's Custom Analytics with the following structure:
Created 4 Custom Breakdown groups: Product Line, Lifecycle Stage, Margin Tier, Ad Strategy
Established weekly review cadence: Check TACoS, margin, and velocity in Winners & Losers every Monday
Weekly review cadence: Monday dashboard review with all stakeholders
The Results: 4 Hours Saved, $45K Found
Time Saved
4 hrs/week
Eliminated manual reporting
Ad Waste Eliminated
$45K/year
Paused unprofitable campaigns
TACoS Improvement
17% → 14%
Better budget allocation
The key insight: they didn't abandon Amazon's native tools. They still use Amazon's Custom Analytics for quick sales checks. But strategic decisions happen in Nova where advertising and profitability data combine.
Key Learning
"The moment we could see TACoS by product lifecycle stage, everything changed. Our 'Growth Phase' products should have high TACoS. Our 'Mature' products shouldn't. We were treating them the same." - Brand Operations Manager
Which Tool Should You Choose?
Here's a decision framework based on business characteristics:
TACoS visibility pays for itself; time savings compound
$500K+/month, multi-marketplace
Third-Party + Warehouse
Need consolidated data, team views, and deep analysis capability
Agency managing multiple brands
Third-Party Essential
Client reporting, brand comparison, portfolio management require it
Aggregator (10+ brands)
Enterprise Solution
Need API access, warehouse delivery, custom segmentation at scale
FAQ: Amazon Custom Analytics
Frequently Asked Questions
Is Amazon's Custom Analytics Dashboard free?
Yes, it's included for all Professional Seller accounts at no additional cost. You can access it through Seller Central under Reports.
Why doesn't Amazon include advertising data?
Amazon Ads and Seller Central are separate platforms with different data infrastructures. The Custom Analytics Dashboard pulls from Seller Central data only. This is a structural limitation, not a feature choice.
Can I use Amazon's tool and a third-party tool together?
Absolutely. Many sellers use Amazon's free dashboard for quick daily checks and third-party tools for strategic analysis. They serve different purposes and complement each other.
How does Custom Breakdowns differ from Amazon categories?
Amazon categories are fixed and product-type based. Custom Breakdowns lets you create business-logic segments like "Hero Products," "Liquidation," or "Q4 Launch." You define the dimensions that matter to your strategy.
What's the ROI on a third-party analytics tool?
For PPC-heavy sellers ($5K+/month ad spend), the TACoS visibility alone typically saves 15-25% of wasted ad spend. For a $60K annual ad budget, that's $9K-$15K in savings, far exceeding tool costs.
How long does it take to set up custom dashboards?
Amazon's native tool takes 30-60 minutes to configure basic dashboards. Nova's Custom Analytics beta includes pre-built templates that work immediately, with custom configuration taking 1-2 hours for most sellers.
Does Nova support Vendor Central (1P) sellers?
Yes. Nova supports both Seller Central (3P) and Vendor Central (1P) data, with unified dashboards that combine both when needed.
Can I export data from Nova to my data warehouse?
Yes. Nova offers direct data delivery to BigQuery, Snowflake, and Redshift with orders and units arriving in real time. This powers custom BI dashboards in Tableau, Looker Studio, or Power BI.
Next Steps
Amazon's Custom Analytics Dashboard is a welcome addition to Seller Central. For new sellers and those with minimal advertising spend, it's genuinely useful and costs nothing.
But for sellers running significant PPC campaigns, managing multiple marketplaces, or needing custom product segmentation, the limitations become costly. The TACoS blind spot alone can cost thousands monthly in wasted ad spend.
The good news: you don't have to choose one or the other. Use Amazon's free tool for quick checks. Use specialized tools like Nova for strategic decisions where advertising and profitability data need to combine.
Ready to Transform Your Amazon Business?
Join thousands of successful sellers who use Nova Analytics to make data-driven decisions and maximize their profits.