Seller Central's built-in reports are rigid. Custom dashboards flip that script. This guide walks you through four approaches to custom Amazon dashboards, from Amazon's free tool to enterprise solutions, with step-by-step Smart Tagging tutorials.
Seller Central's built-in reports are rigid. You get what Amazon gives you. Custom dashboards flip that script. You define the metrics, the layout, the refresh rate. This guide walks you through four approaches to custom Amazon dashboards, from free to enterprise, with step-by-step setup instructions for each level.
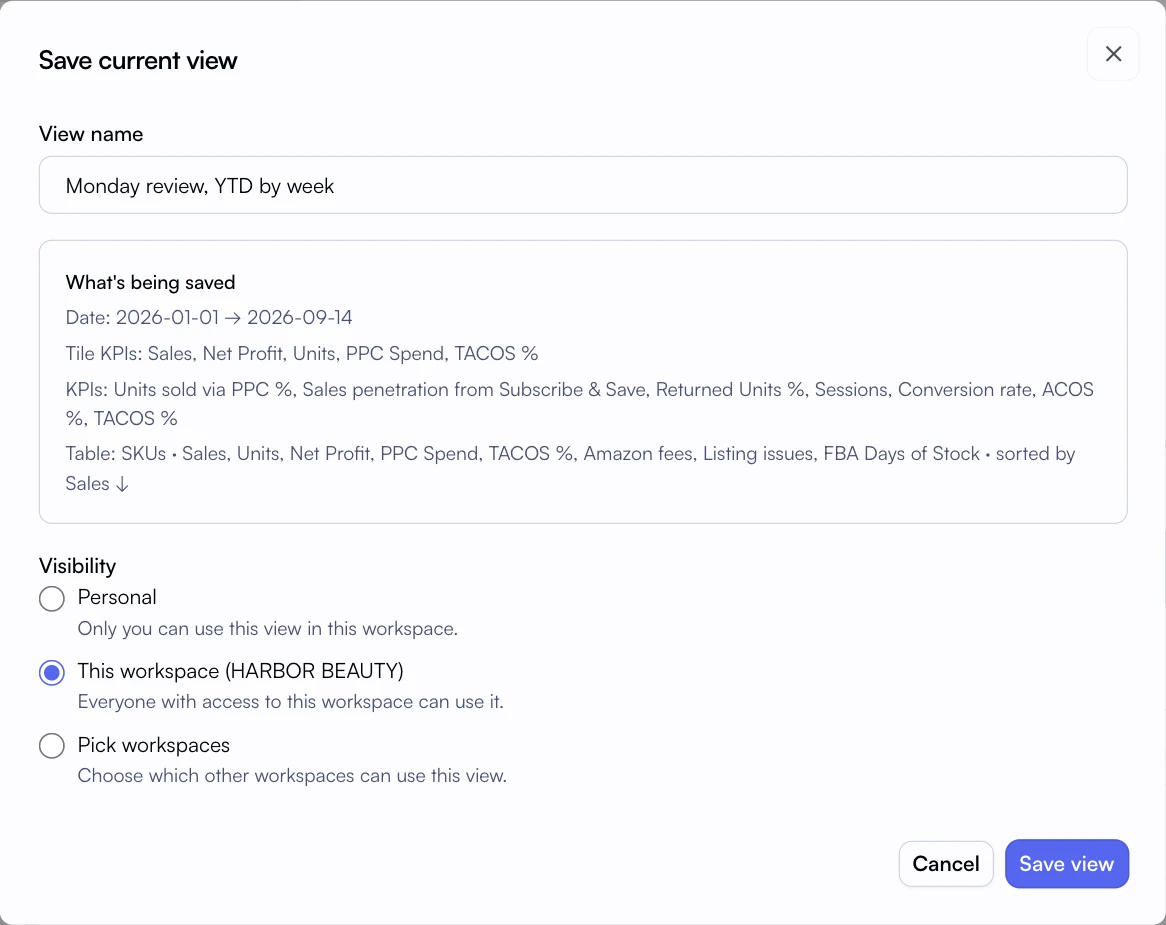
Saving a view keeps the same KPIs and columns ready for the next review.
We've helped hundreds of sellers build custom analytics. The pattern is clear: sellers who invest 2-3 hours building custom dashboards save 4-6 hours weekly on manual reporting. More importantly, they catch problems faster and make better decisions.
Let's build your perfect dashboard setup, starting wherever you are today.
What You'll Learn
4 Dashboard Approaches: from Amazon's free tool to enterprise warehouse solutions
Step-by-Step Setup: Practical instructions for each maturity level
Custom Breakdowns Tutorial: Create custom product segments that Amazon can't
Template Library: Dashboard layouts by business type (FBA seller, agency, aggregator)
The Dashboard Maturity Model
Not every business needs the same analytics infrastructure. A $50K/month seller has different needs than a $5M aggregator. Here's how dashboard complexity maps to business stage:
Level
Approach
Best For
Setup Time
Level 1
Amazon Native Custom Analytics
New sellers, minimal PPC
30-60 min
Level 2
Spreadsheet + Manual Export
Budget-conscious sellers
2-4 hours
Level 3
BI Tools (Looker Studio, Tableau)
Data teams, complex analysis
1-2 weeks
Level 4
Specialized Platforms (Nova)
Growth sellers, agencies, aggregators
1-2 hours
Most sellers should skip Level 2 and 3 entirely. The time investment for spreadsheets and BI tools rarely pays off compared to specialized solutions. But let's cover each option so you can make an informed choice.
Level 1: Amazon's Free Custom Analytics
Amazon launched Custom Analytics in late 2025. It's free, built into Seller Central, and surprisingly capable for basic use cases1.
Step-by-Step Setup
Access the Dashboard: Navigate to Reports → Business Reports → Custom Analytics in Seller Central
Choose a Template: Start with "Overall Business Performance" for a balanced view
Add Tiles: Click "Add Tile" and select metrics. Start with Units Sold, Revenue, and Sessions
Configure Visualization: Choose between line chart, bar chart, or KPI card for each tile
Set Date Range: Default to "Last 30 Days" with "Compare to Previous Period"
Save Dashboard: Name it clearly (e.g., "Daily Performance Overview")
Best Templates to Start With
Prime Day Recap: Pre-built for promotional analysis
Sales & Pricing Trends: Revenue and pricing correlation
Within 2-3 weeks of using Amazon's Custom Analytics, most sellers hit these walls:
No advertising data: can't see ACoS, ROAS, or TACoS alongside sales
No COGS: Revenue without costs isn't profit visibility
Single marketplace: US data only, no EU/UK consolidation
Daily refresh: yesterday's data, not today's decisions
For sellers under $100K/month with minimal PPC, these limitations are acceptable. Above that threshold, they become expensive blind spots.
Level 2: Spreadsheet Dashboards (Skip This)
Some sellers try to build custom dashboards in Google Sheets or Excel by downloading reports and creating pivot tables. We don't recommend this approach.
Why Spreadsheets Fail for Amazon Analytics
Manual data entry: 2-4 hours weekly downloading and formatting reports
Stale data: by the time you update, data is 2-3 days old
Error-prone: Copy-paste mistakes corrupt analysis
Doesn't scale: Works for 10 SKUs, breaks at 100+
No automation: every insight requires manual work
The hours spent maintaining spreadsheets costs more than any analytics tool subscription. Skip this level unless you have zero budget and significant free time.
Level 3: BI Tools (Looker Studio, Tableau, Power BI)
For sellers with data engineering resources, connecting Amazon data to BI tools creates powerful visualization capabilities. But the setup is substantial.
What You Need
Data warehouse: BigQuery, Snowflake, or Redshift ($100-500+/month)
Data pipeline: Custom SP-API integration or ETL tool (weeks to build)
BI tool access: Looker Studio (free), Tableau ($70+/user/month), Power BI ($10+/user/month)
Technical expertise: SQL skills, data modeling knowledge
If you have a data team and need highly customized visualizations beyond what specialized tools offer, this path makes sense. For most sellers, it's overkill.
This is where most growth-stage sellers should start. Nova's Custom Analytics beta combines the flexibility of BI tools with the simplicity of purpose-built software. No data engineering required.
Getting Started: The Smart Widget Library
Nova includes 25+ pre-built widgets covering the metrics Amazon sellers actually need. Your first dashboard can be live in under 10 minutes:
Open Custom Analytics: Access the beta dashboard builder
Browse Widget Library: see pre-configured widgets for P&L, advertising, inventory, and more
Drag widgets to canvas: Click and drag any widget onto your dashboard
Resize and arrange: Widgets snap to grid for clean layouts
Set global date range: all widgets respect your selected time period
Recommended Starter Widgets
P&L Summary: Revenue, COGS, fees, ad spend, net profit in one view
TACoS Trend: 30-day advertising efficiency with comparison
Top Products by Profit: Ranked list with margin percentages
Inventory Velocity: Days of stock remaining by SKU
Building Custom Widgets from Scratch
When pre-built widgets don't match your exact need, build custom ones:
Step 1: Choose Your KPIs
Select from 500+ available metrics. Mix sales, advertising, inventory, and profitability data in one widget.
Step 2: Select Chart Type
Line chart for trends, bar chart for comparisons, table for details, KPI card for single metrics.
Step 3: Add Dimensions
Break down by product, marketplace, time period, campaign type, or Smart Tag segment.
Step 4: Configure Filters
Show only specific products, date ranges, or tag segments. Filters persist when you save.
Compare vs. Breakdown Modes
Two viewing modes unlock different insights:
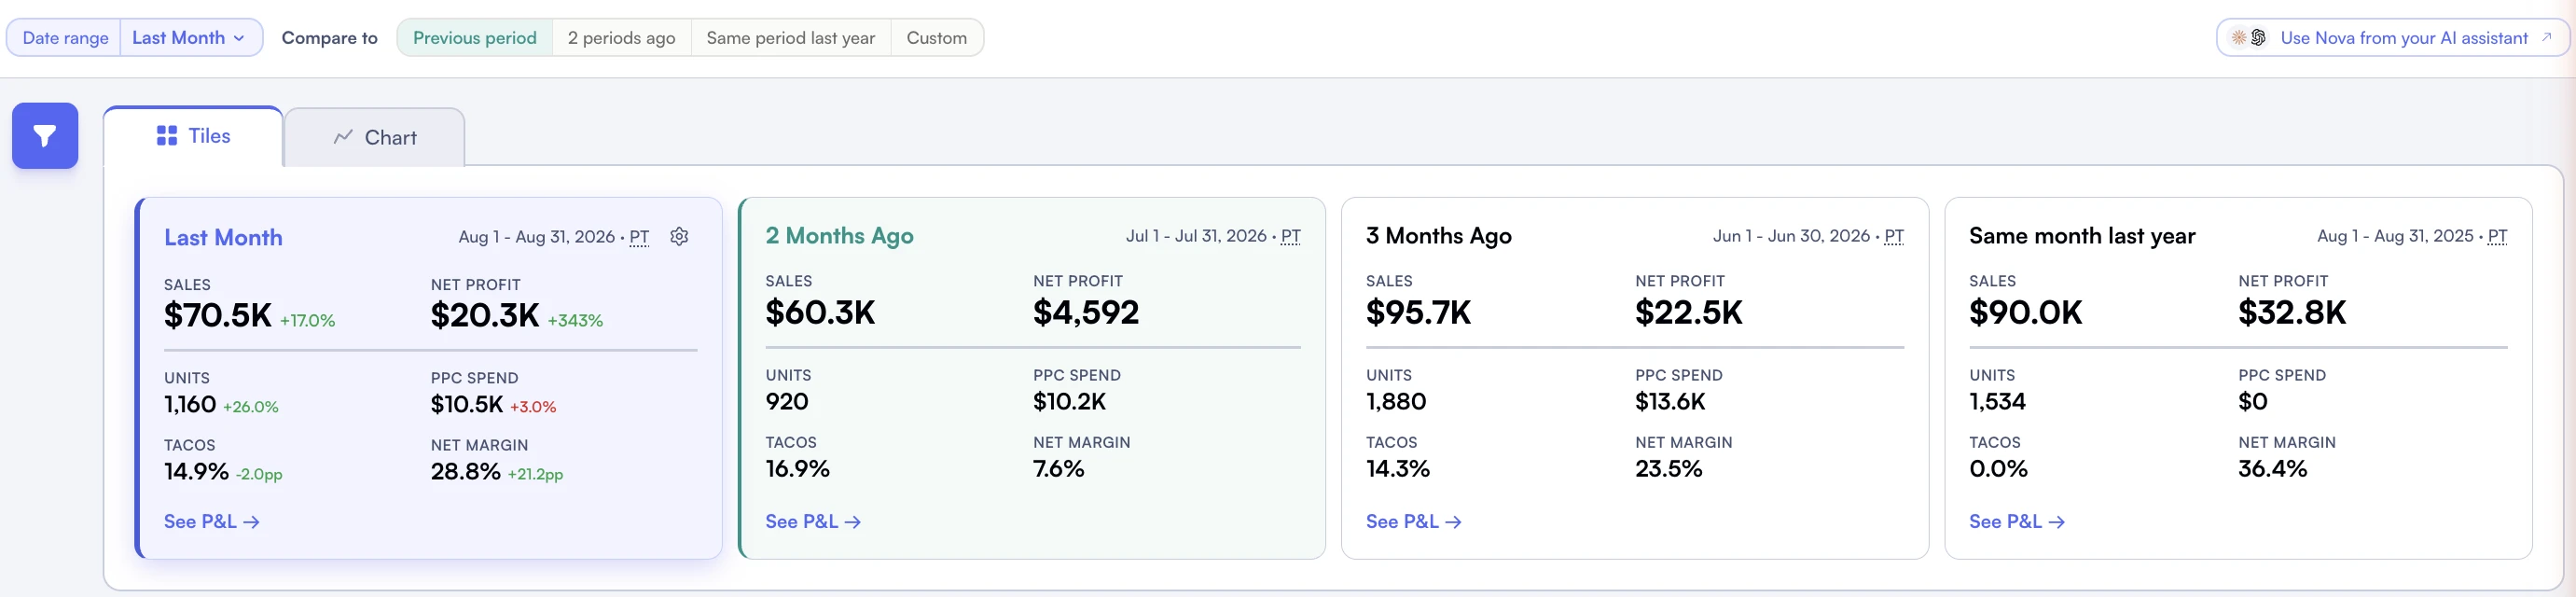
Period comparisons give sales and profit totals a starting point for investigation.
Compare Mode: see the same metric across different segments side-by-side (e.g., TACoS for Brand A vs. Brand B)
Breakdown Mode: Drill into a single segment to see contributing factors (e.g., what's driving Brand A's TACoS?)
Switch between modes with one click. This flexibility is why custom dashboards outperform static reports.
Advanced: Adding Product Segmentation with Custom Breakdowns
Here's where Nova's custom analytics becomes truly powerful. Custom Breakdowns lets you create product segments that don't exist in Amazon's data model.
Why Default Amazon Categories Don't Work
Amazon categorizes products by what they are (Electronics, Home & Kitchen). You need to categorize by how they perform for your business:
Hero Products vs. Long Tail: Different ad strategies, different expectations
Growth Phase vs. Mature: High TACoS is acceptable for new products, not established ones
High Margin vs. Volume Drivers: Different contribution to overall profitability
Supplier A vs. Supplier B: track quality and margin by source
Amazon can't give you these segments. You build them with Custom Breakdowns.
Custom Breakdowns Tutorial: 4-Step Setup
Step 1: Create Your First Drawer
A "drawer" is a segmentation dimension. Think of it as a category of tags. Common first drawers:
Product Lifecycle: Tags: New Launch, Growth, Mature, Decline, Liquidation
Profitability Tier: Tags: High Margin, Standard Margin, Low Margin, Loss Leader
Ad Strategy: Tags: Hero Product, Defensive, Offensive, Organic Only
Navigate to Custom Breakdowns → Create Drawer → Name it → Add tags within the drawer.
Step 2: Tag Your Products
Assign products to tags within each drawer. A product can have one tag per drawer but tags from multiple drawers simultaneously.
Example: Product "Premium Widget" can be tagged as:
• Lifecycle: "Mature"
• Profitability: "High Margin"
• Ad Strategy: "Defensive"
Bulk tagging is available. Select multiple products → Assign tag → Done.
Step 3: Filter Dashboards by Tags
Once products are tagged, every dashboard widget supports tag filtering. This is where the magic happens.
P&L filtered to "High Margin" products: see true profit drivers
TACoS filtered to "New Launch" products: Expect higher values, track trajectory
Inventory velocity filtered to "Hero Products": Never stock out on winners
Step 4: Build Segment Comparison Widgets
The most powerful use of Custom Breakdowns: comparing segments within the same widget.
Create a bar chart showing:
• X-axis: Lifecycle stages (New Launch, Growth, Mature, Decline)
• Y-axis: Average TACoS
Now you can see if your advertising efficiency matches lifecycle stage. If "Mature" products have TACoS above 20%, something's wrong with your ad strategy.
Try Nova's Custom Analytics Beta
Build your first dashboard with Custom Breakdowns in under 30 minutes. See why custom segmentation changes everything.
Dashboard Templates by Business Type
Different businesses need different dashboard layouts. Here are recommended configurations:
FBA Seller Daily Dashboard
For individual sellers managing their own brand(s):
Let's walk through a real example. A supplements brand with 85 SKUs needed to answer one question: "Which products should get more ad budget?"
Starting Point
85 SKUs
No clear performance tiers
Monthly Ad Spend
$42K
Spread across all products
Goal
Find Winners
Reallocate budget to profitable products
Dashboard Configuration
They built a "Profitability Radar" dashboard with these components:
Widget 1 - Profit Contribution Chart: Bar chart showing each product's contribution to total profit (not revenue)
Widget 2 - TACoS vs. Margin Scatter: X-axis: TACoS, Y-axis: Net Margin. Products in top-left quadrant = winners
Widget 3 - Segment Summary Table: Products tagged by profitability tier, showing aggregate metrics per tier
Widget 4 - Budget Efficiency: Ad spend as % of profit generated, by product
Custom Breakdowns Structure
They created a "Profitability Tier" drawer with four tags:
Stars: Net margin above 25%, TACoS below 15% (12 products)
Potential: Net margin 15-25%, TACoS 15-25% (28 products)
Questionable: Net margin 5-15%, TACoS above 25% (31 products)
Dogs: Net margin below 5% or negative (14 products)
Results After 90 Days
Budget Shift
62%
Ad spend moved to "Stars" and "Potential"
Profit Increase
$8,200/mo
From same total ad spend
TACoS Improvement
22% → 16%
Portfolio-level efficiency
Key Insight
"We were giving equal ad budget to 85 products. The dashboard showed us that 12 products generated 65% of our profit. We shifted budget to those winners and cut spending on dogs. Same total ad spend, much better results."
FAQ: Building Custom Amazon Dashboards
Common questions about custom dashboards
With Nova's pre-built widgets, 30-60 minutes for a functional dashboard. Adding Custom Breakdowns takes another 1-2 hours depending on catalog size. Full customization can take a few days of iteration.
Not with specialized tools like Nova. The interface is intuitive with pre-built widgets and smart filters. BI tools like Tableau require SQL and data modeling knowledge.
Yes. Nova supports shared dashboard views. Create different layouts for PPC managers, finance, and executives. Everyone can access the dashboards relevant to their work.
Review and update tags monthly. Products move through lifecycle stages. What was a 'Growth' product 6 months ago might be 'Mature' now. Set a monthly calendar reminder.
Amazon's tool has no advertising data, no COGS, no multi-marketplace. Nova includes PPC metrics, full P&L, Custom Breakdowns, and consolidated marketplace views.
Yes. Nova supports CSV export, API access, and direct delivery to data warehouses like BigQuery and Snowflake. Power users can feed dashboard data into their existing BI stack.
Next Steps: Start Building
Custom dashboards aren't a "nice to have" anymore. They're the difference between reacting to problems and preventing them. Between guessing at ad allocation and knowing which products deserve budget.
Start with your most pressing question. "Which products are actually profitable?" "Where is my ad spend going?" "What's my TACoS by product lifecycle?" Build the dashboard that answers that one question first. Then iterate.