Amazon Profit Analytics vs third-party tools compared
Amazon launched its native Profit Analytics Dashboard in 2025. But is free good enough? We compare data refresh speed, COGS tracking, accuracy, and features against Nova and other third-party tools.
Amazon launched its native Profit Analytics Dashboard in September 2025, giving sellers free access to basic profit tracking inside Seller Central. But is "free" good enough? This comparison breaks down exactly what Amazon's tool does well, where it falls short, and when you need a third-party alternative.
We've tested Amazon's new dashboard extensively alongside dedicated analytics platforms. The verdict: it's a solid starting point for small sellers, but it creates as many problems as it solves once you scale beyond $50K monthly revenue.
Here's everything you need to decide which approach fits your business.
What Is an Amazon Profit Dashboard? Core Features Explained
An Amazon profit dashboard is a reporting tool that consolidates your revenue, costs, and margins into a single view. Whether you use Amazon's native dashboard or a third-party solution, the goal is the same: understand which products make money and which drain resources.
Every Amazon profit dashboard should deliver five core features:
Revenue tracking Showing gross sales, net sales after returns, and sales velocity trends
Fee breakdown Detailing FBA fulfillment, referral fees, and storage costs at the SKU level
Advertising cost integration Pulling PPC spend directly into profit calculations
COGS tracking to calculate true gross margin (this is where Amazon's native tool falls short)
Net profit calculation Combining all the above into actionable profitability metrics
Amazon's free Seller Central dashboard covers the first three. Third-party tools like Nova's P&L analytics add COGS integration and true net profit visibility. For a unified view that replaces Seller Central's scattered reports, see Nova's Amazon seller dashboard. The difference matters: without COGS, you're seeing revenue minus Amazon's cut, not actual profit.
What is Amazon's Profit Analytics Dashboard?
Amazon's Profit Analytics Dashboard is a free feature inside Seller Central that calculates estimated profit at the product level.[1] It launched in late 2025 as part of Amazon's push to help sellers understand their unit economics.
The dashboard pulls data from your Amazon account to estimate:
Revenue from orders
Amazon fees (referral, FBA, storage)
Advertising costs from Sponsored Products/Brands/Display
Estimated profit after all Amazon costs
What Amazon does well:
Free access for all sellers
Integrated directly into Seller Central (no setup)
Accurate Amazon fee calculations (it's their data)
Basic product-level profit visibility
No additional software to manage
The Critical Limitations of Amazon's Dashboard
Free tools come with tradeoffs. Here's where Amazon's profit analytics falls short for serious sellers:
1. 48-72 Hour Data Delay
Amazon's dashboard typically updates 2-3 days behind. For a fast-moving business, this is a major blindspot. A PPC campaign could burn through $500 before you see the problem. A pricing error could cost thousands in margin before you notice.
Why the lag matters: a competitor undercutting you on a Friday afternoon shows up in a two to three day reporting cycle on Monday. Every unit sold in between ships at whatever margin the new price leaves you, and on a fast-moving SKU that is a full weekend of volume before anyone can act.
2. No COGS Integration
This is the biggest gap. Amazon doesn't know what you paid for your products. Their "profit" estimate excludes your actual cost of goods. You see revenue minus Amazon fees minus ads. You don't see true profit.
For a product selling at $29.99 with $8 COGS, Amazon might show $15 "profit" when your real profit is $7. That's a 114% error that compounds across your entire catalog.
3. Single Marketplace Only
If you sell on multiple Amazon marketplaces (US, UK, EU), Amazon's dashboard shows each marketplace separately. There's no consolidated view. No currency normalization. No cross-marketplace comparison.
International expansion is a major growth driver for Amazon sellers.[2] but their native analytics doesn't support multi-marketplace sellers effectively.
4. No Custom Metrics or KPIs
You get Amazon's predefined metrics. That's it. Want to track contribution margin? Build custom tagging systems? Create portfolio views? Monitor TACoS trends? You can't customize anything.
5. Limited Historical Data
Amazon's dashboard provides limited historical lookback. Planning for seasonality requires 12-24 months of data analysis. Building forecasts requires trend data. Exit preparation requires clean historical records. Amazon's native tool doesn't support these use cases.
Data Refresh
48-72 hrs
Amazon Dashboard delay
COGS Tracking
None
Missing true profit
Marketplaces
1
Per dashboard (no consolidation)
Side-by-Side Feature Comparison
Let's compare Amazon's native dashboard against Nova, a dedicated analytics platform built for serious Amazon sellers.
Feature
Amazon Dashboard
Nova
Price
Free
From $49/month
Data Refresh
48-72 hours
30 minutes
COGS Tracking
Multi-Marketplace
Custom KPIs
50+ metrics
P&L Accuracy
Estimated only (no COGS)
99.9%
Historical Data
90 days
Unlimited
Export Options
Basic CSV
API, CSV, PDF
Agency Features
Custom Breakdowns
Alert System
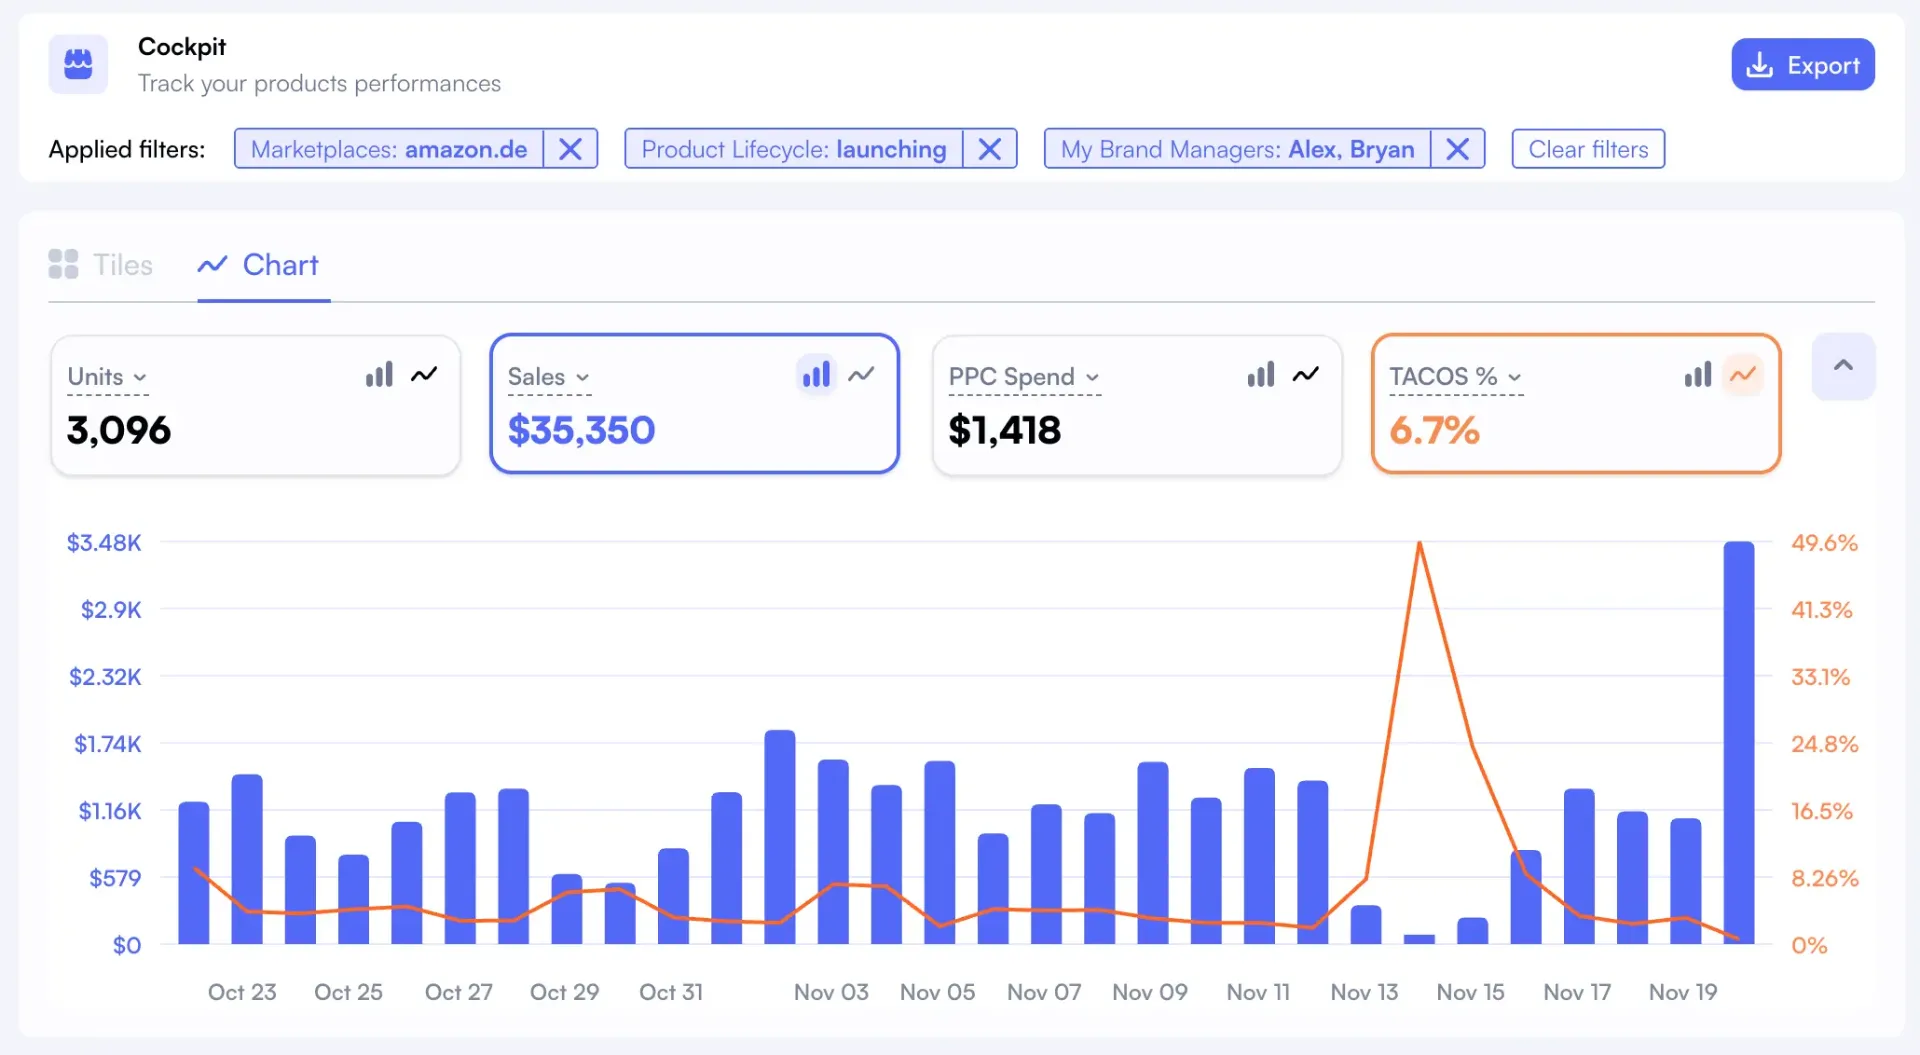
Nova's dashboard provides profit visibility with real-time sales data
When Free Is "Good Enough"
Amazon's dashboard makes sense for specific seller profiles:
Amazon Dashboard works if you:
Sell under $30K/month on a single marketplace
Have fewer than 20 active SKUs
Run minimal advertising (<10% of revenue)
Don't need same-day decision making
Have simple, stable COGS you can track mentally
Aren't planning to sell your business
For new sellers validating their first products, Amazon's free dashboard provides useful directional data. You can see roughly which products are working and which aren't.
When You Need More
Third-party analytics become essential when:
Upgrade to third-party tools if you:
Sell $50K+/month and need accurate forecasting
Manage 50+ SKUs requiring portfolio analysis
Spend 15%+ of revenue on advertising
Sell on multiple Amazon marketplaces
Need same-day visibility into profit changes
Plan to sell your business in 1-3 years
Work with an agency managing multiple brands
Require detailed COGS and contribution margin tracking
The math is simple: if better analytics prevents one major pricing mistake or catches one margin leak per quarter, a $49-100/month tool pays for itself many times over.
Why Nova Leads for Serious Sellers
Nova was built specifically for the gaps Amazon's native tools leave open:
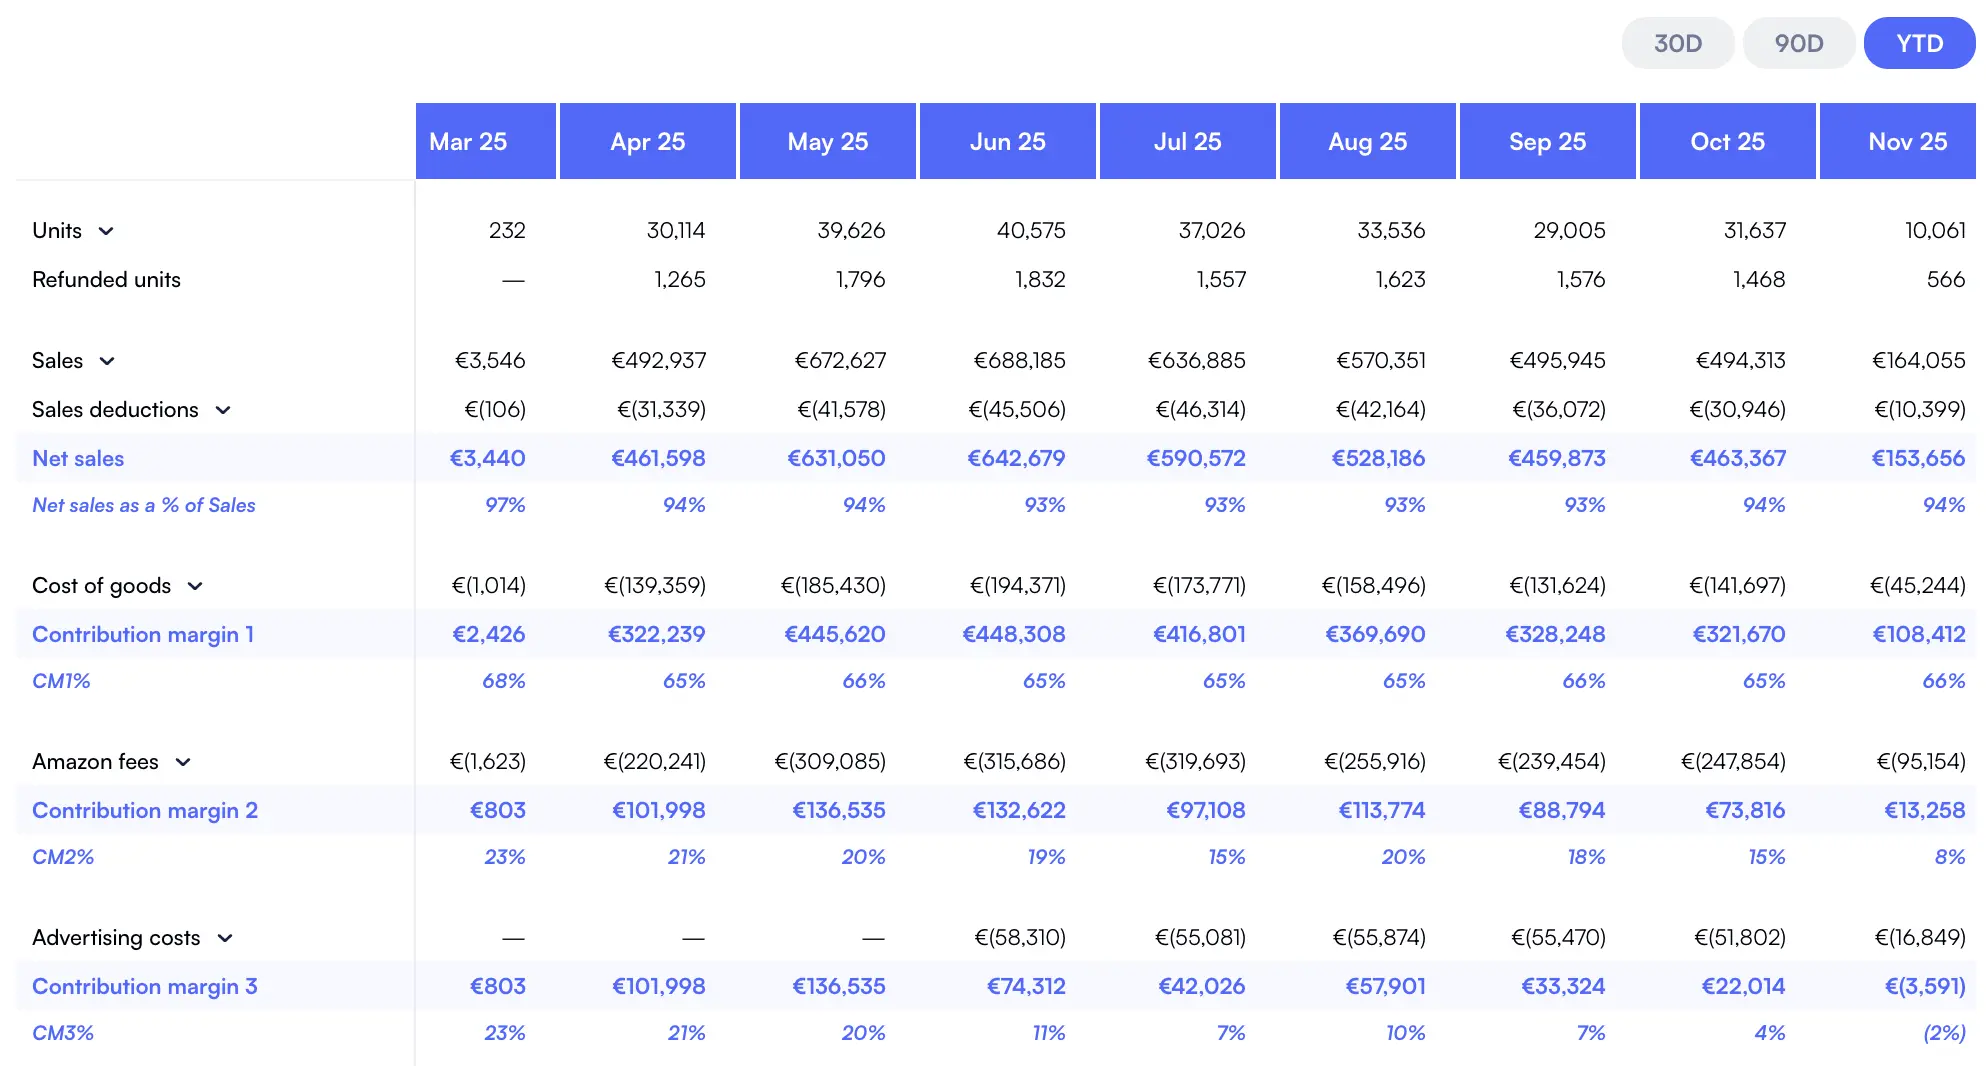
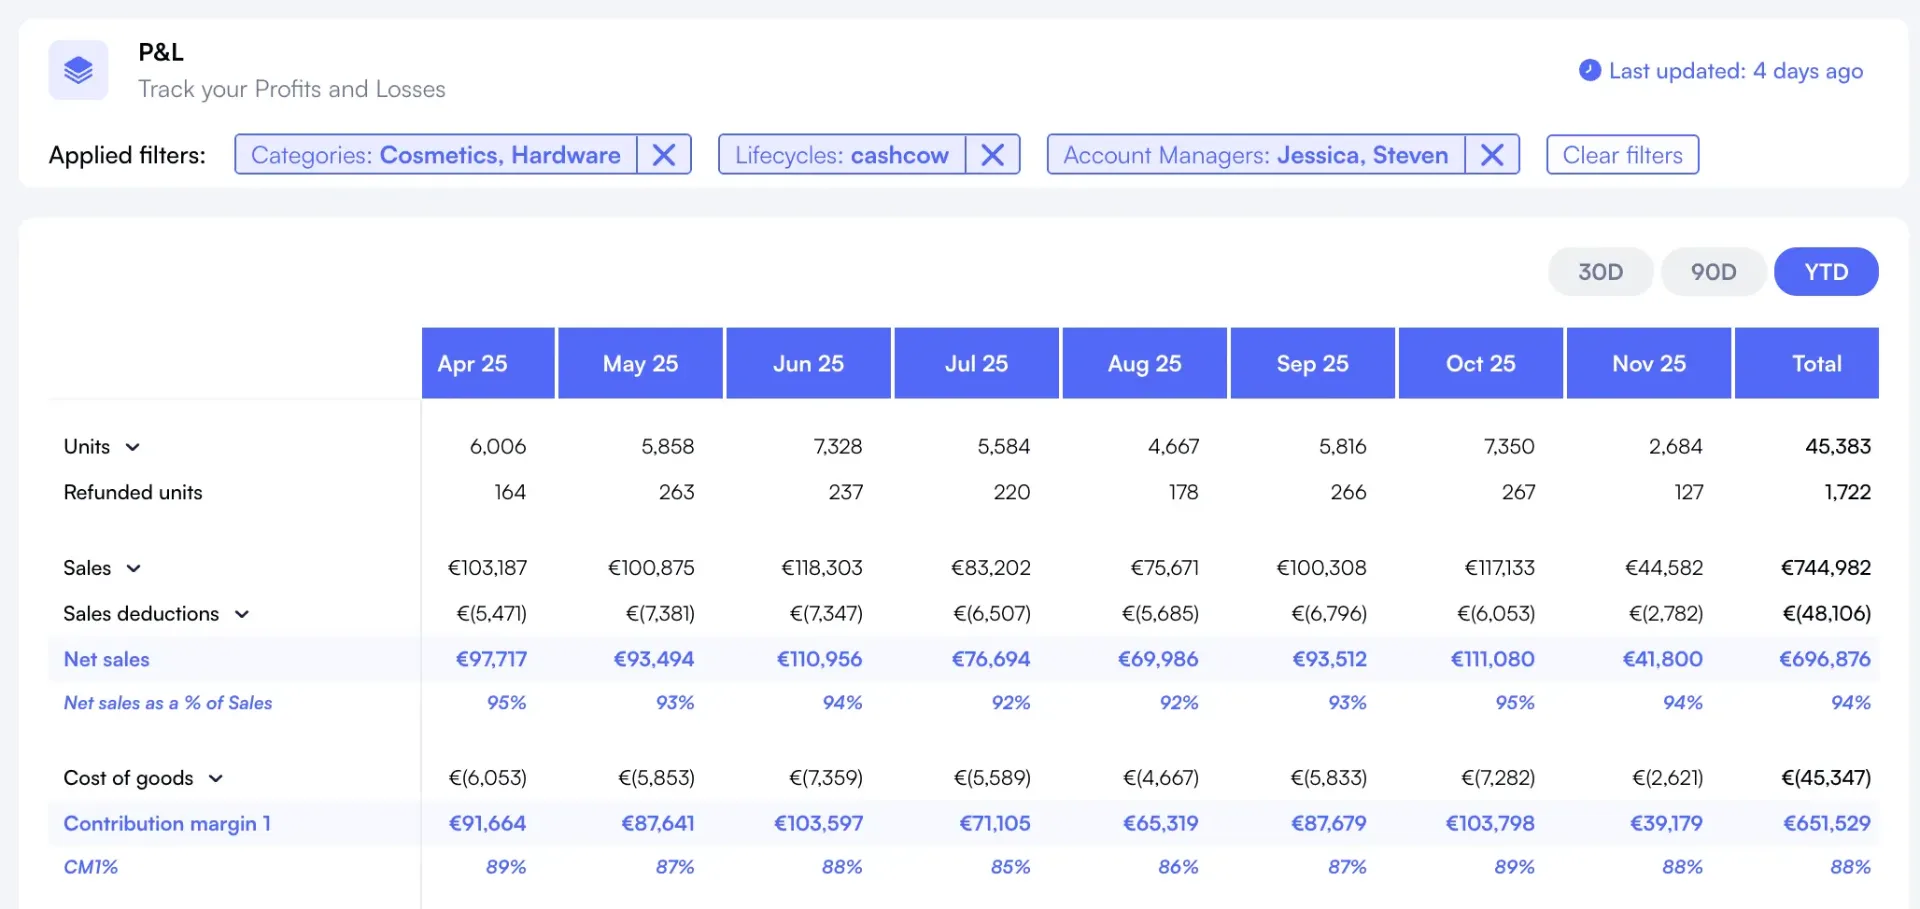
Nova's P&L dashboard shows true profit with integrated COGS tracking
30-Minute Data Refresh
While Amazon updates 48-72 hours behind, Nova receives orders and units in real time. You see profit changes the same day they happen. This enables same-day optimization that's impossible with delayed data.
99.9% P&L Accuracy
Nova's reconciliation engine matches Amazon's settlement reports with 99.9% accuracy. Combined with integrated COGS tracking, you get true profit at the SKU level, not estimates.
Build custom dashboards with 50+ configurable metrics
50+ Custom KPIs
Build exactly the metrics you need. Contribution margin by tier, TACoS trends, portfolio heat maps, whatever your business requires. Amazon gives you their metrics. Nova gives you yours.
Pro Tip: Smart sellers use Amazon's dashboard as a sanity check. If Nova's numbers differ significantly from Amazon's fee calculations, it triggers investigation. The tools complement each other.
Multi-Marketplace Consolidation
Manage US, UK, Germany, and other marketplaces from one dashboard. Currency normalization, marketplace comparison, and unified portfolio tagging across regions.
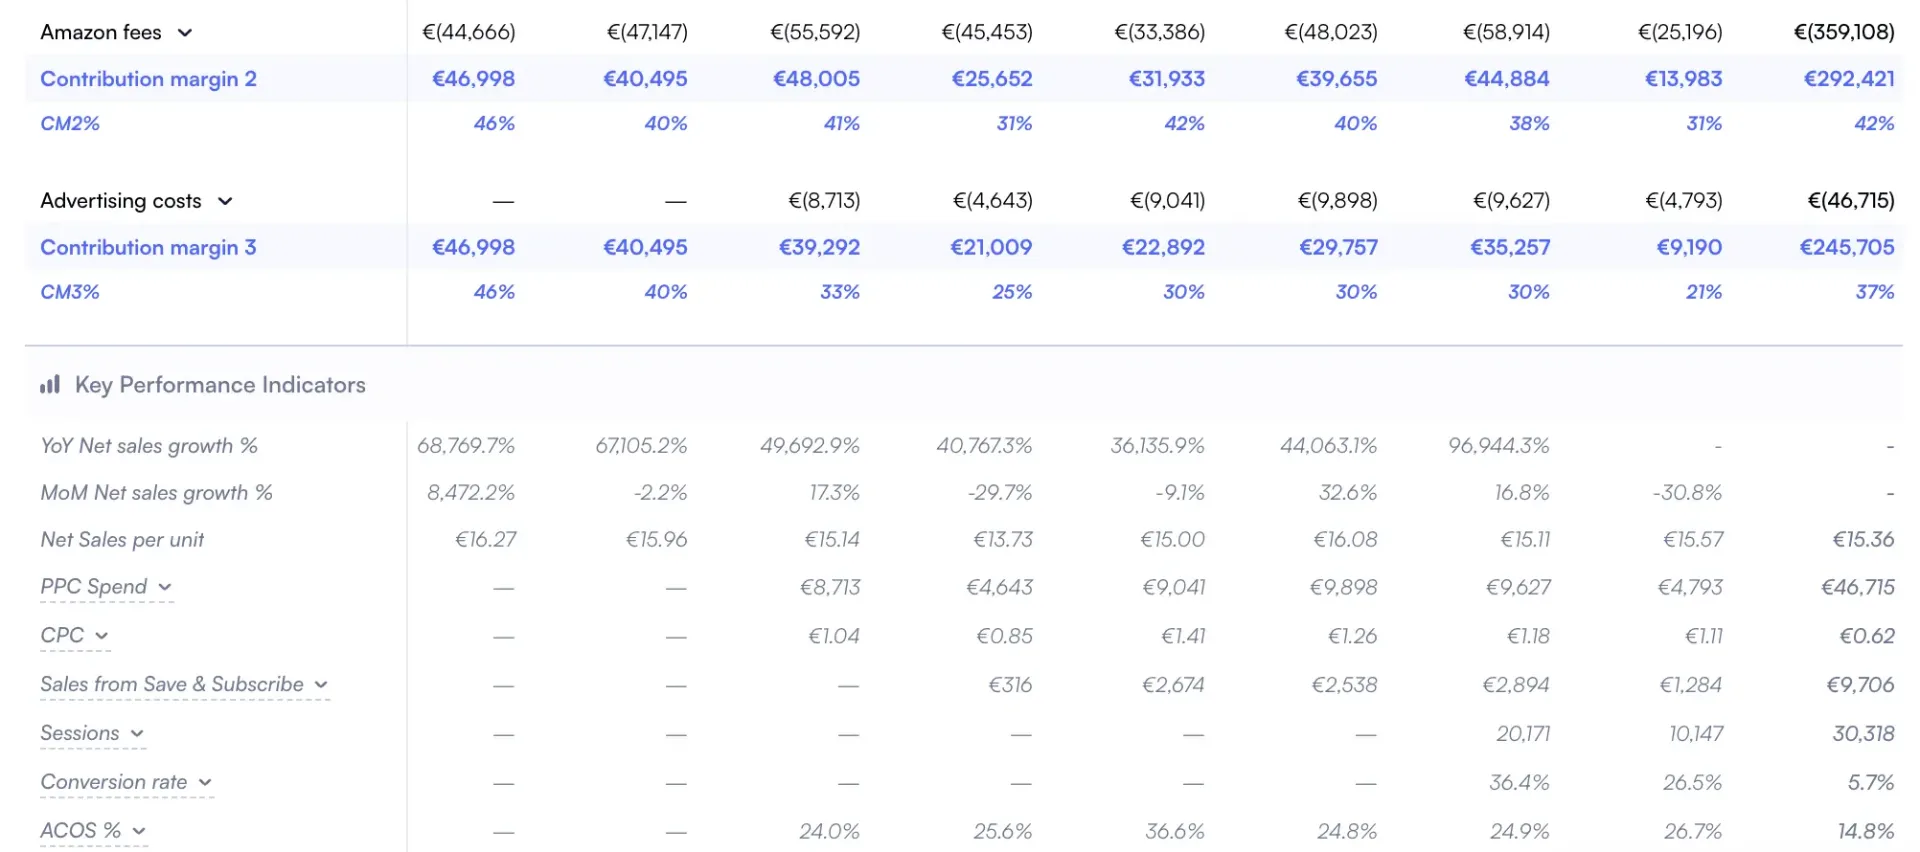
Consolidated multi-marketplace analytics with custom breakdown filters
Agency-Ready Features
For agencies managing multiple brands, Nova provides portfolio-level views and client-specific dashboards that Amazon's seller-focused dashboard can't match.
Week 3-4: run parallel with Amazon dashboard to validate accuracy
Month 2: Phase out manual tracking and rely on automated reporting
Most sellers complete migration in under two weeks. Nova's onboarding team provides guided setup to ensure nothing gets missed.
Frequently asked questions
For Amazon fees and advertising costs, yes. It pulls directly from your account. However, it can't calculate true profit because it doesn't include your COGS. The "profit" shown is actually revenue minus Amazon costs, not actual profit.
Amazon doesn't have visibility into your supplier costs. They only see what happens on their platform. Third-party tools let you input COGS data to complete the profit picture.
Yes, and many sellers do. Amazon's dashboard validates that third-party tools are pulling fee data correctly. The tools serve different purposes and complement each other.
Work it against your own catalogue: the cost of a mispriced or loss-making SKU running unnoticed for a quarter, against a subscription starting at $49 per month. The larger the catalogue, the more places a leak can hide.
Likely, but slowly. Amazon's focus is on marketplace operations, not seller analytics. Third-party tools iterate faster and can focus entirely on seller success. The gap is likely to persist.
The Bottom Line
Amazon's Profit Analytics Dashboard is a welcome addition for new sellers. It provides free, basic profit visibility that didn't exist before. For sellers under $30K/month with simple operations, it's a reasonable starting point.
But the limitations are real. No COGS tracking means no true profit. 48-72 hour delays mean no same-day decisions. Single marketplace views mean no consolidated reporting.
For serious sellers building scalable businesses, third-party tools like Nova remain essential. The investment in accurate, analytics with real-time sales pays dividends in better decisions, caught errors, and ultimately higher profits.