DOI formula, category benchmarks, color-coded thresholds, and reorder point strategies. The single metric that controls both stockout risk and storage costs.
Days of Inventory (DOI) tells you exactly how many days your current stock will last at your current sell-through rate. It's the simplest, most actionable inventory metric for Amazon sellers. Yet most sellers either don't track it or rely on gut feel instead of data. That's how you end up with $30K in aged inventory surcharges or a best-seller that stocks out for two weeks. We pulled the playbook below from cohort reviews with brands and agencies, not from a slide deck.
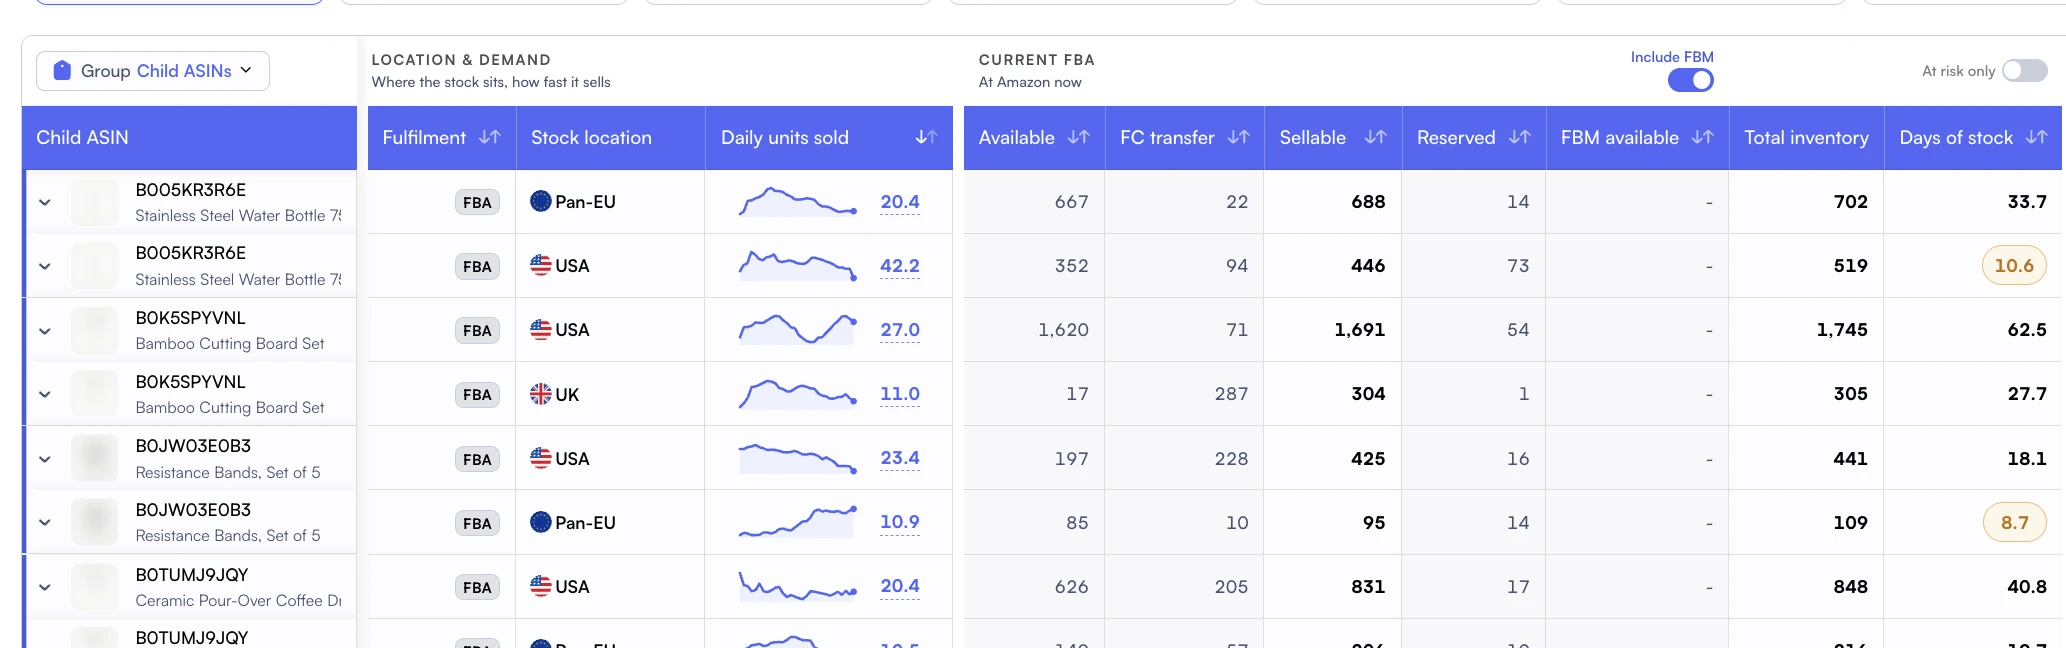
Days of stock links available inventory to the daily demand it needs to cover.
This guide covers the DOI formula, category-specific benchmarks, how to set reorder points using DOI, and the direct connection between DOI and your IPI score. You'll also learn how color-coded DOI thresholds transform inventory management from a weekly spreadsheet exercise into a daily 2-minute check.
Key Takeaway
DOI = Current FBA Units ÷ Average Daily Sales. For most Amazon categories, the sweet spot is 30-60 days. Below 14 days, you're at high stockout risk. Above 90 days, you're paying unnecessary storage fees and dragging down your IPI score. The goal: every ASIN in the green zone.
The DOI Formula: Simple Math, Powerful Insight
DOI is calculated as:
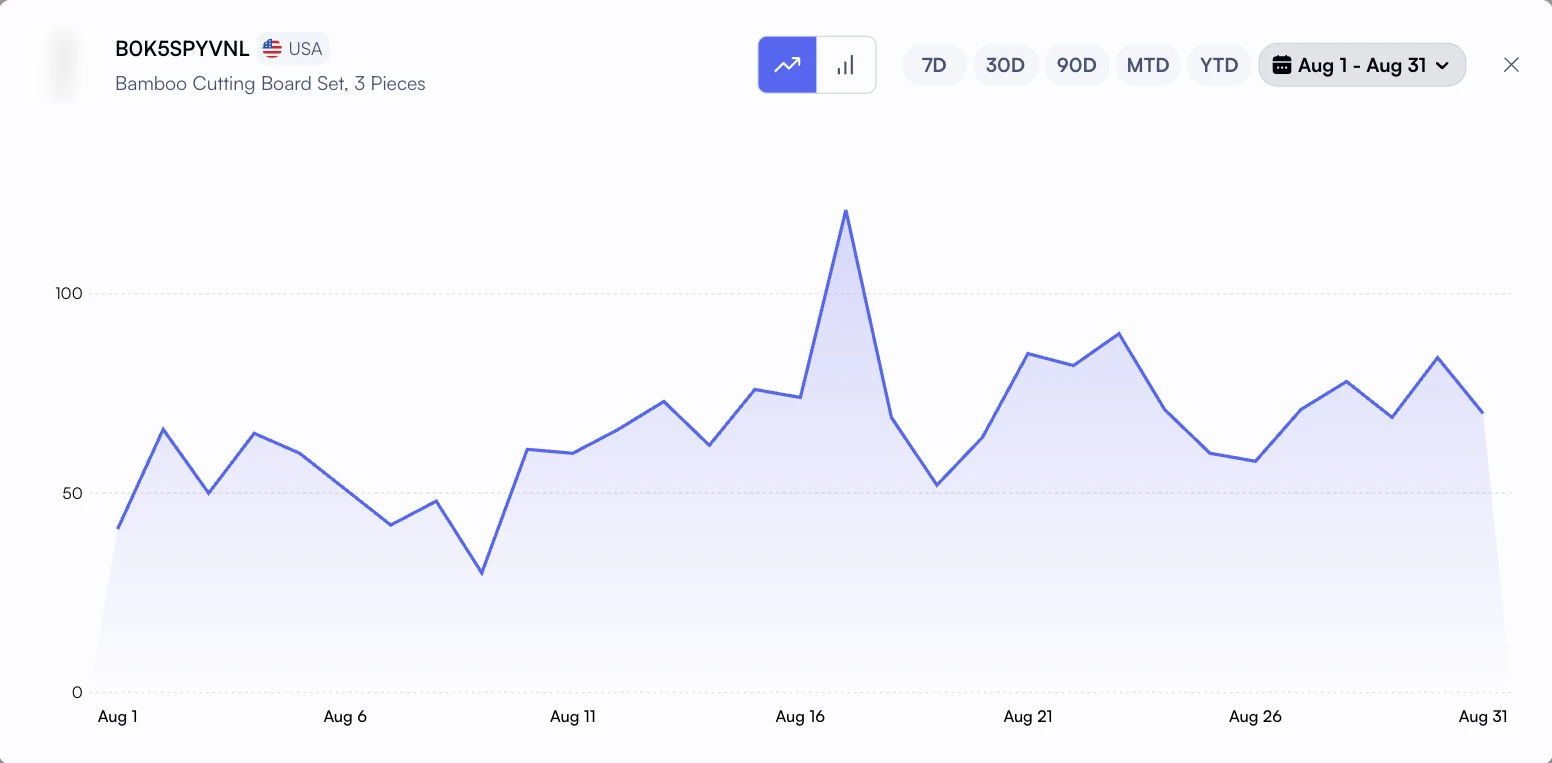
Daily unit sales show the changes in demand behind a replenishment forecast.
DOI = Current FBA Units ÷ Average Daily Unit Sales
Where average daily sales = total units sold over last 30 days ÷ 30
If you have 450 units in FBA and sell an average of 15 units per day, your DOI is 30 days. Simple. But the power comes from tracking DOI across your entire catalog and acting on outliers.
Real-World DOI Calculation
ASIN
FBA Units
Daily Sales
DOI
Status
Kitchen Gadget A
600
20/day
30 days
Healthy
Kitchen Gadget B
150
12/day
12.5 days
At Risk
Kitchen Gadget C
2,400
8/day
300 days
Excess
Kitchen Gadget D
900
18/day
50 days
Healthy
In this example, Kitchen Gadget B needs an urgent restock (12.5 days of supply at current velocity). Kitchen Gadget C is a serious problem: 300 days of inventory means it'll hit aged surcharges within the quarter. Without DOI tracking, you might not catch either issue until it's too late.
Pro Tip: Use Weighted Average Sales
A simple 30-day average works for stable products, but it misses trends. If sales jumped from 10/day to 20/day last week (new PPC campaign, seasonal spike), your DOI is actually half what the 30-day average suggests. Use a 7-day weighted average alongside the 30-day average to catch velocity changes early. Nova's demand velocity metric does this automatically.
DOI Benchmarks by Category
The "right" DOI depends on your replenishment lead time, category seasonality, and margin structure. According to Statista's marketplace data and our analysis of seller performance across categories, here are practical benchmarks:
Category
Target DOI
Min (Stockout Risk)
Max (Excess)
Lead Time Factor
Consumables / Supplements
30-45 days
14 days
60 days
Short (domestic sourcing)
Home & Kitchen
45-60 days
21 days
90 days
Medium (mixed sourcing)
Electronics / Tech
30-45 days
14 days
60 days
Short to medium
Toys & Games
30-45 days
14 days
60 days
Long (overseas, seasonal)
Apparel
45-60 days
21 days
90 days
Long (overseas, size variants)
Oversized / Heavy
21-30 days
7 days
45 days
Short (higher storage cost)
Why Oversized Products Need Lower DOI
Oversized products occupy significantly more cubic footage, so storage costs per unit are much higher. A 2-cubic-foot oversized product at 60 DOI costs roughly 4x more in storage than a 0.25-cubic-foot standard product at the same DOI. For oversized items, keep DOI under 30 days and use AWD or 3PL storage for buffer stock.
Color-Coded DOI Thresholds: The Traffic Light System
The fastest way to manage inventory across hundreds of SKUs is a color-coded threshold system. Instead of scanning spreadsheets for numbers, you look for colors. Here's the framework that works for most Amazon sellers:
Critical
0-7 days
Imminent stockout. Emergency restock or has already stocked out.
At Risk
8-21 days
Reorder now. May stock out before inbound arrives.
Healthy
22-60 days
Optimal zone. Good balance of availability and cost.
Excess
60+ days
Overstocked. Drags IPI, risks aged surcharges.
Nova's FBA Inventory module applies exactly this color-coding to every ASIN in your catalog. Your morning inventory check becomes: scan for red (action needed today), check amber (action needed this week), ignore green (healthy). A 500-SKU catalog becomes manageable in 5 minutes.
Setting Reorder Points Using DOI
DOI tells you where you are. Reorder points tell you when to act. The formula:
Reorder Point = (Lead Time in Days × Daily Sales) + Safety Stock
When your current FBA units hit this number, trigger a replenishment order
Example: Setting a Reorder Point
Variable
Value
Source
Average daily sales
15 units/day
30-day average from Seller Central
Lead time
21 days
Supplier production + shipping + FBA check-in
Safety stock
7 days × 15 = 105 units
Buffer for demand spikes
Reorder point
(21 × 15) + 105 = 420 units
When FBA hits 420 units, reorder
Equivalent DOI
28 days
420 ÷ 15 = 28 days of supply
So when this product's DOI drops to 28 days, you trigger a replenishment. By the time the new stock arrives (21 days later), you'll have 7 days of safety stock left. You never stock out, and you never hold more than 45-50 days of inventory.
Case Study: From 90-Day DOI to 40-Day DOI
A pet supplies brand with 85 SKUs was averaging 90-day DOI across their catalog. They were paying $4,200/month in storage fees with 12 ASINs approaching aged surcharge thresholds. By implementing DOI-based reorder points (targeting 40-day average) and clearing 8 dead SKUs, they reduced monthly storage fees to $1,800 within 60 days. Their IPI climbed from 380 to 540 in the same period, unlocking unlimited restock capacity for Q4.
DOI vs. Sell-Through Rate: Which Metric Matters More?
Amazon's IPI score uses sell-through rate. Many sellers track DOI. They're related but not identical. Here's how they compare:
Metric
DOI (Days of Inventory)
Sell-Through Rate
Formula
Units on hand ÷ daily sales
Units sold (90d) ÷ avg units on hand
Output
Days of supply remaining
Turnover ratio (higher = better)
Best for
Reorder decisions, stockout prevention
IPI optimization, Amazon compliance
Actionability
High (directly maps to reorder timing)
Medium (tells efficiency, not timing)
Used by
Inventory managers, ops teams
Amazon's IPI algorithm
The answer: track both, but use DOI for daily decisions. DOI tells you "this product runs out in 12 days." Sell-through tells you "this product turns 4x per quarter." The first drives action. The second tells you if your overall strategy is working. Both improve when you optimize your restock cadence.
How DOI Connects to Storage Fees and IPI
DOI is the single metric that influences both your storage costs and your IPI score. Here's the direct connection:
DOI → Storage Fees
Linear
2x DOI = roughly 2x storage cost (plus aged surcharges after 271 days)
DOI → IPI Score
Inverse
Lower DOI = higher sell-through = higher IPI
DOI → Capacity
Compound
Lower DOI → better IPI → more restock capacity
How Nova Helps
Nova's FBA inventory tracker is built around DOI as the core metric. Every ASIN shows current DOI with color-coded thresholds (red/amber/green), demand velocity trends, stock position (available, reserved, inbound), and pipeline projections. You see at a glance which products need attention and which are healthy. For broader storage-fee and aging-inventory visibility, the full Amazon inventory management software view ties this into P&L tracking, so you can calculate the true contribution margin impact of holding 90 days vs 45 days of any given product.
Frequently asked questions
30-60 days for most categories. This balances stockout risk against storage costs. Products with longer lead times (overseas sourcing, 45+ day production) may need 45-60 days. Fast-moving consumables can operate at 21-30 days. Oversized products should target 21-30 days due to higher storage costs per unit.
Seller Central doesn't show DOI directly. You need to calculate it: go to Inventory Health, note your "Available" units, then divide by your average daily sales (from Business Reports > Detail Page Sales and Traffic). Or use Nova's inventory dashboard, which calculates DOI automatically for every ASIN with color-coded thresholds.
Use both. The 30-day average gives you stable DOI for reorder planning. The 7-day average catches velocity changes (new PPC campaign, seasonal spike, competitor stockout). If 7-day DOI is significantly different from 30-day DOI, investigate why and adjust your restock plan accordingly. For the full workflow that wraps DOI into a weekly reorder cadence, see our guide on how to forecast Amazon inventory.
They're the same concept in different units. DOI of 42 days = 6 weeks of cover. DOI is more granular and more commonly used in Amazon operations because Amazon's fee thresholds (271 days, 365 days) and IPI calculations are day-based.