Just 111 sellers generate 10% of Amazon's $300B U.S. third-party GMV. Learn how top portfolio operators structure analytics across multiple brands, regions, and product lines to maintain profitability at scale.
Just 111 sellers generate 10% of Amazon's $300B U.S. Third-party GMV. Fewer than 8,000 sellers drive half the marketplace. These aren't lucky product pickers. They're portfolio operators managing multiple brands, regions, and product lines with analytical precision that Seller Central was never built to support.
If you manage more than one brand on Amazon, or sell across multiple marketplaces, you've already hit Seller Central's ceiling. You can't group products by brand. You can't consolidate P&L across accounts. You can't see which product line is actually profitable after all fees. And with 24-48 hour data delays, you're making decisions on yesterday's numbers.
This guide breaks down exactly how top portfolio operators structure their analytics. We'll cover the five dimensions you need to slice data by, the metrics that actually matter at portfolio scale, and how to build an operating system that gives you clarity across every brand, region, and product line.
The Concentration Trend: Why Portfolio Analytics Matters Now
Amazon's marketplace is consolidating. Marketplace Pulse data1 shows that seller concentration has been accelerating for three years straight. The top 1.6% of sellers now control half of all third-party sales volume.
What's driving this? Scale advantages compound. Larger sellers negotiate better supplier terms, spread fixed costs across more SKUs, and reinvest ad spend more efficiently. But here's the part most people miss: the biggest advantage isn't purchasing power. It's analytical depth.
A seller running one brand with 30 SKUs can manage profitability in a spreadsheet. A seller running six brands across three marketplaces with 500+ SKUs needs infrastructure. Without it, you're flying blind on which brands actually earn their shelf space.
Top Seller Concentration
111
Sellers generate 10% of U.S. 3P GMV
Market Control
1.6%
Of sellers drive 50% of marketplace volume
Average Revenue
~$20M
Annual revenue per top-tier seller
Third-party sellers now account for 62% of all units sold on Amazon2, an all-time high. As this share grows, so does the operational complexity of running a portfolio at scale. The sellers who win aren't just finding good products. They're building systems to manage them.
Why Seller Central Breaks Down at Portfolio Scale
Seller Central was designed for individual sellers managing a single account. It works fine at that level. But the moment you operate multiple brands or sell across regions, you run into five structural limitations:
5 Structural Limitations of Seller Central
No product grouping beyond parent ASINs. You can't group by brand, supplier, product line, or lifecycle stage. Every analysis starts from a flat list of ASINs.
No cross-account consolidation. If you run separate accounts for different brands or regions, each one is a silo. There's no unified view.
24-48 hour data delays. Sales, fees, and advertising data arrive on different schedules. By the time you see a margin problem, you've already lost money on it.
No unified P&L. Sales data lives in Business Reports. Fee data lives in Payments. Ad data lives in the Advertising Console. Combining them requires manual export and spreadsheet work.
No benchmarking across segments. You can't compare brand A vs. Brand B performance, or US vs. EU margins, without exporting everything and building your own analysis.
These aren't minor inconveniences. For a multi-brand operator, they're structural blind spots. You can't optimize what you can't see. And at portfolio scale, you need to see across brands, regions, and product lines simultaneously.
The 5 Dimensions Portfolio Operators Need
After working with hundreds of multi-brand sellers, we've identified five dimensions that separate operators who scale profitably from those who scale into chaos. Every portfolio decision ultimately maps to one of these views:
Dimension
What It Answers
Example Use Case
Brand
Which brand earns its shelf space?
Compare contribution margin across 6 brands to decide where to allocate Q3 ad budget
Marketplace
Which region is worth expanding?
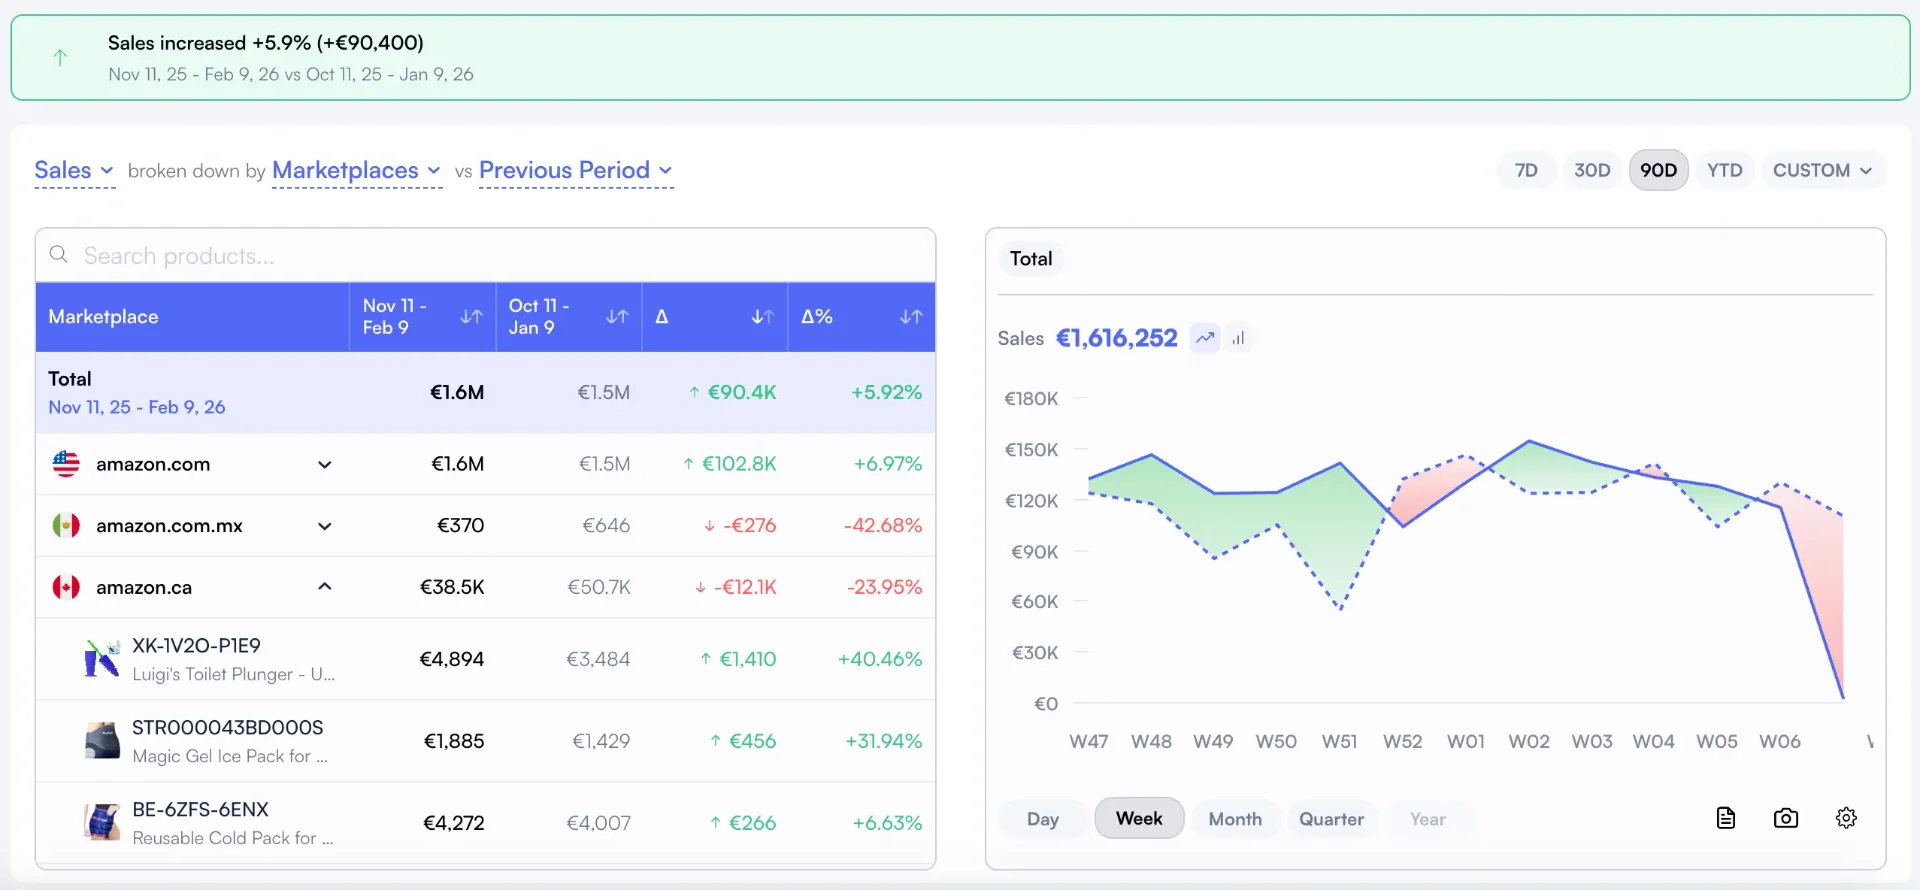
Track true margin in EU vs. NA after FX normalization and marketplace-specific fees
Manager
Who's driving results?
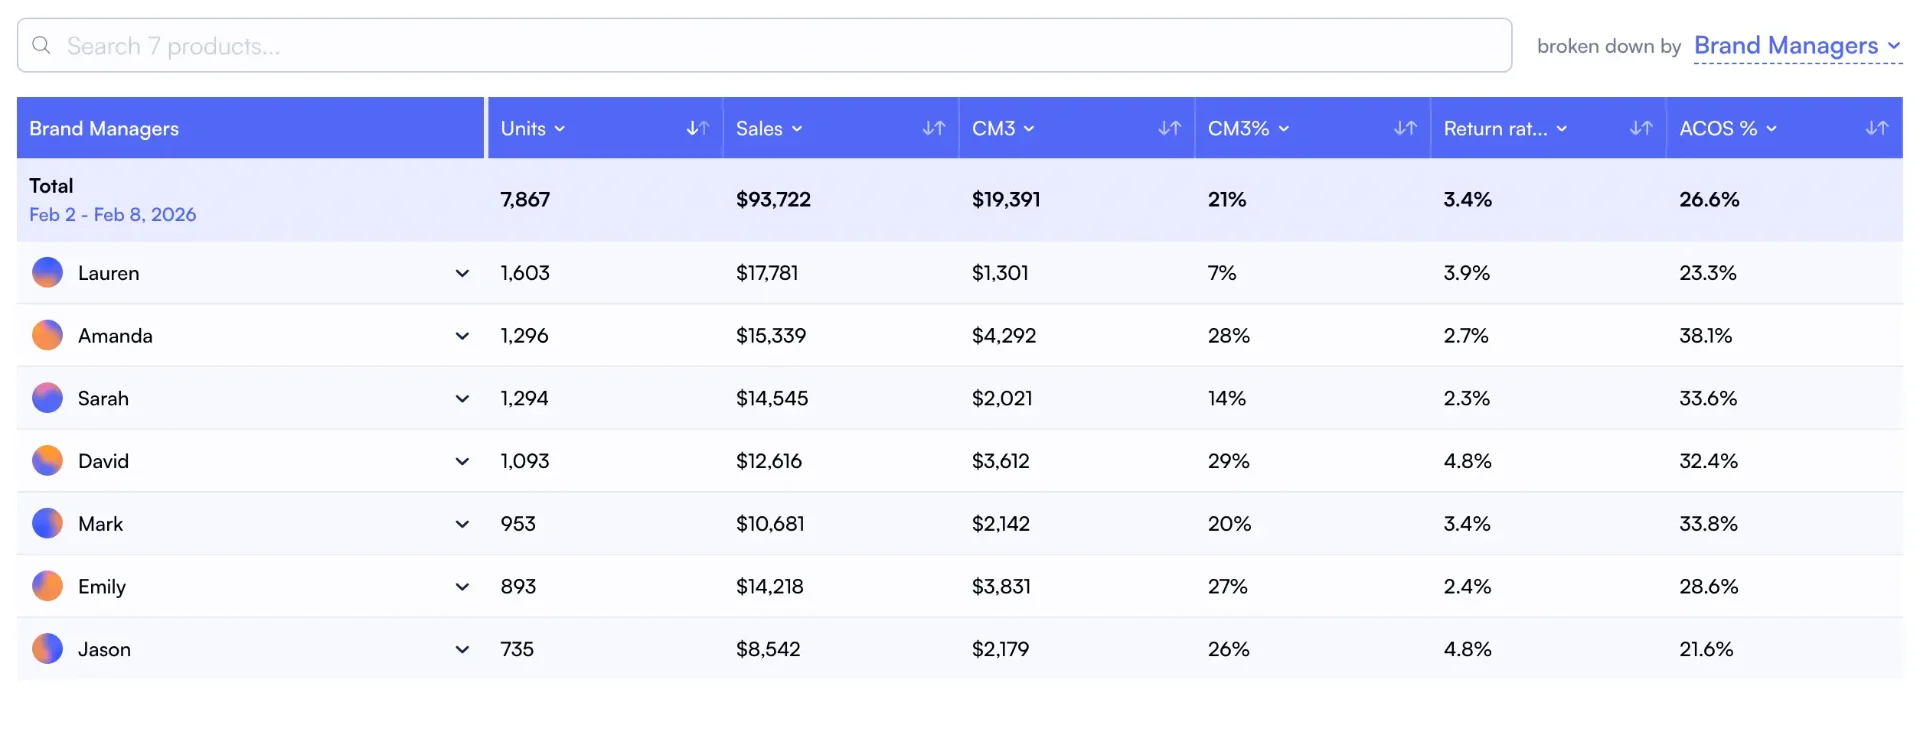
Assign product groups to brand managers and track P&L by person
Lifecycle
Where should you invest vs. Harvest?
Segment products as Launch, Growth, Mature, or Sunset to set TACoS targets by stage
Supplier
Which supplier relationships are profitable?
Track net margin by supplier after all Amazon fees to renegotiate terms
Most sellers track one or two of these dimensions, usually in spreadsheets. Portfolio operators track all five simultaneously. The difference is infrastructure.
Nova's Custom Breakdowns let you create unlimited groupings across any of these dimensions. Tag your products once, and every dashboard, P&L view, and performance report automatically slices data by your custom segments.
Building a Portfolio Operating System
A portfolio operating system isn't a single dashboard. It's a layered approach where each level serves a different decision frequency:
Pro Tip: The Three-Layer Approach
Top portfolio operators structure their analytics in three distinct layers, each with its own cadence and purpose:
Layer 1: Daily operational dashboard. Same-day margin checks, ad spend anomalies, inventory alerts. Use real-time sales data to spot changes in orders and units; check other metrics as their reports arrive.
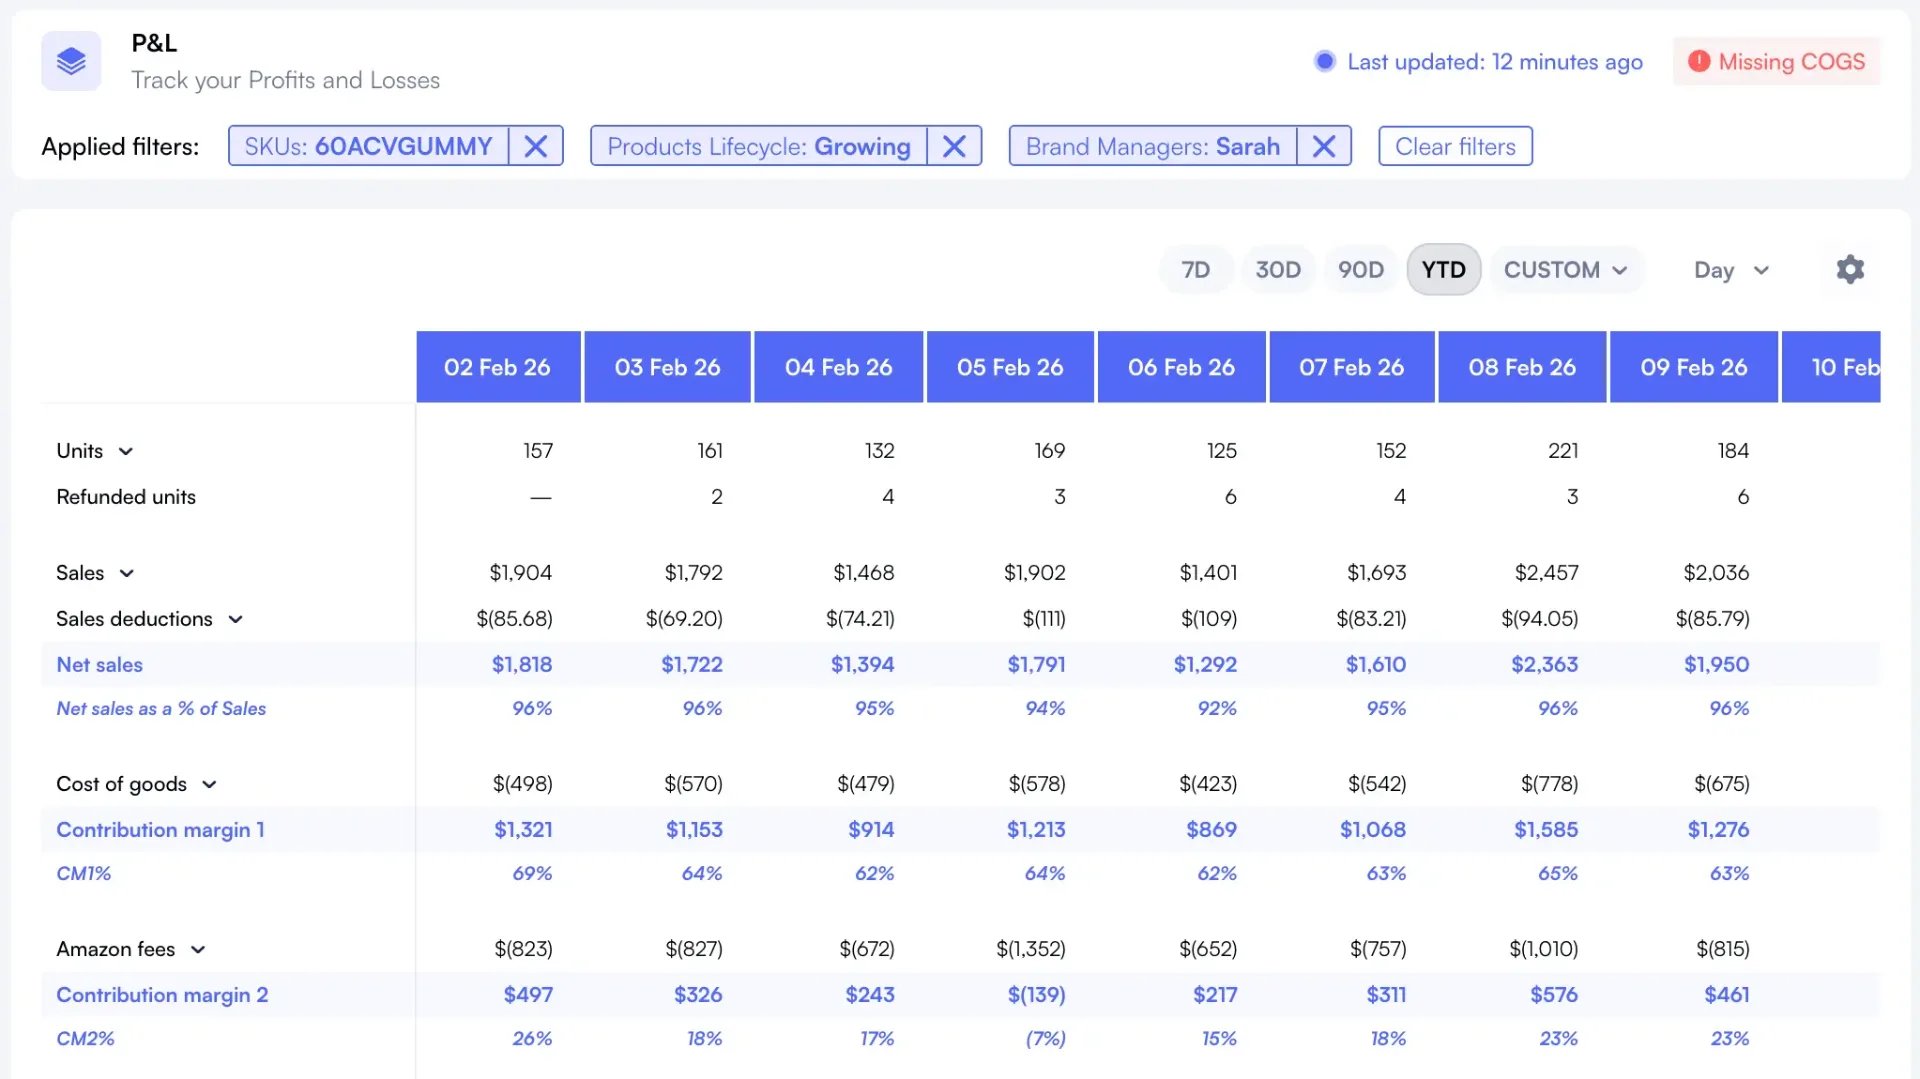
Layer 2: Weekly segmentation analysis. Brand-by-brand P&L, marketplace comparisons, lifecycle stage reviews. This is where Custom Breakdowns drive the most value.
Layer 3: Monthly strategic reporting. Board-level portfolio reviews, supplier negotiations, expansion decisions. Often exported to BI tools like Tableau or Looker Studio.
Layer 1: Daily operations with real-time sales data
Most sellers check their numbers daily. But checking 24-hour-old data means you're always reacting to yesterday. With real-time sales data, you can spot changes in orders and units as they happen.
Nova's Day-to-Day Performance dashboard receives orders and units in real time, giving you a consolidated view across all your brands and marketplaces in a single screen. No more logging into multiple Seller Central accounts to piece together what happened today.
Layer 2: Weekly Segmentation with Custom P&L
This is where portfolio analytics gets transformative. Instead of reviewing a flat list of 500 ASINs, you review six brand P&Ls, three marketplace P&Ls, or twelve supplier P&Ls. Each one tells you something actionable.
Nova's Custom P&L integrates 700+ metrics, including every Amazon fee, your COGS, advertising spend, and custom cost allocations. Apply your Custom Breakdowns on top, and you get a P&L for any segment you define.
Layer 3: Strategic Reporting with Data Delivery
For sellers operating at $5M+ annually, dashboards alone aren't enough. Finance teams need raw data in their warehouse. Board presentations need custom visualizations. Cross-channel attribution needs data from multiple platforms blended together.
Nova's Data Delivery pipes normalized Amazon data directly into BigQuery, Snowflake, or your preferred warehouse. Pre-calculated KPIs, real-time orders and units, zero pipeline maintenance. Your BI team gets query-ready data without building custom SP-API integrations.
Case Study: A Multi-Brand Operator Across 3 Marketplaces
Consider a portfolio operator managing six brands across the US, UK, and Germany. Before implementing structured analytics, their monthly review process looked like this:
Before: The Spreadsheet Nightmare
18 Seller Central logins (6 brands × 3 marketplaces) to download reports
3 days of manual consolidation each month to create a unified P&L
Currency conversion errors that distorted EU profitability by 5-8%
No visibility into brand-level contribution margin Because ad spend couldn't be allocated by brand
Quarterly discovery of unprofitable product lines that had been losing money for months
After: Portfolio Operating System
Single dashboard with all 6 brands, 3 marketplaces, and 500+ SKUs consolidated
P&L alongside real-time sales data for daily reviews
Brand-level contribution margins Automatically calculated after all Amazon fees and ad spend
Marketplace comparison with automatic currency normalization
Underperformer detection through automated flagging of products falling below margin thresholds
After allocating costs, compare each brand's contribution margin. Then decide whether to restructure, consolidate, or sunset underperforming brands based on your own results.
Portfolio Metrics That Matter at Scale
Single-brand sellers obsess over ACoS and BSR. Portfolio operators care about a different set of metrics entirely. Here are the benchmarks that drive portfolio-level decisions:
Metric
What It Measures
Healthy Benchmark
Red Flag
Contribution Margin by Brand
True profitability after all variable costs
15-25% (category dependent)
Below 10% for 2+ consecutive months
TACoS by Region
Ad dependency relative to total sales
8-15% for mature marketplaces
Above 20% without growth trajectory
Revenue Concentration
Portfolio diversification risk
No single brand > 40% of revenue
One brand > 60% of total revenue
Cross-Marketplace Margin Spread
Regional profitability gaps
<5% variance after FX normalization
>10% variance (investigate fees)
Underperformer Ratio
% of SKUs below margin threshold
<15% of active catalog
>25% (portfolio needs rationalization)
Nova's Winners & Losers feature automatically flags products that fall below your defined thresholds. Instead of manually reviewing 500 SKUs, you focus on the 30 that need attention this week.
Getting Started: Your First 30 Days
You don't need to build everything at once. Here's a practical 30-day roadmap for transitioning from fragmented reporting to portfolio-level analytics:
30-Day Portfolio Analytics Roadmap
Week 1: Connect and consolidate. Connect all your Amazon accounts to a single analytics platform. Set up COGS for accurate margin calculation. This alone gives you a unified P&L view you've never had.
Week 2: Define your segments. Create your first Custom Breakdowns. Start with brands (if you run multiple) or product lines. Tag every SKU.
Week 3: Establish baselines. Review your first segmented P&L. Identify which brands or product lines are above and below your target contribution margin. Flag the bottom 20% of SKUs by profitability.
Week 4: Take action. Make your first portfolio-level decisions based on segmented data. Adjust ad budgets by brand performance. Initiate supplier conversations for low-margin product lines. Review Winners & Losers rankings weekly to catch underperformers.
The biggest shift isn't technical. It's mental. You stop thinking about individual ASINs and start thinking about portfolio allocation. Which brands deserve more inventory? Which marketplaces justify expansion? Which product lines need restructuring or sunsetting?
Who Benefits Most from Portfolio Analytics
Portfolio analytics isn't for everyone. If you sell 10 SKUs under one brand in one marketplace, Seller Central and a spreadsheet work fine. But you'll outgrow that setup faster than you think.
The inflection point typically hits when you cross $1M in annual revenue, or when you add a second brand or marketplace. At that point, the cost of fragmented data exceeds the cost of proper tooling.
Nova serves several types of portfolio operators:
Aggregators Managing acquired brand portfolios need consolidated reporting across 10+ brands with different cost structures.
Brand managers running multiple product lines need segment-level P&L to justify budget allocation.
Agencies Managing client portfolios need per-client reporting with custom cost structures.
Executives Making strategic decisions need portfolio-level dashboards, not ASIN-level noise.
The Portfolio Advantage
The Marketplace Pulse data tells a clear story: Amazon's marketplace is consolidating around operators who manage complexity well. The top 1.6% aren't just bigger. They're more systematic about how they track, analyze, and act on data.
Building portfolio-level analytics isn't optional for sellers scaling past $1M. It's the infrastructure that separates operators who scale profitably from those who scale into chaos.
The tools exist. The frameworks are proven. The only question is whether you'll build your portfolio operating system before or after your competitors do.
Ready to Transform Your Amazon Business?
Join thousands of successful sellers who use Nova Analytics to make data-driven decisions and maximize their profits.
Connect all your seller accounts to a single analytics platform like Nova. Use Custom Breakdowns to segment your catalog by brand, supplier, manager, or any custom dimension. This lets you see P&L per brand instead of managing a flat list of hundreds of ASINs.
ASIN-level analytics optimizes individual products (ACoS, BSR, conversion). Portfolio-level analytics optimizes resource allocation across brands, suppliers, and regions. The shift from ASIN to portfolio thinking is where sellers at $1M+ unlock the biggest profitability gains.
Contribution margin by brand/segment (not just ACoS), portfolio-level TACoS, inventory velocity by product line, and margin analysis for underperformers. Top operators review these daily alongside real-time sales data; fees, ad spend and inventory follow their own reporting schedules.
With Nova, the 30-day roadmap is: Week 1 (connect accounts, set COGS), Week 2 (create Custom Breakdowns, tag SKUs), Week 3 (review first segmented P&L, establish baselines), Week 4 (make first portfolio decisions, review performance dashboards regularly). Most sellers see actionable insights by end of Week 2.