Amazon gives you two ways to group products: ad portfolios and parent ASINs. That's it. For sellers managing 50+ SKUs, this limitation becomes a decision-making bottleneck. Learn the 12 segmentation dimensions that matter most.
Amazon's built-in tools give you two ways to group products: ad portfolios for campaign management, and parent ASINs for variant families. That's it. You can't group by supplier, brand manager, lifecycle stage, or supplier margin. For sellers managing 50+ SKUs, this limitation becomes a decision-making bottleneck. You can't see which supplier relationships are actually profitable. You can't track products by manager to measure team performance. You can't set different profitability targets for new launches versus mature products. The recommendations below are drawn from cockpit reviews, not from generic best-practice lists.
The best-performing multi-brand operators solve this problem with product segmentation. Instead of a flat list of 500 ASINs, they organize products into logical groups that align with how they actually think about their business. Then they apply those groups everywhere: P&L analysis, performance tracking, A/B testing, forecasting.
This guide explains why segmentation is essential at scale, shows you the 12 dimensions that matter most, and walks you through implementing a segmentation system that works across every Nova dashboard.
Why Flat ASIN Lists Break at 50+ SKUs
A single-brand seller with 20 SKUs can manage profitability by scanning Seller Central's catalog reports. Every product is visible. Every underperformer jumps out.
Add a second brand, or grow to 75 SKUs, and the math changes. Suddenly you have a flat list. There's no structure. Your P&L report shows 75 line items. Your Winners & Losers dashboard flags 12 underperformers. But you have no way to quickly answer critical questions:
Which supplier relationships are actually profitable? You have 6 suppliers. One might be dragging down your margin, but the data is buried in a 75-row spreadsheet.
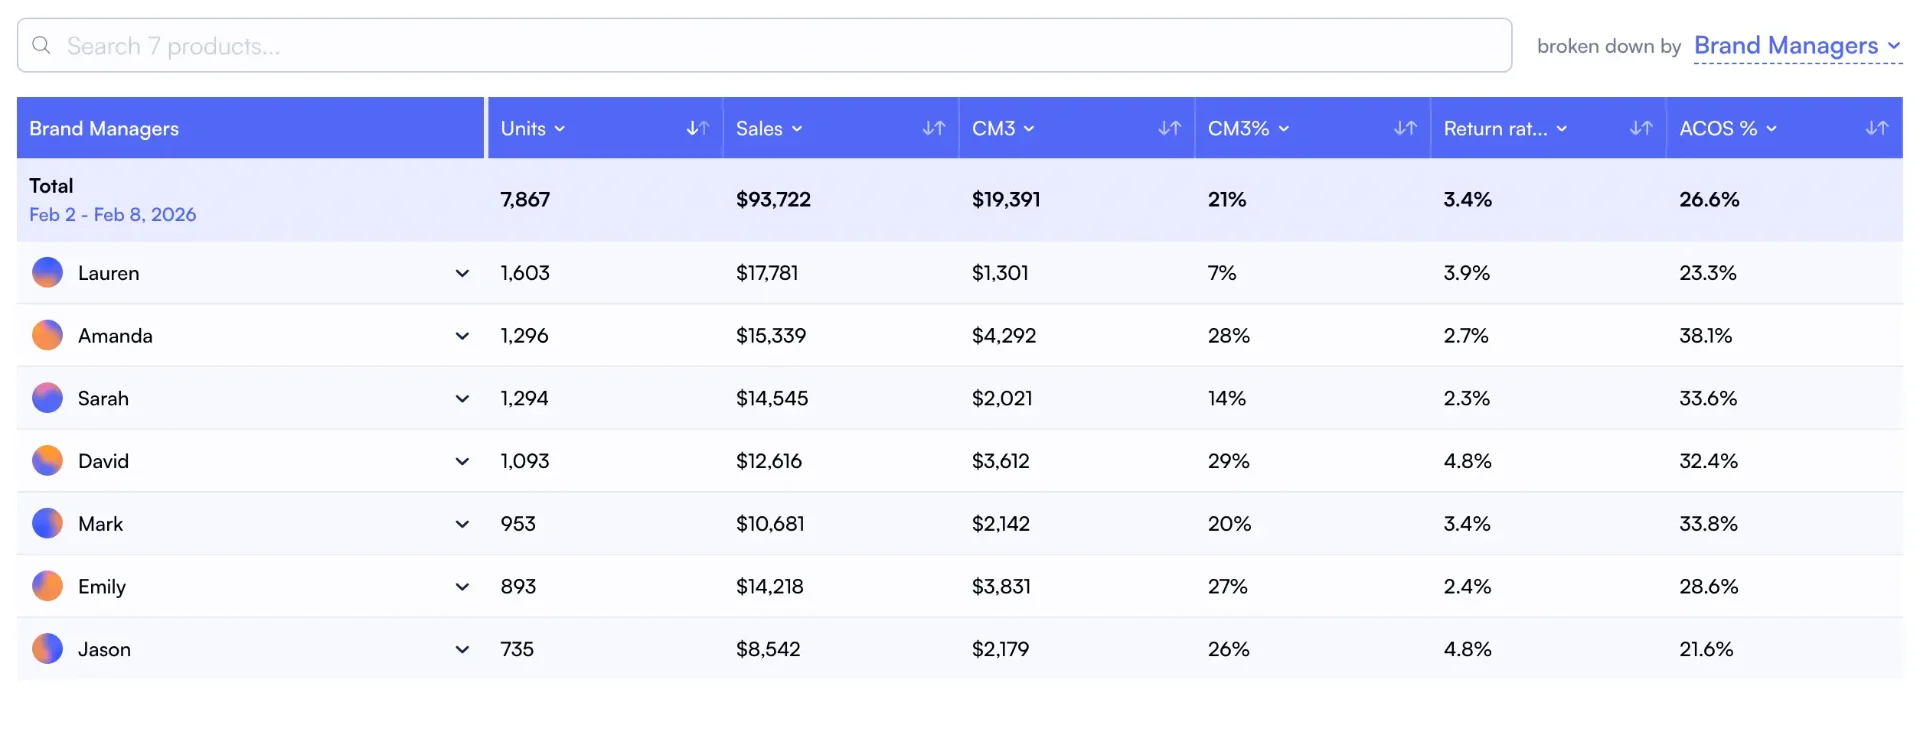
How much is each brand manager's portfolio contributing? Without assigning products to people, you can't measure performance or allocate bonuses fairly.
Is this product underperforming because it's new, or because it's genuinely broken? A 3-month-old product should have different profitability targets than a 3-year-old cash cow.
Which product lines should get more ad spend? If you're running 40 ads, you need to know if they're hitting the right products, and whether those products are actually profitable.
The Segmentation Problem at Different Portfolio Sizes
Portfolio Size
Main Pain Point
Cost of Inaction
20-50 SKUs
Supplier/manager visibility starting to slip
Missing 1-2 underperformers per month
50-150 SKUs
Can't map performance to decision-makers
Wasted ad spend on poor products; poor team visibility
150-300+ SKUs
Portfolio-level decision-making breaks down
Hidden unprofitable lines drag whole business down
Without segmentation, you're not managing a portfolio. You're managing a pile. And piles get messy fast.
The 12 Segmentation Dimensions That Matter
Not every segmentation dimension works for every seller. But across hundreds of high-performing sellers, these 12 emerge as the most valuable. Each one answers a different business question.
Operational Dimensions
Brand - Which brand earns its shelf space?
Supplier/Manufacturer - Which suppliers are profitable?
Brand Manager - Who's responsible for results?
Category/Product Line - Which categories drive margin?
The key insight: you don't need to use all 12. You need the 2-4 that align with how your team makes decisions. If you're a brand manager running three brands, you segment by Brand. If you're managing multiple suppliers, you segment by Supplier. If you're tracking team performance, you segment by Manager. Mix and match based on your business model.
Real Examples: Supplier Profitability and License Tracking
Case Study 1: Supplier-Level Profitability
Etail Distribution manages 52 SKUs across multiple suppliers (Abus, Artemio, etc.). Before segmentation, their P&L report was a flat list: 52 rows of data, no visibility into supplier profitability.
The Problem: One supplier was consistently delivering products with thin margins. Their prices were losing in the race to the bottom, but because the data was mixed with other suppliers, the problem was invisible.
The Fix: they created a Supplier breakdow that grouped all 52 SKUs by their supplier. Immediately, they could see: Supplier A (margin: 18%), Supplier B (margin: 12%), Supplier C (margin: 7%). Supplier C was renegotiated. Profitability improved within a month.
Case Study 2: Licensed Brand Portfolio Tracking
Rajni manages 22 individual IP licenses (Harry Potter, Beetlejuice, Friends, etc.). Each license is a separate P&L unit with different royalty rates and contract terms. Without proper segmentation, she was manually checking each license's performance separately.
The Problem: some licenses were underperforming but the performance was buried across 500+ SKUs. She couldn't tell at a glance which licenses to push and which to sunset.
The Fix: Created a License breakdown that grouped all 500+ SKUs by the IP they represent. Now she sees all 22 licenses side-by-side in her P&L: which ones are earning above their royalty cost, which are just breaking even, which should be discontinued.
How Segmentation Works Across Every Dashboard
Creating a segmentation system is only valuable if it works everywhere. That's why the best approach is to implement it once, then automatically apply it to every analysis.
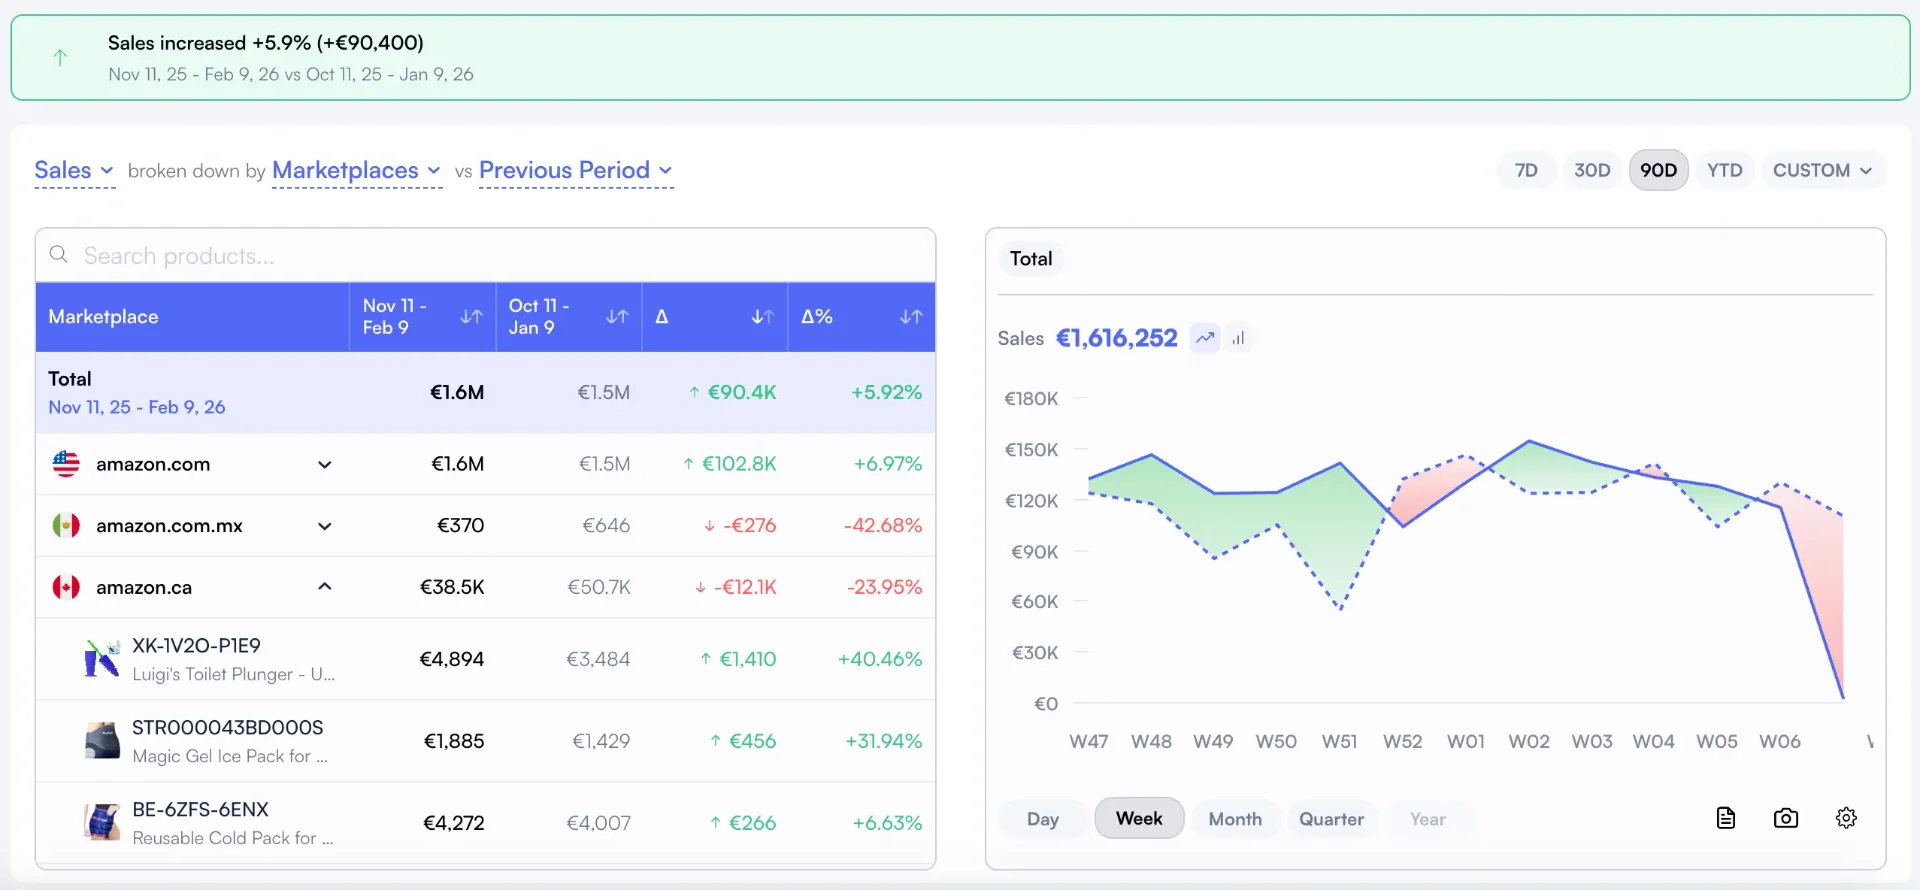
Nova's Custom Breakdowns feature lets you tag products with custom dimensions (Supplier, Manager, Lifecycle, etc.). Once tagged, those dimensions automatically populate across:
Pro Tip: Tag Products Once, Analyze Everywhere
The most efficient sellers tag their products with all relevant dimensions upfront. Then they can:
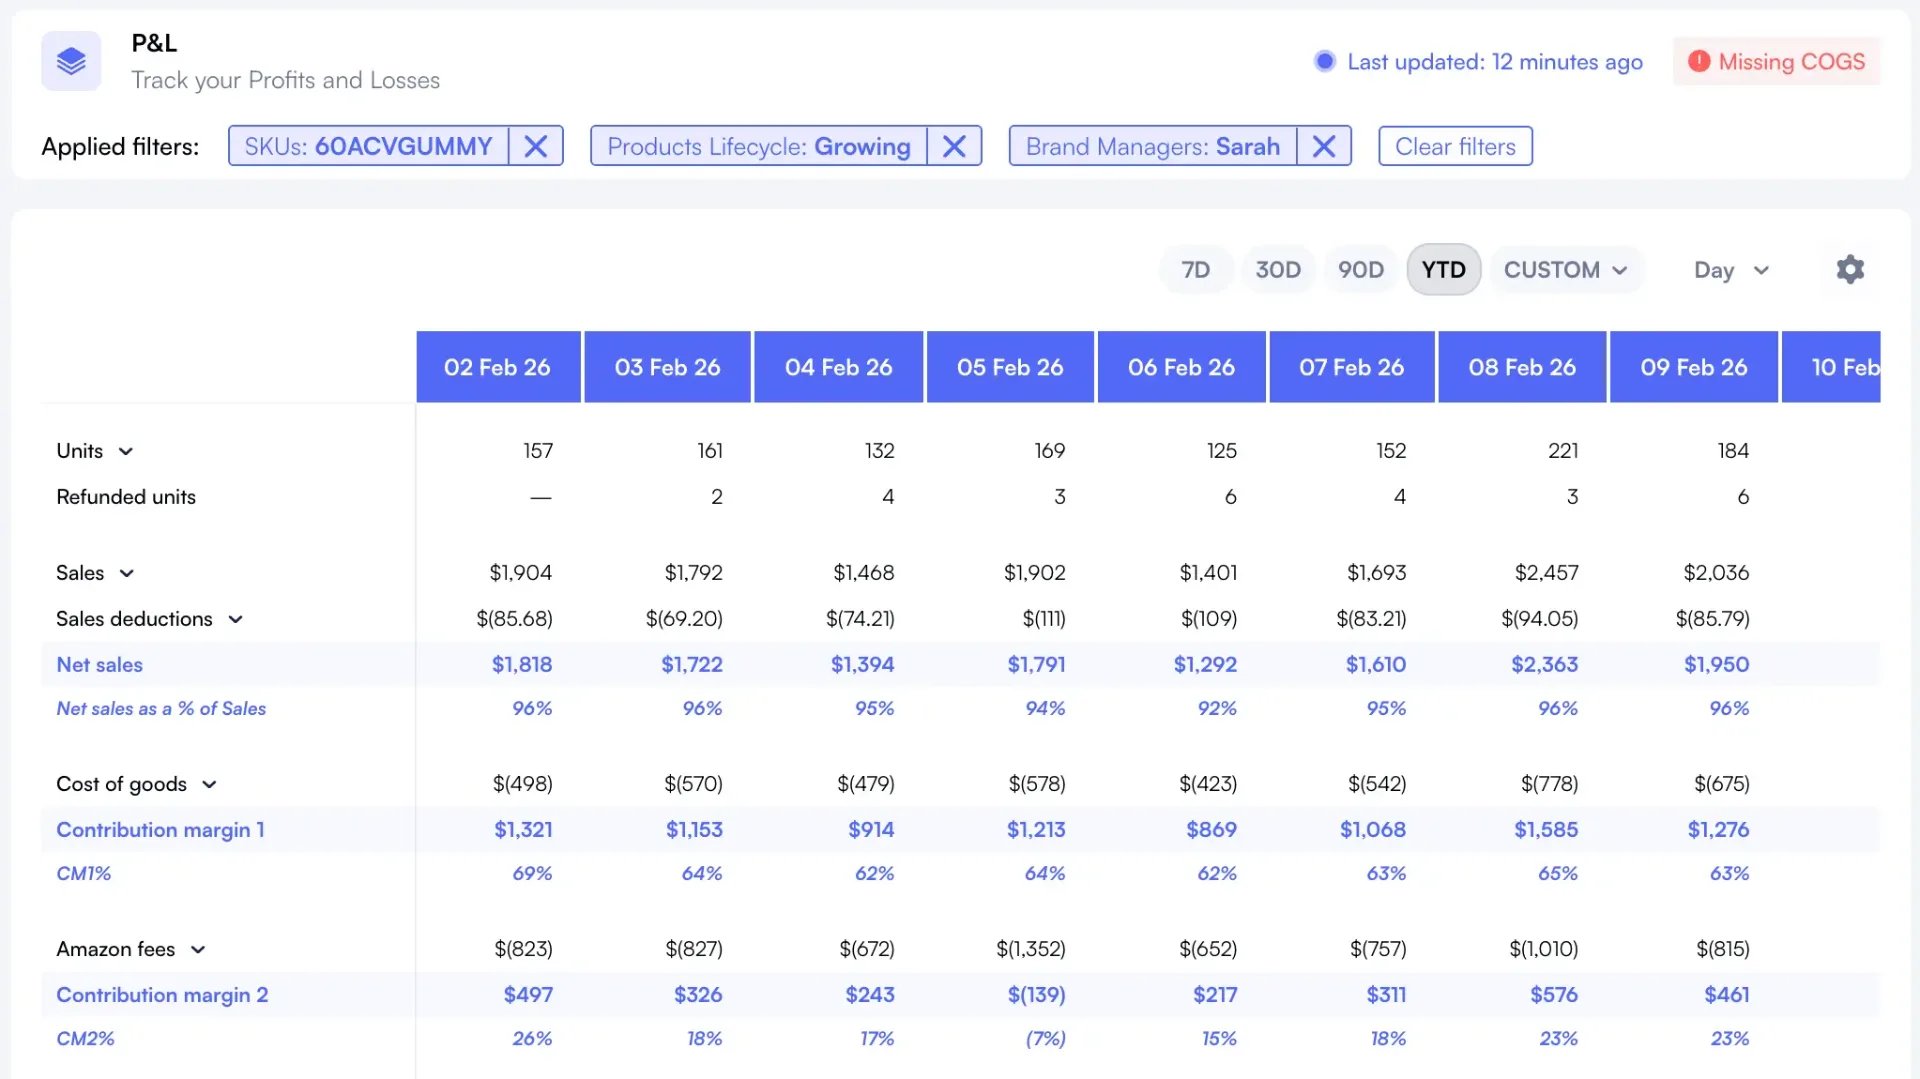
P&L Analysis: View profitability by Supplier, Brand, Lifecycle, Manager, or any combination
Winners & Losers: Automatically flag underperformers by segment (e.g., "Which suppliers have products below 12% margin?")
A/B Testing: Measure test impact on different segments (e.g., "How did the pricing change affect our premium vs. Budget tier products?")
Daily Dashboard: Monitor daily performance sliced by your segmentation (e.g., "What's today's margin by brand?")
Example: Custom P&L with Segmentation Applied
Your P&L report normally shows 75 ASINs in a flat list. Apply a Supplier breakdown, and you get:
Instantly you can see which suppliers to double down on and which to renegotiate. And this same breakdown automatically applies to your Winners & Losers analysis. Now you can flag "Which ASINs from Supplier C are dragging down their margin?"
Step-by-Step: Creating Your First Breakdown
Implementing segmentation doesn't require a data migration or complex setup. It's as simple as organizing your products:
5-Step Breakdown Setup
Step 1: Choose Your Dimension
Pick one dimension that answers your most urgent question. (e.g., Supplier profitability, Manager performance, Brand P&L)
Step 2: Tag Your Products
In Nova's Products Feed, bulk-assign your products to groups within that dimension. For 100 SKUs, this takes 10-15 minutes with bulk operations.
Step 3: Review Your First Breakdown P&L
Open Custom P&L, apply your new breakdown. You now see profitability by that dimension for the first time.
Step 4: Add a Second Dimension
Once the first dimension proves valuable, add a second. (e.g., Supplier + Lifecycle, or Brand + Manager)
Step 5: Apply Across All Dashboards
Your breakdowns now automatically populate in Winners & Losers, A/B Testing, and Daily Performance dashboards. Every analysis is automatically sliced by your segments.
Advanced: Multi-Dimensional Analysis
Once you've mastered single-dimension breakdowns (Supplier, Manager, Lifecycle), the next level is combining them. This is where portfolio operators gain a real competitive edge.
Example: You want to understand profitability by Supplier AND Lifecycle. So you create a multi-dimensional analysis:
Supplier
Launch Stage
Growth Stage
Mature Stage
Supplier A
18% margin
22% margin
16% margin
Supplier B
12% margin
18% margin
14% margin
Supplier C
8% margin
10% margin
9% margin
This tells you:
Growth-stage products from Supplier A are your stars (22% margin). Allocate more ad spend here.
Launch-stage products from Supplier C are struggling (8% margin). Either invest heavily to get them to growth, or sunset them.
Supplier B's mature products are underperforming (14% margin). Renegotiate pricing or replace with Supplier A's equivalent.
These insights are impossible without segmentation. With it, they become obvious.
How Segmentation Integrates with Winners & Losers
Winners & Losers automatically flags products falling below your profitability threshold. But it's even more powerful when combined with segmentation.
Instead of a list of 75 flagged ASINs (overwhelming), you see:
Supplier A: 2 underperformers (both new launches; recommend investing in ads)
Now you have actionable next steps for each supplier, each manager, each brand. That's the power of segmentation.
Integration with A/B Testing by Segment
A/B Testing becomes dramatically more valuable when you measure impact on specific segments. For example:
Test: New product images for premium vs. Budget tier products. Measure conversion lift by Price Tier segment.
Test: Different PPC bid strategies by lifecycle stage. Track ACOS impact for Launch, Growth, and Mature products separately.
Test: Promotional discounts by supplier. Measure margin impact (are they driving volume or just cannibalizing margin?) by Supplier segment.
Without segmentation, you measure overall impact. With segmentation, you measure impact on the segments that matter most to your business.
Common Segmentation Mistakes
Pitfalls to Avoid
Too many dimensions at once. Start with 1, add 1 per week. Too many dimensions upfront leads to decision fatigue.
Tags that don't align with how your team talks. If your team says "supplier," use Supplier. Not "Vendor" or "Manufacturer." Consistency matters.
Outdated tags. Set up a monthly review to update product tags (move products between lifecycle stages, add new suppliers, etc.).
Tags that are too granular. 50 suppliers is more granular than useful. Group related suppliers into 5-8 categories. Aim for 3-8 categories per dimension.
Forgetting to tag new products. As you launch new SKUs, tag them immediately. Don't let them sit in "Untagged."
Key Takeaways
Segmentation solves the portfolio visibility problem. With 50+ SKUs, a flat list becomes unmanageable. Segmentation organizes products into logical groups that map to business decisions.
Start with one dimension, expand from there. Don't try to implement all 12 segmentation approaches at once. Pick the one that answers your most urgent question, tag your products, and measure impact.
Tag once, analyze everywhere. Nova applies your breakdowns to P&L, Winners & Losers, A/B Testing, and daily performance dashboards automatically. Maximum insight with minimal setup.
Multi-dimensional segmentation powers portfolio optimization. Combine Supplier + Lifecycle or Brand + Manager to unlock insights impossible in flat data.
Segmentation isn't a feature. It's an operating system for portfolio management. The top 1% of sellers use it to organize complexity into clarity. You should too.
Start with one. Pick the dimension that answers your most urgent question (supplier profitability, brand performance, or lifecycle stage). Add a second dimension after 2-3 weeks. Most mature operators use 3-5 dimensions actively.
Around 50 SKUs. Below that, you can scan a flat list and spot underperformers manually. Above 50, the cognitive load of managing individual ASINs exceeds human capacity. At 150+, segmentation is non-negotiable for portfolio management.
For 100 SKUs, initial tagging takes 10-15 minutes using bulk operations in Nova's Products Feed. New products should be tagged immediately on launch. Plan a monthly 5-minute review to update lifecycle stages and add new suppliers.
Yes. Nova's Custom Breakdowns support multi-dimensional analysis. You can view profitability by Supplier AND Lifecycle simultaneously, revealing insights like "Which suppliers have the best margins at growth stage?" This is where portfolio operators gain their real competitive edge.