Amazon Category Analytics: A Practical 2026 Guide
Most sellers can name their top SKU. Few can name the category that pays the bills. Tag your catalog once and read the business by category, sub-category, and SKU.
 Claude
Most Amazon sellers can tell you their top SKU. Far fewer can tell you which category of their portfolio actually pays the bills. Seller Central reports stop at the ASIN, ad consoles stop at the campaign, and spreadsheets stop working past 200 SKUs. This guide shows how to set up category-level analytics on Amazon: tag your catalog once, then read your business by category, sub-category, and SKU without rebuilding the report each time.
TL;DR - Key Takeaways
- •Amazon's browse-node categories are a customer discovery taxonomy, not a P&L taxonomy. Most brands need 4 to 8 business categories defined on top of them.
- •Seller Central, Brand Analytics, and the ad console all stop short of a true category P&L. None of them roll up revenue, 40+ fee types, ad spend, and inventory at the category level.
- •Tagging is a one-time setup. Once a SKU has a category, every dashboard, P&L, and export rolls up automatically and new SKUs inherit the rule.
- •Category analytics drives four operational decisions: where to fund growth, where to cut, where storage fees are eating margin, and what story to tell investors or the board.
- •Category is just one dimension. The same tagging engine supports lifecycle stage, brand manager, supplier, price tier, and fulfillment channel.
Our take
If you only do one thing this quarter
Define 4 to 8 business categories that match how you actually run the portfolio (not how Amazon classifies you), tag every active SKU once, and put a category P&L next to your existing SKU view. The first month of clean category data usually surfaces one or two sub-categories that should be cut and one that deserves more inventory and ad spend.
- •Brands above 50 active SKUs where SKU-by-SKU reporting has stopped scaling
- •Operators running multiple product lines under one Seller Central account
- •Aggregators and agencies that need a category view across brands and marketplaces
- •Single-product sellers under 20 SKUs where one P&L per SKU is still readable
- •Pure 1P Vendor Central operations (different reporting model)
What "category analytics" actually means on Amazon
On Amazon, "category" can mean three different things, and most of the confusion in this space comes from mixing them up.
The first is Amazon's browse-node category: the path a customer follows from Home and Kitchen down to Coffee, Tea and Espresso. Useful for discovery, almost useless for P&L. A single brand often spans 6 to 12 browse nodes, and Amazon decides which one a SKU lives in based on classification rules you do not fully control.
The second is the referral fee category, which determines whether you pay 8%, 15%, or 17% per sale. Important for unit economics, not granular enough for portfolio decisions.
The third, and the one this guide is about, is your business category: the way you actually segment your own catalog. A coffee brand might run on three categories (Single-Origin, Blends, Accessories) regardless of how Amazon classifies them. That is the taxonomy you need for category analytics.
Why the standard Amazon reports fail at category level
Seller Central, Brand Analytics, and the ad console each give you a slice of the picture, and none of them give you a category P&L.
Where standard Amazon reports stop short
| Tool | What it shows | What is missing for category analytics |
|---|---|---|
| Business Reports | Sales and traffic by ASIN or parent ASIN | No COGS, no ad spend allocation, no fee breakdown, no business categories |
| Brand Analytics | Customer behavior, search terms, repeat purchase by brand | No P&L, no inventory, no business categories |
| Inventory reports | Units on hand and storage fees by ASIN | Cannot roll up turns or storage cost by category |
| Ad console | Campaign and target performance | No way to attribute spend to a business category that spans multiple campaigns |
| Settlement reports | 40+ fee types per transaction | Raw data, no SKU or category roll-up |
The result is the spreadsheet most operators end up running: a tab per category, manually maintained, refreshed weekly, and quietly out of date by the time the leadership meeting starts. Marketplace Pulse has documented how the rising share of Amazon fees has made unit economics harder to read at any level above the SKU, which is exactly the problem category analytics is built to solve.
How to build category analytics in 4 steps
The setup is almost always the same regardless of catalog size. The difference is whether it takes 20 minutes or 2 hours.
1. Define your category taxonomy
Start with 4 to 8 top-level categories that match the way you already think about the business in monthly reviews. Sub-categories are useful but optional on day one. A clean taxonomy almost always looks closer to how the founder pitches the brand than to how Amazon classifies it.
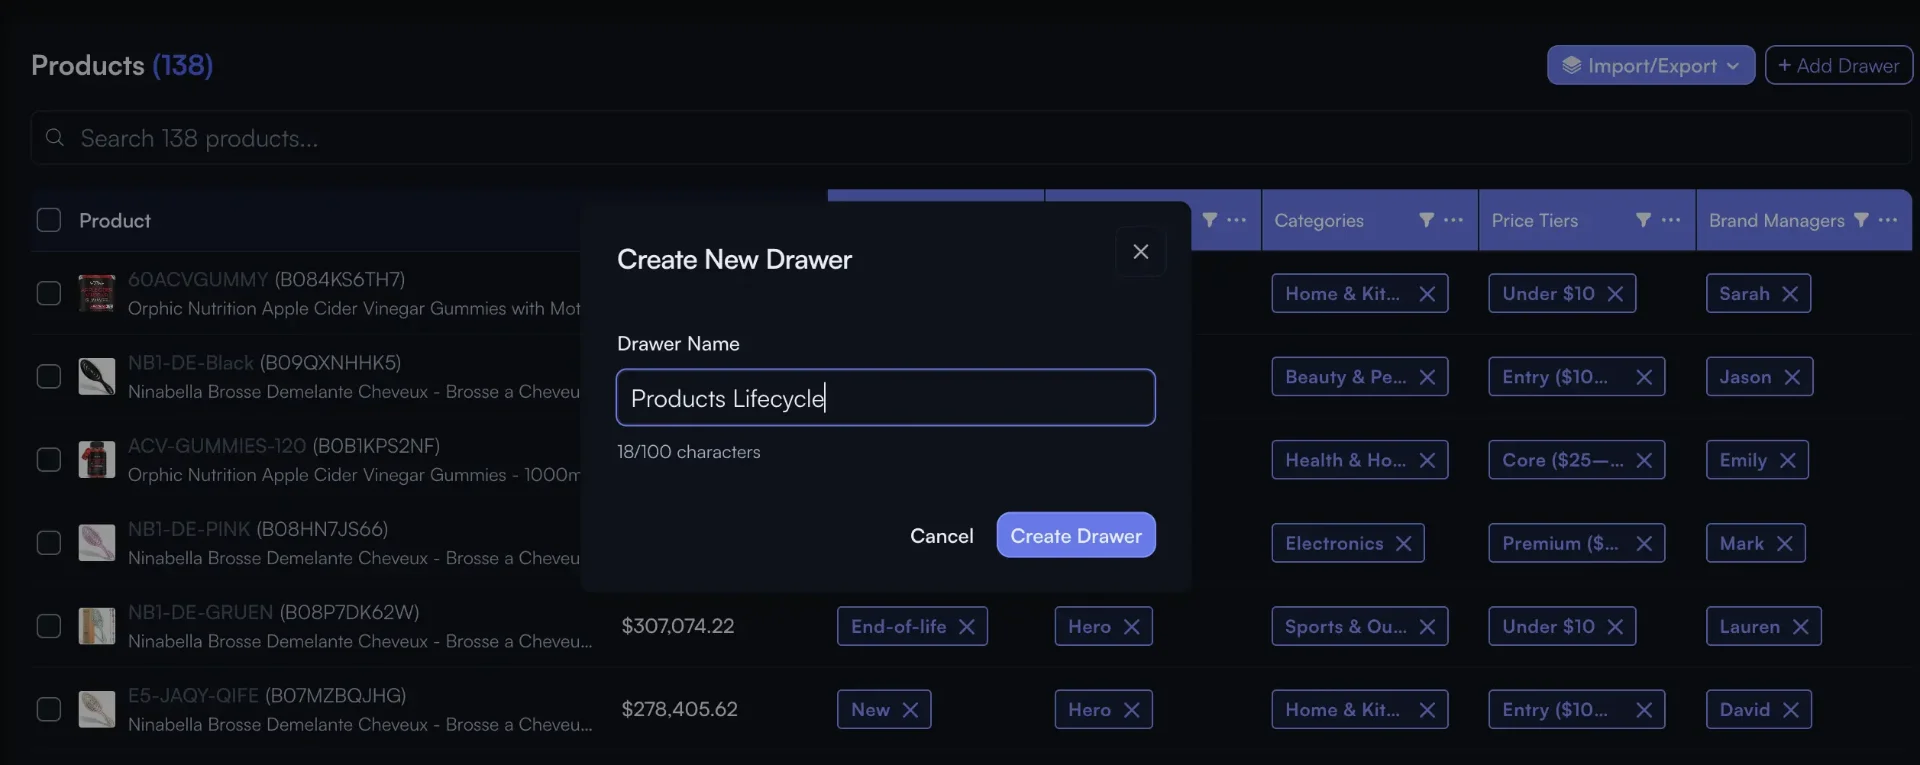
2. Tag your SKUs
Three options, usually combined: bulk import a CSV from your supplier sheet or PIM, accept Nova's browse-node-based suggestions for the obvious matches, and tag the edge cases manually. For most catalogs under 1,000 SKUs, the full pass takes under 90 minutes.
Related read
How to design a tagging strategy that survives a 5x catalog
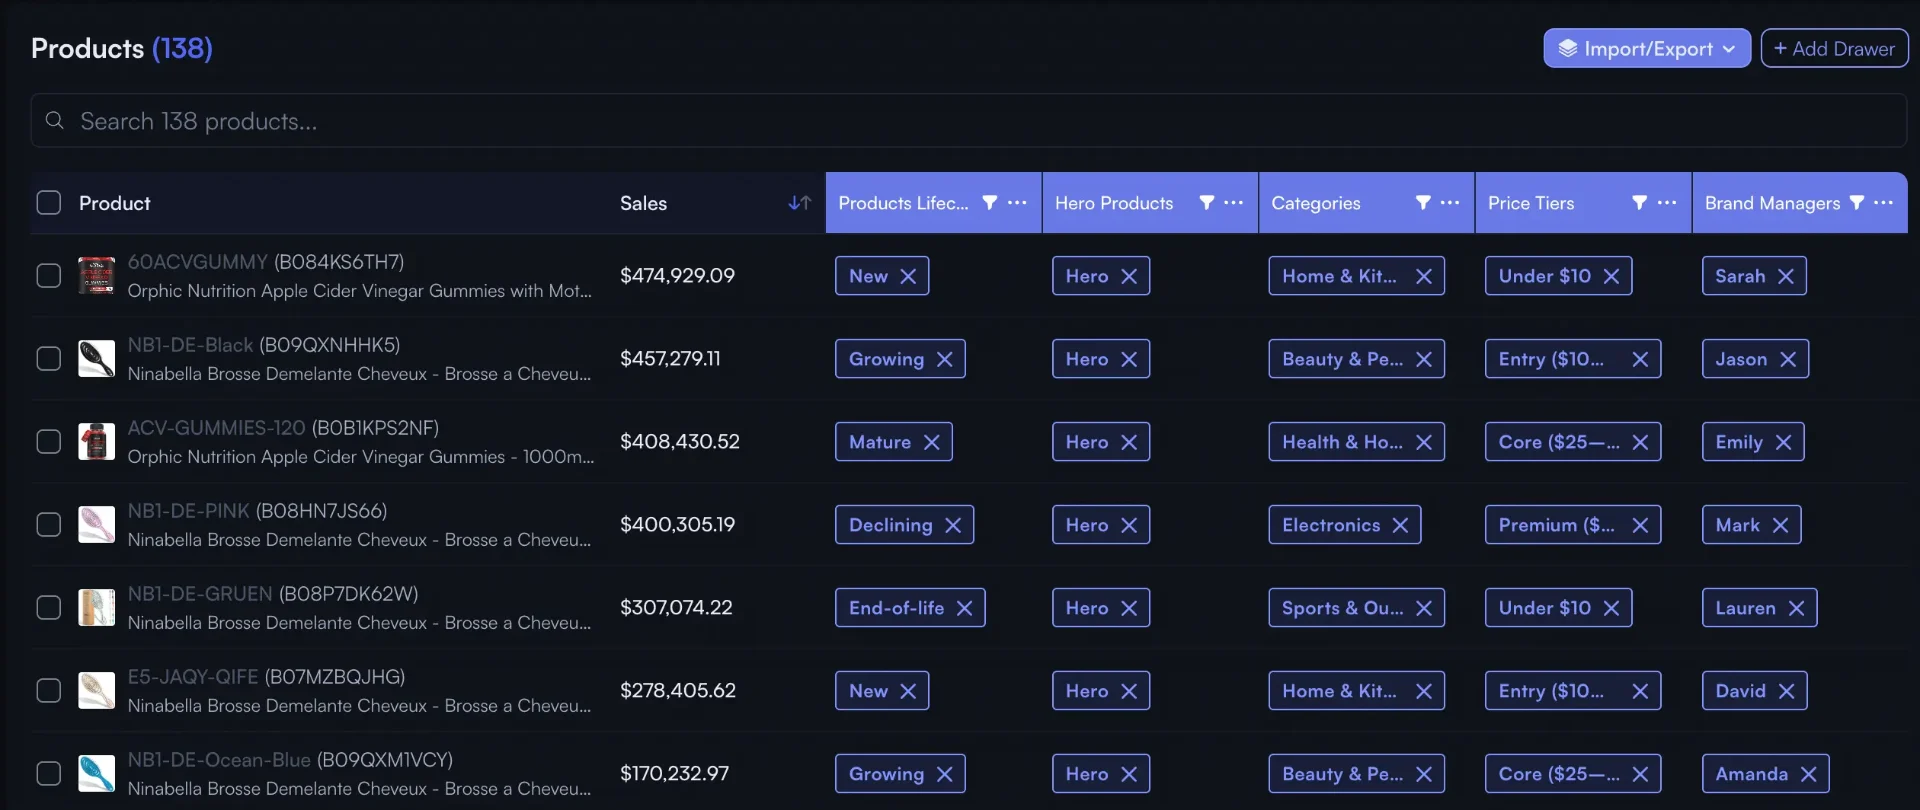
3. Roll up P&L, ads, and inventory by category
Once SKUs are tagged, every existing report inherits the category dimension. Your P&L can be sliced by category, your PPC analytics Aggregates spend at the category level, and your winners and losers view Ranks categories instead of just SKUs.
4. Drill from category to sub-category to SKU
The point of the taxonomy is not to flatten the data. It is to start at the category, spot a swing, and drill into the sub-category and the SKU behind it without leaving the report. That is the workflow that replaces the "open the spreadsheet, find the tab" loop most operators are stuck in.
Nova insight
Tag once, never re-tag. The most expensive mistake we see is teams rebuilding their taxonomy every quarter because the first version was too granular. Start with fewer categories than you think you need. You can always split a category in two later, but merging two categories back together after six months of tagging is painful.
See your portfolio by category in under 10 minutes
Connect Seller Central, tag your SKUs, and read a real category P&L. 14-day free trial, no credit card.
6 metrics every category view must have
A category view that only shows revenue is barely better than the Business Reports tab. The minimum useful set is six metrics, refreshed at least daily, with the ability to drill from category to SKU.
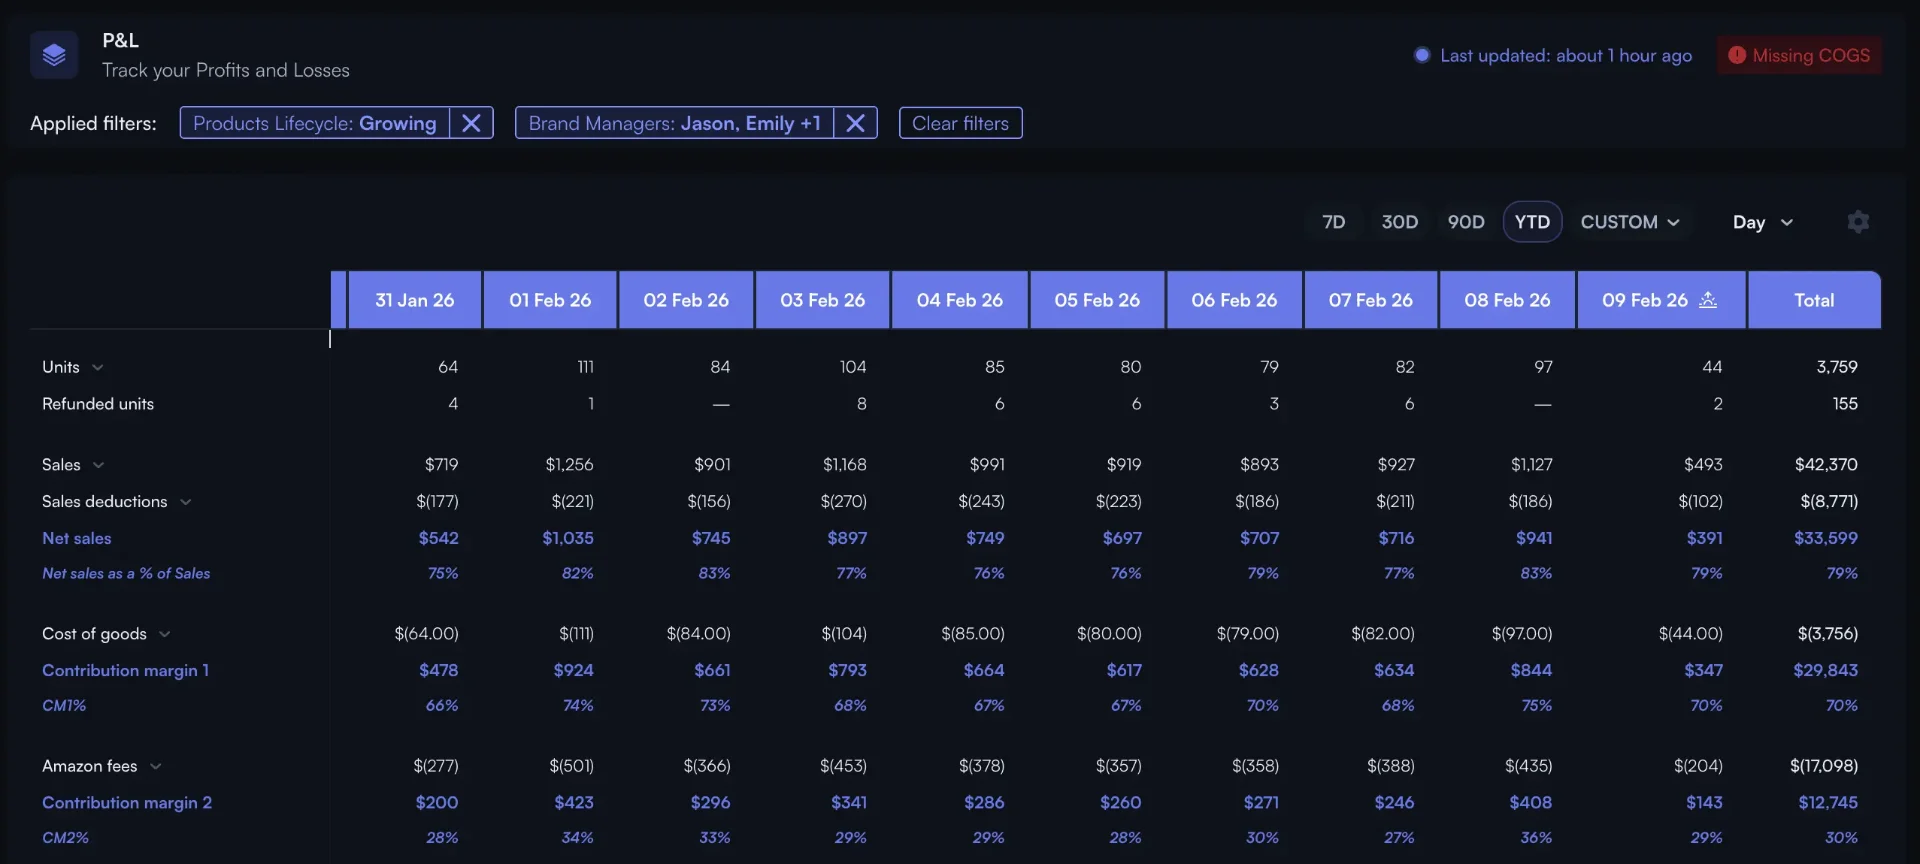
- Category P&L: Revenue, all 40+ fee types, COGS, ad spend, returns, contribution margin. The core view.
- Contribution margin %: the operational answer to "does this category pay for itself?".
- TACoS by category: Ad spend as a share of total category sales, not just ad-attributed sales.
- Inventory turns and days of cover: which categories tie up working capital and which sell through fast.
- Return rate: Often the metric that quietly destroys an apparently profitable category.
- Share of catalog revenue: the concentration view that tells you how exposed the business is to one category.
Related read
2026 Amazon profit margin benchmarks across 10 categories
4 decisions category analytics actually unlocks
The point of the taxonomy is not the dashboard. It is the decisions that get easier once the dashboard exists.
1. Funding decisions
Where to put the next $50K of inventory and the next $10K of ad spend. With a category P&L, the answer is the category with the best contribution margin and the most headroom in TACoS, not the SKU that happened to spike last week.
2. Cannibalization checks
When a new sub-category launches inside an existing category, the question is always whether it grew the pie or just shifted demand. A category view with sub-category drill answers this in one click instead of a spreadsheet rebuild.
3. Storage-fee risk
Long-term storage fees and aged-inventory surcharges hit at the SKU level but cluster by category. A category-level inventory view surfaces the categories where you are 60 days from a surcharge, not 6 days from a stockout.
4. Board and investor reporting
Investors and acquirers do not care about your top 10 SKUs. They care about category mix, category growth, and category margin. A clean category P&L is the difference between a 3-hour data pull before every board meeting and a one-click export.
Home and kitchen brand, ~600 SKUs, US and EU
The team had a healthy top line but flat net margin. After tagging the catalog into 6 categories and 18 sub-categories, two sub-categories showed negative contribution margin once storage fees were allocated correctly. They cut 6 SKUs across those sub-categories and re-allocated the saved working capital to the best-performing category.
Net margin
Active SKUs
Storage fees / revenue
TACoS (top category)
How: Defined 6 business categories on top of Amazon's browse nodes, ran a 30-day category P&L, and used the contribution-margin view to identify SKUs to discontinue. The taxonomy was set up once and has not changed since.
Get More Amazon Seller Tips
Subscribe to our newsletter for weekly insights, strategies, and market updates.
Category is just one dimension
Once the tagging engine is in place, category is rarely the only dimension that matters. The same SKU can be tagged by lifecycle stage (launch, growth, mature, end-of-life), brand manager, supplier, price tier, and fulfillment channel (FBA, FBM, AWD). Each tag unlocks a new way to read the portfolio without rebuilding any reports.
For a deeper view of the other dimensions worth tagging, see our portfolio segmentation guide, or the broader catalog profit optimization playbook. For multi-brand operators running several Seller Central accounts in parallel, the multi-account analytics view Rolls categories up across accounts.
Frequently asked questions
The bottom line
Category analytics is not a new dashboard. It is a one-time tagging exercise that unlocks every dashboard you already have. Define 4 to 8 business categories, tag the catalog once, and stop reading the business one ASIN at a time. The first 30 days of clean category data almost always pay for the setup several times over.
Ready to Transform Your Amazon Business?
Join thousands of successful sellers who use Nova Analytics to make data-driven decisions and maximize their profits.
Continue Learning
Explore more expert insights to grow your Amazon business
Amazon Portfolio Segmentation Guide
Amazon gives you two ways to group products: ad portfolios and parent ASINs. That's it. For sellers managing 50+ SKUs, this limitation becomes a decision-making bottleneck. Learn the 12 segmentation dimensions that matter most.
Amazon Multi-Brand Analytics 2026
Just 111 sellers generate 10% of Amazon's $300B U.S. third-party GMV. Learn how top portfolio operators structure analytics across multiple brands, regions, and product lines to maintain profitability at scale.
Why Amazon profit tracking is broken in 2026
Seller Central reports lie by omission, spreadsheets buckle under 40+ fee types, and most analytics tools paper over the gaps. Here is what actually broke and how serious operators are fixing it.