NovaClaudeMCP

Free for lifeClaim your lifetime free access to Nova MCP for Claude before 07/31!

Back to Blog
Strategy
Featured
Updated May 18, 2026

Amazon P&L Statement: How to Build and Analyze for

Build accurate Amazon P&L statements with contribution margin analysis. Learn to identify profitable products, optimize margins, and make data-driven decisions.

M
·COO at Nova AnalyticsLinkedIn

Max leads operations at Nova Analytics, helping Amazon sellers optimize their business performance through data-driven insights and strategic automation.

Oct 25, 2025·14 min

Your Amazon Profit & Loss (P&L) statement is the single most important financial document for understanding business health, identifying profitable products, and making data-driven decisions. Yet most sellers struggle to build accurate P&Ls because Amazon's fee complexity, PPC allocation, and COGS tracking make manual calculation nearly impossible. Across cohorts, the brands stuck at the same revenue line for 18 months tend to under-measure the items below.

This guide shows you exactly how to build an Amazon P&L statement with contribution margin analysis (CM1/CM2/CM3), analyze profitability at the product level, and use P&L insights to optimize your Amazon business for maximum profit.

What Makes an Amazon P&L Different

A traditional retail P&L has 3-5 major expense categories. Amazon sellers deal with 15-20 distinct cost buckets that vary by product size, category, season, and marketplace. A proper Amazon P&L must account for:

Revenue Adjustments

  • Gross product sales
  • Refunds and returns
  • Promotional discounts
  • Lightning deals
  • Subscribe & Save discounts
  • Gift wrap revenue

Amazon-Specific Costs

  • 9 different fee categories
  • PPC by product allocation
  • Returns processing fees
  • Refund admin fees
  • Long-term storage penalties
  • Removal/disposal fees

Reality check: A "simple" $100K/month Amazon business generates 2,000-5,000 transactions monthly. Manual P&L building requires 8-12 hours of work. Specialized software (like Nova) does this automatically with 99.8% accuracy in real-time.

Building Your Amazon P&L: the Nova structure

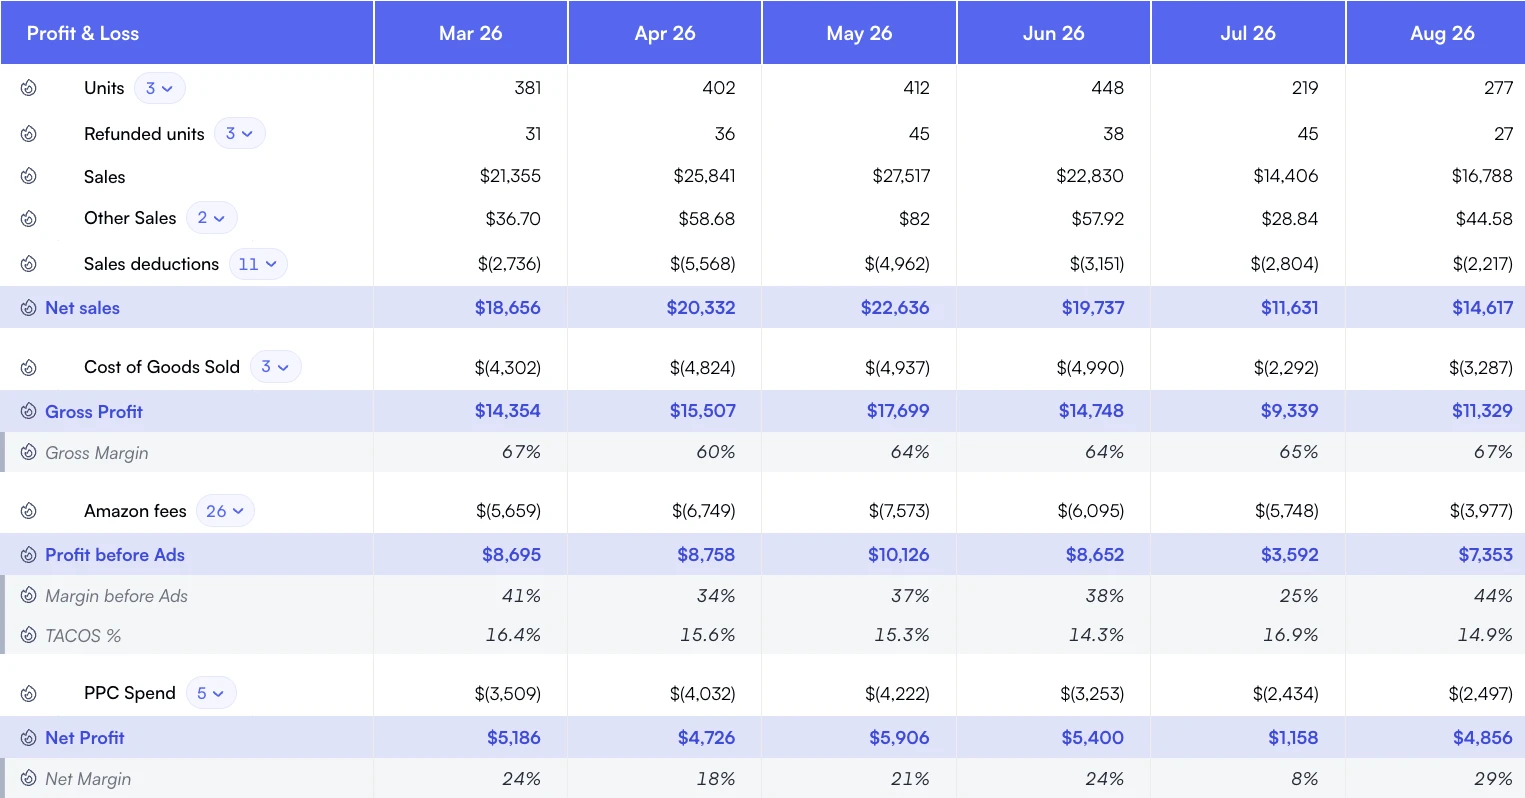
Nova builds the P&L in three contribution margin layers: CM1 after Cost of goods, CM2 after Amazon fees, and CM3 after Advertising. Every line item is expressed as a percentage of Net sales, so you can compare periods on an apples-to-apples basis. Here's the exact structure you'll see inside Nova:

Monthly P&L - March 2026
VOLUME
Units: 32,140
Returned units: 808
REVENUE
Sales (Product): $150,000
Other Sales (Shipping + Giftwrap): $1,200
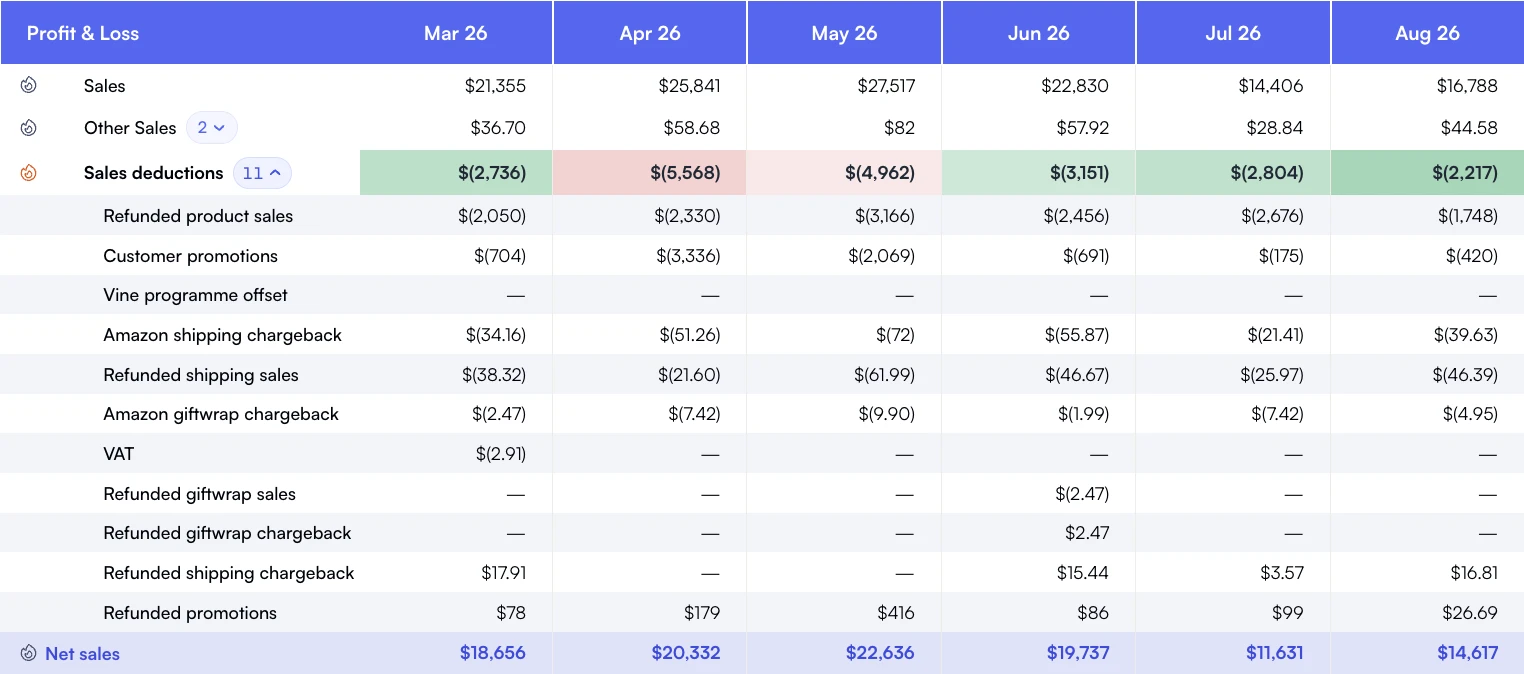
Sales deductions: ($14,700)
- VAT, Refunded product sales, Promotions, Amazon shipping chargeback, Refunded shipping sales, Refunded promotions, Refunded VAT…
= Net sales: $136,500
Net sales as a % of Sales: 90%
COST OF GOODS
Cost of goods sold: ($24,300)
Sunk COGS - Amazon lost/damaged: ($120)
Recovered COGS - returned: $170
= Total Cost of goods: ($24,250)
CONTRIBUTION MARGIN 1 (CM1)
$112,250 - CM1% 82%
AMAZON FEES
FBA fulfillment fee: ($28,800)
Referral fee: ($22,500)
FBA storage fee: ($2,650)
FBA inbound placement fee: ($840)
FBA inbound transportation fee: ($600)
FBA long-term storage fee: ($170)
FBA disposal fee: ($150)
Digital services fee: ($130)
Deal performance fee: ($550)
Coupon performance fee: ($410)
Amazon subscription fee: ($40)
FBA reimbursements (warehouse damage / lost / missing): $4,150
+ 25 more fee types tracked (Sales tax service fee, MFN concession, AWD STAR storage, Refunded digital services fee…)
= Total Amazon fees: ($60,000)
CONTRIBUTION MARGIN 2 (CM2)
$52,250 - CM2% 38%
ADVERTISING COSTS
Sponsored products: ($12,800)
Sponsored brands: ($1,150)
Sponsored display: ($350)
Sponsored brands video: ($200)
= Total Advertising costs: ($14,500)
CONTRIBUTION MARGIN 3 (CM3)
$37,750 - CM3% 28%

Nova's automated P&L stops at CM3, the contribution profile fully attributable to each SKU. Operating expenses (salaries, software, professional services, office) sit below CM3 in your accounting P&L and are not allocated per product, since they aren't driven by individual SKU performance.

Reading the percentages

Every cost line is expressed as a percentage of Net sales. That's why CM1%, CM2% and CM3% are the three numbers to watch:

  • CM1% - how much margin survives Cost of goods. Drops here mean supplier price hikes, freight, or recovery issues.
  • CM2% - what's left after Amazon fees. Drops here usually mean fee changes (FBA fulfillment, storage) or a worse product mix.
  • CM3% - what's left after Advertising. This is the true SKU-level contribution. Track it weekly to catch products that no longer fund their own ads.

The 2026 fee changes most P&Ls still miss

Amazon adjusted several fees between late 2025 and Q1 2026, and any P&L built before those updates is quietly misreading margin. The three biggest shifts to reconcile in your model:

  • FBA fulfillment fee bumps: Small standard and large standard tiers moved again with the January 2026 rate card. SKUs that were +18% CM3 in November can sit at +14% today without anything else changing.
  • Inbound placement service fee: Still optional, but the "minimal shipment splits" default routes are pricier than the legacy single-destination path. If your COGS line excludes inbound placement, CM1% is overstated.
  • Low-inventory-level fee: Charged on units below the trailing 28-day cover. It hits CM2, not COGS, so it shows up as a margin compression that looks like an Amazon fee creep rather than an operations problem.

Why fee tracking is the second step in our P&L workflow

Nova tracks 40+ distinct Amazon fee types and reconciles them against settlement reports hourly. Sellers who only model the "big five" (FBA fulfillment, referral, storage, ads, refunds) typically misstate CM2 by 2-4 percentage points. On a $150K month, that's $3K-$6K of margin you think you have and don't.

The fix is structural, not cosmetic. Don't add a "miscellaneous fees" line and call it a day. Map every fee type to its CM layer (COGS, CM2, or CM3), express each as a percentage of Net sales, and review the largest movers weekly. The product-level view is where the actionable signal lives: an SKU whose CM3 quietly slid from 22% to 14% over a quarter is almost always a fee-mix problem, not a top-line one. To pressure-test a single SKU before you wire up the full P&L, run it through our Amazon FBA profit & fee calculator.

Case study·60 days

Home-goods FBA brand (1,200 SKU catalog, $1.8M/yr)

The team was running their P&L in Sheets with a 'fees' bucket pulled monthly from settlement reports. After the Q1 2026 fee update, blended CM2% looked flat, but seven SKUs had silently fallen below CM3 breakeven.

Fee types tracked

840+

SKUs flagged below CM3 breakeven

0 (unknown)7

Monthly CM3

$28,400$33,900

How: Switching from a single 'fees' bucket to a per-fee-type allocation, then filtering SKUs by CM3%, surfaced $5,500/mo of hidden margin loss inside two weeks.

Related read

COGS tracking for Amazon sellers: every cost that belongs above CM1

Get Real-Time P&L Visibility

Stop building P&Ls manually in spreadsheets. Nova generates accurate product-level P&L statements hourly, with contribution margin analysis built-in.

Related read

Amazon Seller Calculator: forecast fees and margin per SKU