Most sellers discover 80% of profit comes from 20% of SKUs. Learn the Keep-Kill-Grow-Fix framework to identify which products drain capital, which to expand, and how brands achieve 34% profit increases by cutting 63% of their catalog.
Most Amazon sellers discover this painful truth: 80% of their profit comes from just 20% of their SKUs. The other 80% drain capital, complicate operations, and hide in "average" metrics. Here's the data-driven framework to identify which products to keep, kill, or grow. The pattern in our cockpit data is consistent: scalers obsess over the items below; plateauers debate strategy.
You're managing 150 SKUs. Revenue looks healthy. But when you dig into true profitability per product, reality hits. Your top 10 SKUs generate 73% of profit. Another 30 SKUs break even. The remaining 110 SKUs? They're actively losing money after accounting for storage fees, long-term storage charges, and advertising costs that never pay back.
This is why Amazon brands need SKU rationalization. Not someday. Now. Research shows every unprofitable SKU costs $247 monthly in hidden expenses [1]. Multiply that by 50 dead SKUs and you're burning $148,200 annually.
What Is SKU Rationalization (And Why Amazon Sellers Need It)
SKU rationalization is the process of analyzing your product portfolio to determine which items to keep selling, which to discontinue, and which to invest more resources into growing. For Amazon sellers, this means evaluating each ASIN against profitability metrics, velocity, and strategic fit.
The core challenge: Amazon Seller Central doesn't show true profitability per SKU. You see revenue. You see units. But contribution margin after FBA fees, storage, PPC, returns, and promotions? That's invisible. So sellers keep funding losers because the data never surfaces the problem.
Average Unprofitable SKUs
38%
Of catalog loses money after all costs
Hidden Cost Per SKU
$247/mo
Storage, fees, and opportunity cost
Portfolio Optimization
34%
Average profit increase after rationalization
Why Traditional Metrics Fail
Looking at revenue per SKU or units sold misses the story. A SKU doing $8K monthly might seem healthy. But after $2.1K in FBA fees, $1.9K in PPC, $680 in storage, and $420 in returns, you're left with $2,900 gross profit on $12K in true costs. That's a 19% loss hidden by revenue reporting.
The Keep-Kill-Grow-Fix Framework
Every SKU falls into one of four categories. The decision matrix uses two axes: contribution margin (profitability) and velocity (how fast it sells). This creates four quadrants that dictate your action plan.
Quadrant
Criteria
Action
KEEP (Stars)
High margin + High velocity
Protect and expand. Never run out of stock.
GROW (Hidden Gems)
High margin + Low velocity
Increase PPC, improve listing, test bundling
FIX (Cash Cows)
Low margin + High velocity
Reduce costs, raise price, cut wasteful PPC
KILL (Dogs)
Low margin + Low velocity
Liquidate, bundle out, or discontinue
Companies that actively prune low-performers see 15-40% profit improvements without adding new products [2]. The wins come from reallocating capital and focus to what actually works.
Step 1: Calculate True Profitability Per SKU
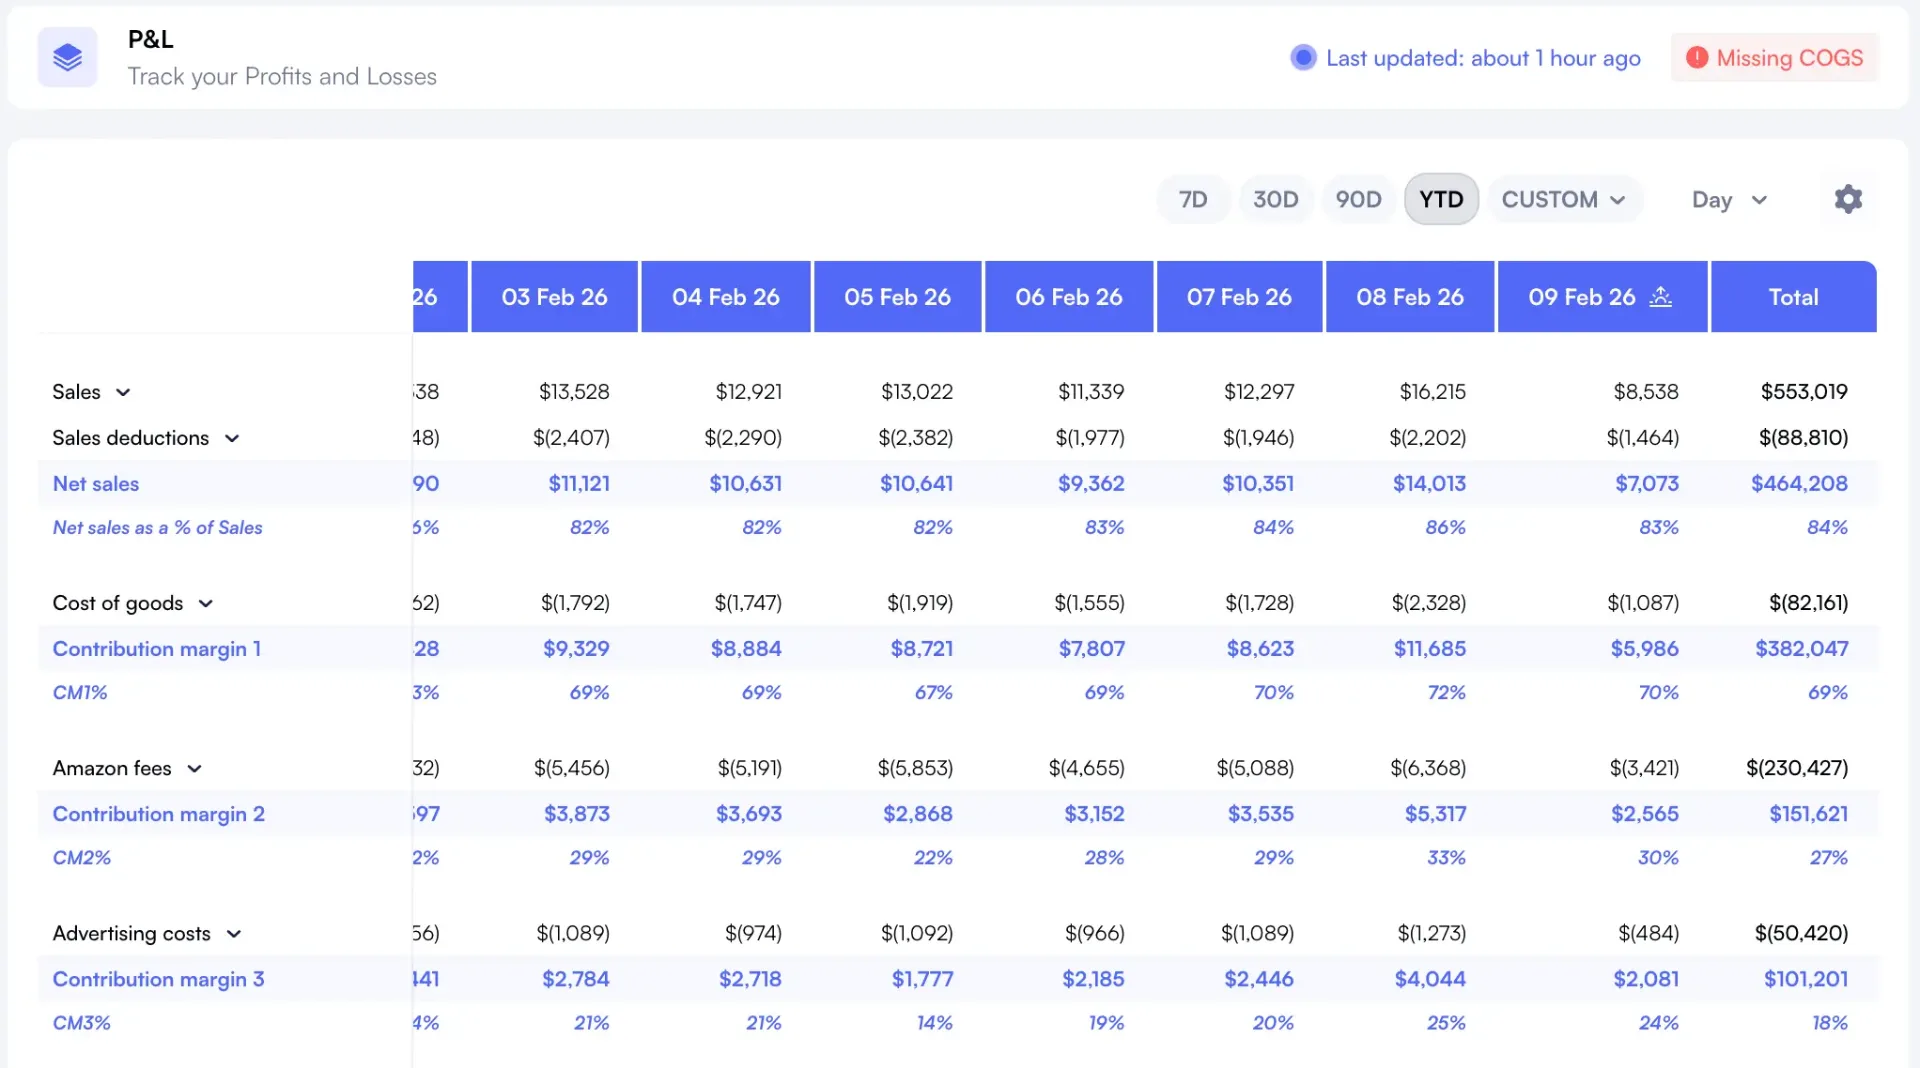
True profitability means contribution margin after every cost Amazon charges you. This includes product cost, FBA fees, storage, PPC attributed to the ASIN, returns, promotions, and refunds. Nova's P&L analytics automatically calculates this across three contribution margin levels.
CM1 (Contribution Margin 1): Revenue minus product cost and Amazon fees
CM2: CM1 minus advertising costs attributed to that specific product
CM3: CM2 minus storage, long-term storage, and other variable costs
Nova's P&L dashboard showing contribution margin breakdown per SKU
Why CM3 Matters Most
CM3 reveals true economics. A kitchen product might show 42% CM1 (looks great), but after $890 monthly in PPC and $340 in long-term storage fees, CM3 drops to -8%. You're losing money every month while revenue graphs trend up. CM3 exposes this immediately.
Research shows 67% of e-commerce brands use incomplete cost data when making SKU decisions [3]. This leads to keeping products that look profitable on paper but drain cash in reality.
Step 2: Tag Your Products by Profitability Tier
Once you have CM3 for every SKU, group them into tiers. Nova's Custom Breakdowns lets you create custom categories like "High Profit," "Break-even," and "Losers" to organize your catalog by profitability tier.
Custom Breakdowns Example
Create a "Kill Candidates" breakdown for SKUs where CM3% is below 10% and velocity is under 15 units monthly for 60 consecutive days. Tag these products manually in Nova, then review the breakdown weekly to decide which to liquidate.
High Profit: CM3% above 25%
Profitable: CM3% between 15-25%
Break-even: CM3% between 5-15%
Losing Money: CM3% below 5%
This tagging system creates instant visibility. Instead of analyzing 150 individual SKUs, you review 4 groups. Decision-making goes from days to minutes.
Step 3: Analyze Velocity and Days of Inventory
Contribution margin tells you if a product makes money. Velocity tells you how fast it sells through inventory. Both matter. A SKU with 40% CM3 but only 8 units monthly velocity ties up $4,200 in inventory that could fund three faster-moving products.
[Demo widget coming soon]
Products Feed showing velocity and sell-through rate per SKU
Nova's Seller Cockpit shows velocity, sell-through rate, and days of inventory remaining. You can sort by any metric to surface problems. Products with 120+ days of inventory and low velocity become prime kill candidates unless margin is exceptional.
Velocity Benchmark
Strong performers maintain 30-45 day inventory supply. Weak performers sit at 90-120+ days. Faster velocity frees up 8-12% of working capital for reinvestment in winners [4]. Target products that consistently sell through inventory within 60 days.
Step 4: Apply the Decision Matrix
Now combine margin and velocity into actionable decisions. Here's the exact criteria successful brands use for each quadrant.
Decision
When to Execute
Specific Actions
KEEP
CM3% above 20%, velocity above 30 units/month
Never stock out. Increase inventory buffer. Protect from competitors.
GROW
CM3% above 20%, velocity below 30 units/month
Test higher PPC budgets. A/B test main image. Add to bundles. Improve SEO.
CM3% below 10%, velocity below 15 units/month for 60+ days
Stop replenishing. Liquidate via promotions. Remove PPC. Create closeout bundle.
These thresholds aren't arbitrary. They're based on analyzing hundreds of FBA seller portfolios where we identified what separates profitable brands from struggling ones.
Case Study: Kitchen Brand Cuts 63% of SKUs, Increases Profit 34%
Real Numbers from Portfolio Optimization
Kitchen appliance brand with 147 SKUs and $380K monthly revenue. After implementing SKU rationalization over 6 months, they cut the catalog to 54 SKUs while maintaining $375K revenue. Here's what happened.
Before Rationalization:
147 active SKUs
$380K monthly revenue
$68K monthly profit
17.9% net margin
$47K tied up in slow inventory
After Rationalization:
54 active SKUs (63% reduction)
$375K monthly revenue (stable)
$91K monthly profit (34% increase)
24.3% net margin
$47K freed up, reinvested in winners
What They Did:
Killed 68 SKUs: all had CM3 below 8% and velocity under 12 units monthly. Liquidated via flash sales and bundles.
Fixed 15 SKUs: Raised prices 10-18%, cut wasteful PPC. Moved from -2% CM3 to +16% CM3 average.
Protected 11 SKUs: Stars generating 68% of total profit. Increased inventory buffers, never risked stockouts.
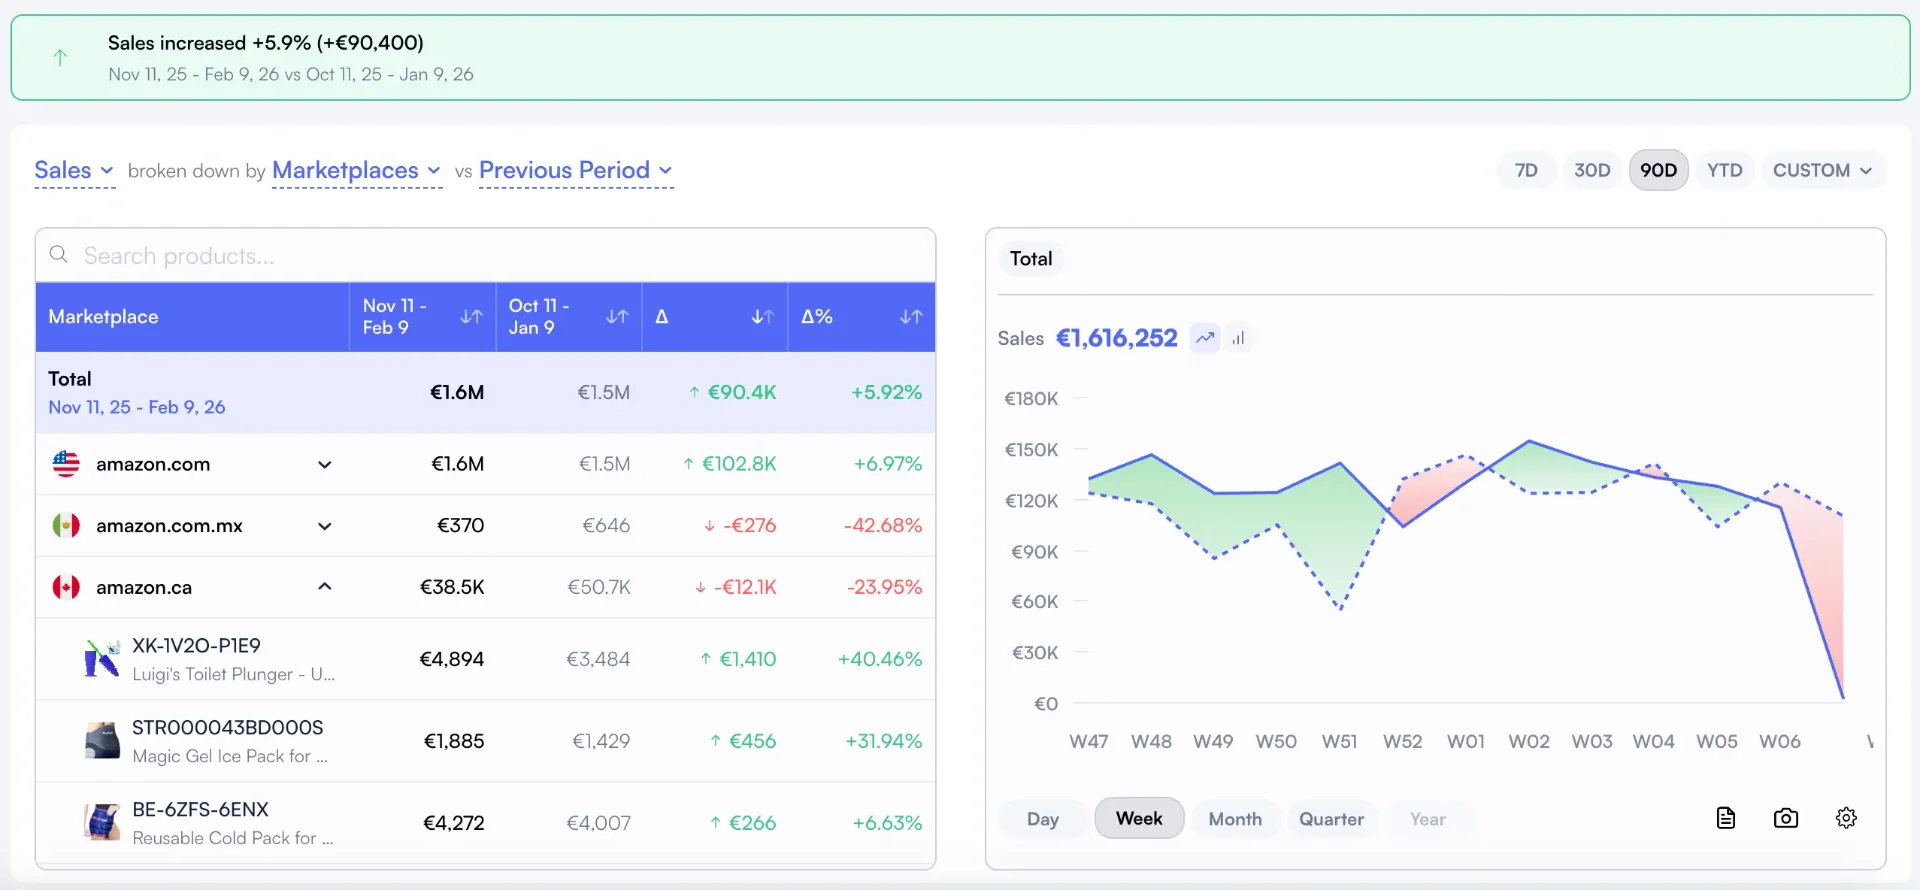
The brand used Nova's Winners & Losers dashboard to identify which SKUs were bleeding profit. Once tagged and categorized, decisions became obvious. The hard part wasn't analysis. It was committing to kill products they'd launched with high hopes.
Winners & Losers view showing which SKUs drive profit vs. Drain resources
Common SKU Rationalization Mistakes
Mistake 1: Using Revenue as Your Primary Metric
Revenue is vanity. Profit is sanity. A SKU doing $12K monthly might rank in your top 20 by revenue but lose $890 monthly after all costs. Contribution margin is the only metric that matters for keep-kill decisions.
Mistake 2: Waiting Too Long to Kill Losers
Sellers hold onto failing products for 6-12 months hoping they'll turn around. They don't. If CM3 has been negative for 90 days despite optimization attempts, kill it. Every month you wait costs you $247 in hidden expenses plus opportunity cost of better inventory.
Mistake 3: Ignoring Seasonality
Don't kill a SKU in February that crushes it every Q4. Look at 12-month rolling contribution margin and velocity. Products with strong seasonal peaks (CM3 above 30% for 3+ months yearly) can stay even if they're break-even the rest of the year.
Mistake 4: Not Accounting for Halo Effect
Some low-margin SKUs drive traffic that converts to high-margin SKUs. Before killing a product with decent velocity but thin margins, check if it generates "frequently bought together" sales. Use custom analytics to track this.
Document new product launch criteria based on learnings
This phased approach prevents the common mistake of trying to fix everything at once. You'll see measurable profit improvements in the first 30 days from stopping wasteful PPC alone.
Frequently asked questions
Monthly for established products, weekly for new launches in their first 90 days. Review your Winners & Losers rankings regularly to catch SKUs where CM3 drops below your threshold for 2+ consecutive weeks. This catches problems before they drain significant capital.
Analyze them as a bundle. If Product A loses $180 monthly but drives $640 in contribution margin from Product B via "frequently bought together," the combined CM3 is positive. Keep both. Tag them together so you evaluate as a unit, not individually.
Yes, but be honest about trade-offs. If a SKU is core to brand positioning but loses money, you have three options: fix the economics, accept the marketing cost, or reposition the brand. Don't pretend it's not a choice. Executive teams need this visibility.
Use rolling 12-month CM3 and velocity. A Halloween costume SKU might show terrible metrics in March but CM3 of 45% in October. If it's profitable 3+ months yearly and breaks even the rest, keep it. Tag as "Seasonal-Q4" so you don't accidentally kill during off-season.
Three approaches in order: 1) Run aggressive promotions (20-30% off) with PPC to move units fast. 2) Create closeout bundles with winners at slight discount. 3) Send to Amazon Outlet or liquidation services. Goal is recovering 60-80% of inventory cost within 60 days, not maximizing per-unit profit.
Tools and Resources
Effective SKU rationalization requires accurate data infrastructure. Nova's analytics platform provides the foundation with automatic CM3 calculation, Custom Breakdowns, and portfolio visualization. Here's what you need:
P&L Analytics - Automated contribution margin tracking per SKU
Custom Breakdowns - Product grouping and segmentation by profitability tiers
Products Feed - Velocity and sell-through rate analysis
Custom Analytics - Build specific views for your rationalization framework
Additional reading on portfolio strategy and SKU management can be found in research from BCG on portfolio optimization and Deloitte's framework for product rationalization.
Start Your SKU Rationalization Today
Most Amazon sellers know they're carrying too many SKUs. But without clear profitability data per product, they can't make confident decisions. The result: they keep funding losers while starving winners of inventory capital.
The Keep-Kill-Grow-Fix framework gives you a repeatable process. Calculate CM3 per SKU. Tag by profitability tier. Plot on the decision matrix. Execute based on quadrant. Review monthly. This systematic approach has helped agencies managing 50+ client brands and aggregators running 200+ SKU portfolios achieve 25-40% profit improvements within 90 days.
The hardest part isn't the analysis. It's committing to kill products you launched with high hopes. But every dollar you stop losing on bad SKUs becomes a dollar you can invest in proven winners. That's how you go from managing inventory to building a portfolio that compounds profit.