Amazon Analytics for Agencies: Complete Buyer's Guide 2026
Evaluating Amazon analytics platforms for your agency? Learn the 8 non-negotiables, pricing models decoded, and how successful agencies scale from 5 to 50+ clients without adding headcount.
You're not just managing Amazon accounts - you're managing an entire portfolio of brands, each with different goals, reporting needs, and growth trajectories. Generic seller tools weren't built for that complexity. Finding the right Amazon analytics for agencies means understanding what separates true multi-client platforms from retrofitted seller tools. The playbook below focuses on account structure, reporting, and access controls.
If you've tried scaling an agency using tools designed for individual sellers, you know the pain. Switching between accounts. Exporting data manually. Building reports from scratch every month. Explaining to clients why their numbers don't match Amazon's dashboard.
The Amazon analytics market for agencies is crowded, confusing, and full of tools that overpromise and underdeliver. This buyer's guide cuts through the noise. You'll learn what actually matters when evaluating Amazon analytics platforms, how to calculate real ROI on centralized data, and what successful agencies prioritize when choosing their tech stack.
Why Generic Seller Tools Don't Scale for Amazon Agencies
Most Amazon analytics tools were built for a single seller managing their own brand. They're designed around one account, one dashboard, one set of reports. When you're an agency managing 10, 20, or 50 clients, these limitations become impossible to work around. You need enterprise-grade analytics infrastructure that scales with your portfolio.
The Agency Breaking Point
Most agencies hit a wall around 8-12 clients when using seller tools. Here's why:
Account Switching Fatigue: Logging in and out of individual accounts wastes 2-3 hours per week per account manager
Data Silo Problem: can't compare performance across clients or identify patterns at portfolio level
Manual Report Hell: building custom reports for each client takes 4-8 hours monthly per account
Permission Chaos: Managing individual user access for team members across dozens of tools is unsustainable
Cost Explosion: per-seat pricing meant for individuals becomes prohibitively expensive at agency scale
Research from McKinsey's marketing operations study [1] found that agencies with fragmented technology stacks spend 40% of their time on administrative tasks rather than strategic work. The right platform eliminates that overhead.
Account Switching Time
2-3 hrs
Per week per account manager using seller tools
Manual Reporting Hours
4-8 hrs
Per client per month without automation
Administrative Overhead
40%
Of agency time spent on fragmented tools
8 Non-Negotiables for Agency Amazon Analytics Platforms
After analyzing what successful Amazon agencies prioritize, these eight capabilities separate tools built for agencies from those retrofitted for multi-client use. Use this framework when evaluating any Amazon analytics platform for your agency.
1. True Multi-Client Architecture
This isn't just multiple logins or account switching. True multi-client means managing all clients from a single interface with unified permissions, cross-client analytics, and portfolio-level insights.
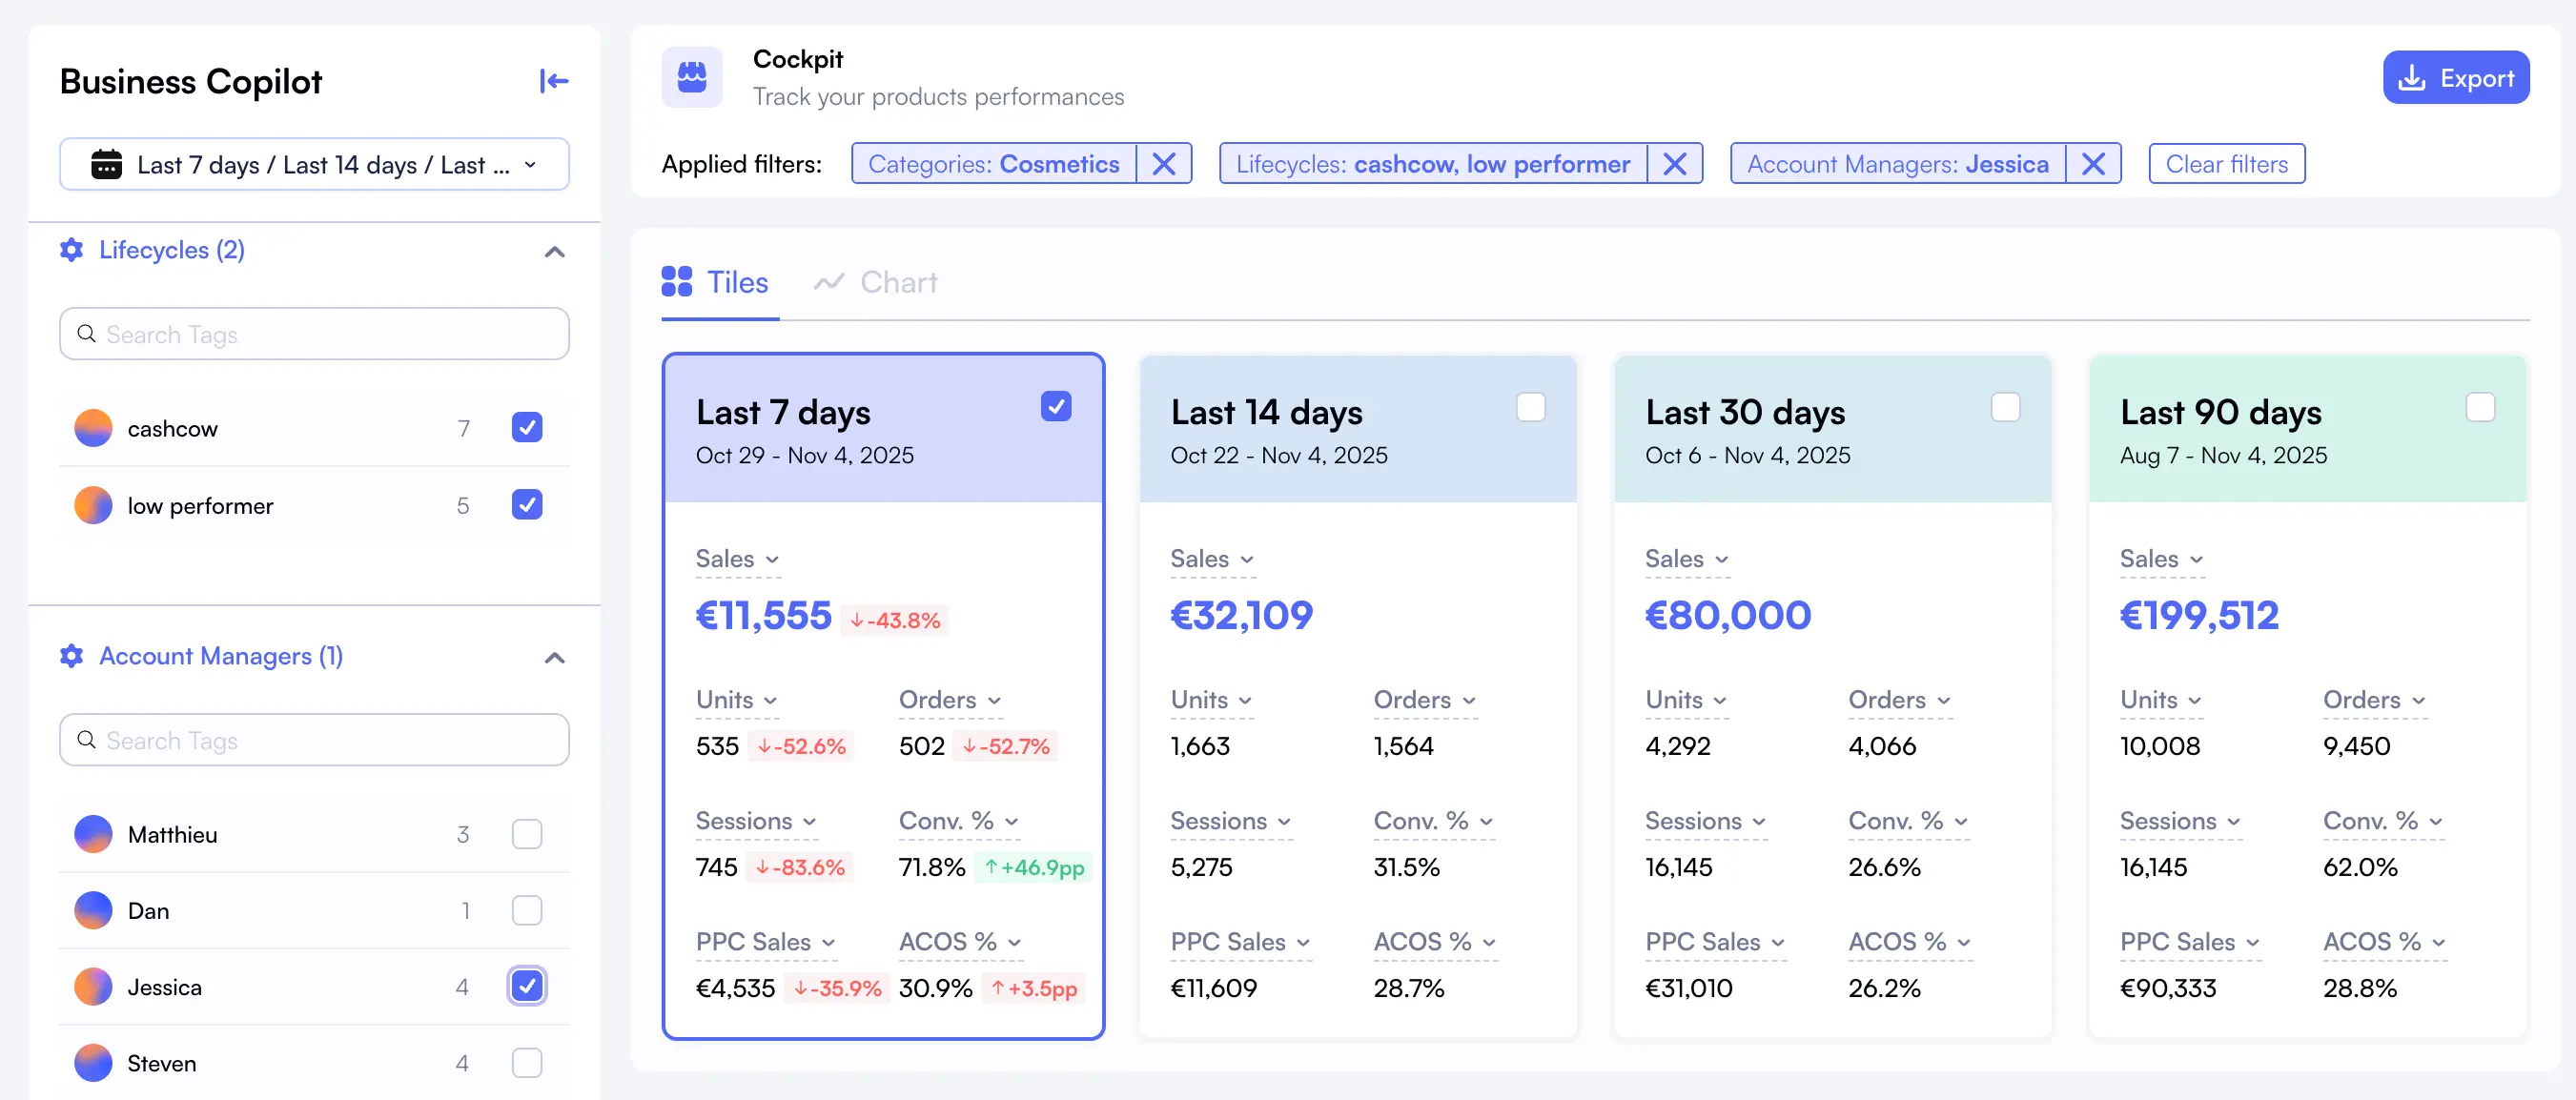
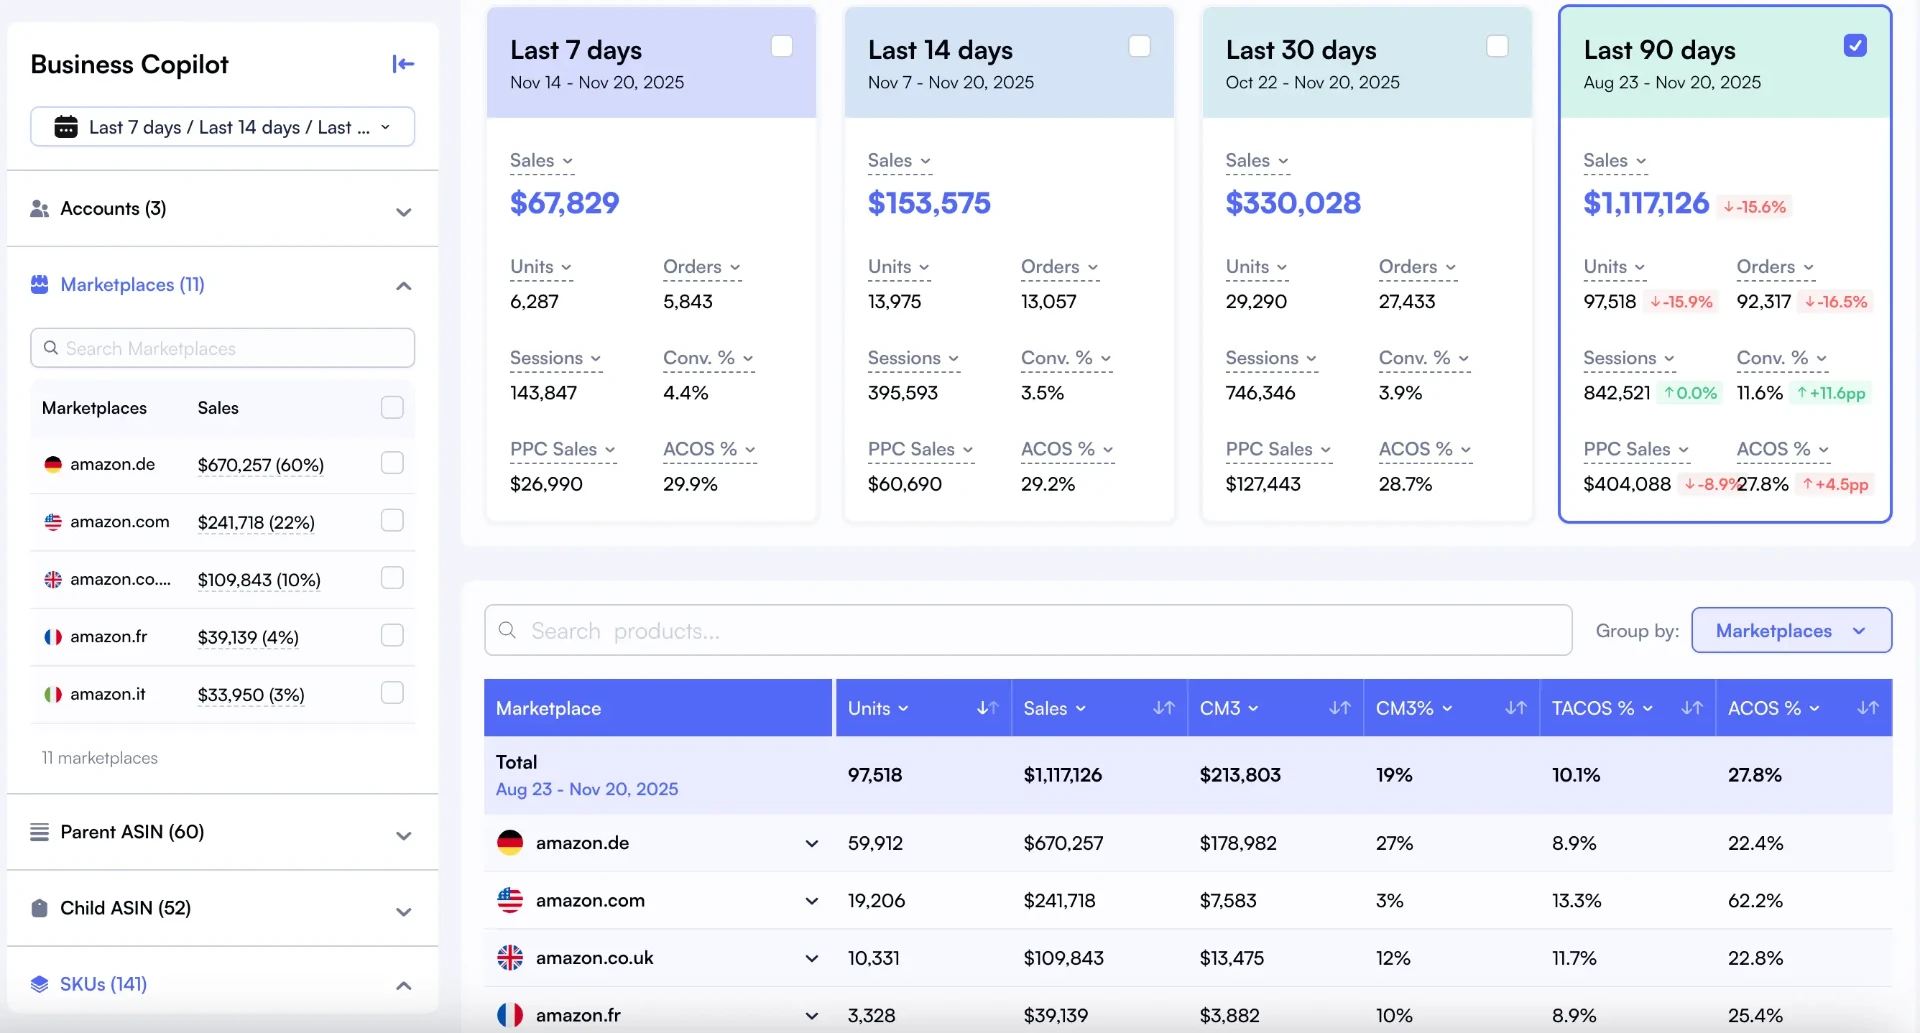
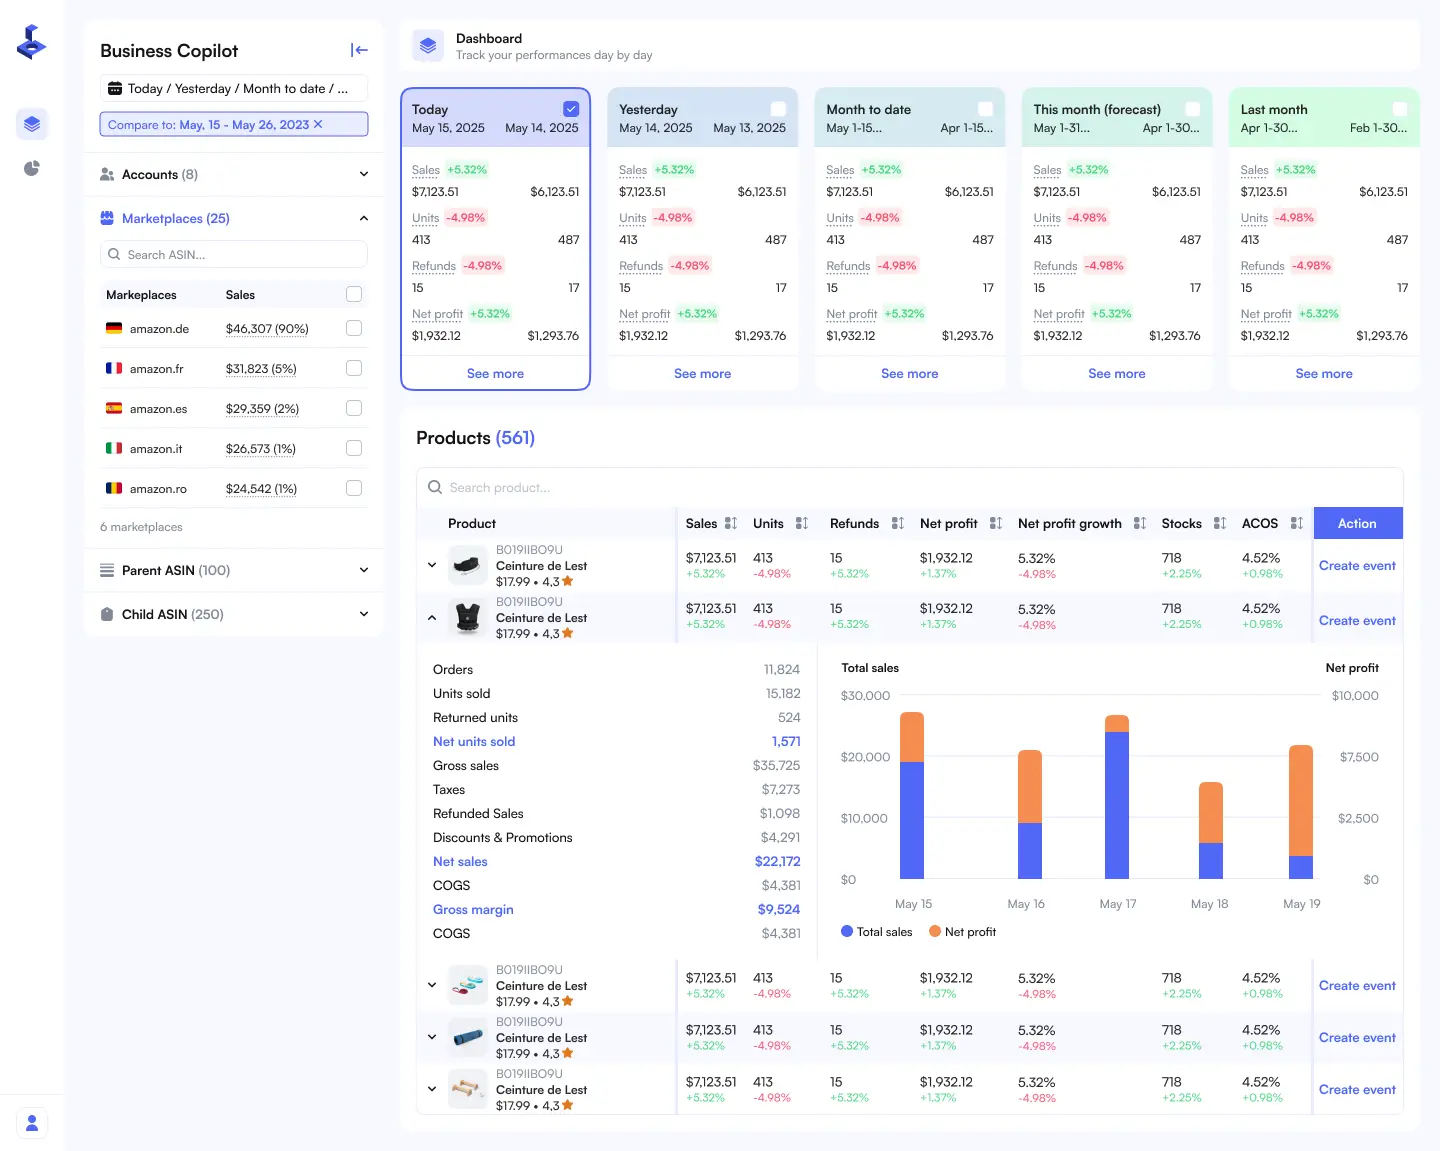
Nova's unified dashboard with custom breakdowns for client segmentation and portfolio benchmarking
What True Multi-Client Looks Like
Single Dashboard View: see all client performance metrics without switching accounts
Team Collaboration: Assign team members to work on specific client accounts
Cross-Client Benchmarking: Compare performance across similar brands to identify opportunities
Unified Data Pipeline: all client data refreshes simultaneously, not account-by-account
Portfolio Analytics: track agency-wide metrics like total revenue managed, aggregate ACoS, client health scores
Portfolio-level view managing multiple client accounts with real-time sales data
2. Unified Client Reporting
Manual reporting is where most agency time disappears. The right platform consolidates data from Amazon's fragmented sources into a single dashboard, making report generation faster and more accurate. Research shows agencies using centralized analytics reduce reporting time by 50-70% on average, freeing up strategic capacity for client growth initiatives.
Data Consolidation ROI
Calculate your potential time savings from centralized analytics:
Scenario
Manual Hours/Month
With Centralized Data
Time Saved
Annual Value*
5 clients
30 hours
12 hours
18 hours
$21,600
15 clients
90 hours
35 hours
55 hours
$66,000
30 clients
180 hours
65 hours
115 hours
$138,000
50 clients
300 hours
100 hours
200 hours
$240,000
*Based on $100/hour blended rate for account management and reporting specialists
3. Client Access and Collaboration
Decide whether clients should access the platform directly or receive prepared reports. Many successful agencies find that transparent access to shared dashboards builds stronger relationships than gatekeeping data. Look for platforms with flexible permissions that let you control what clients see while maintaining your strategic role.
4. Accurate Data You Can Trust
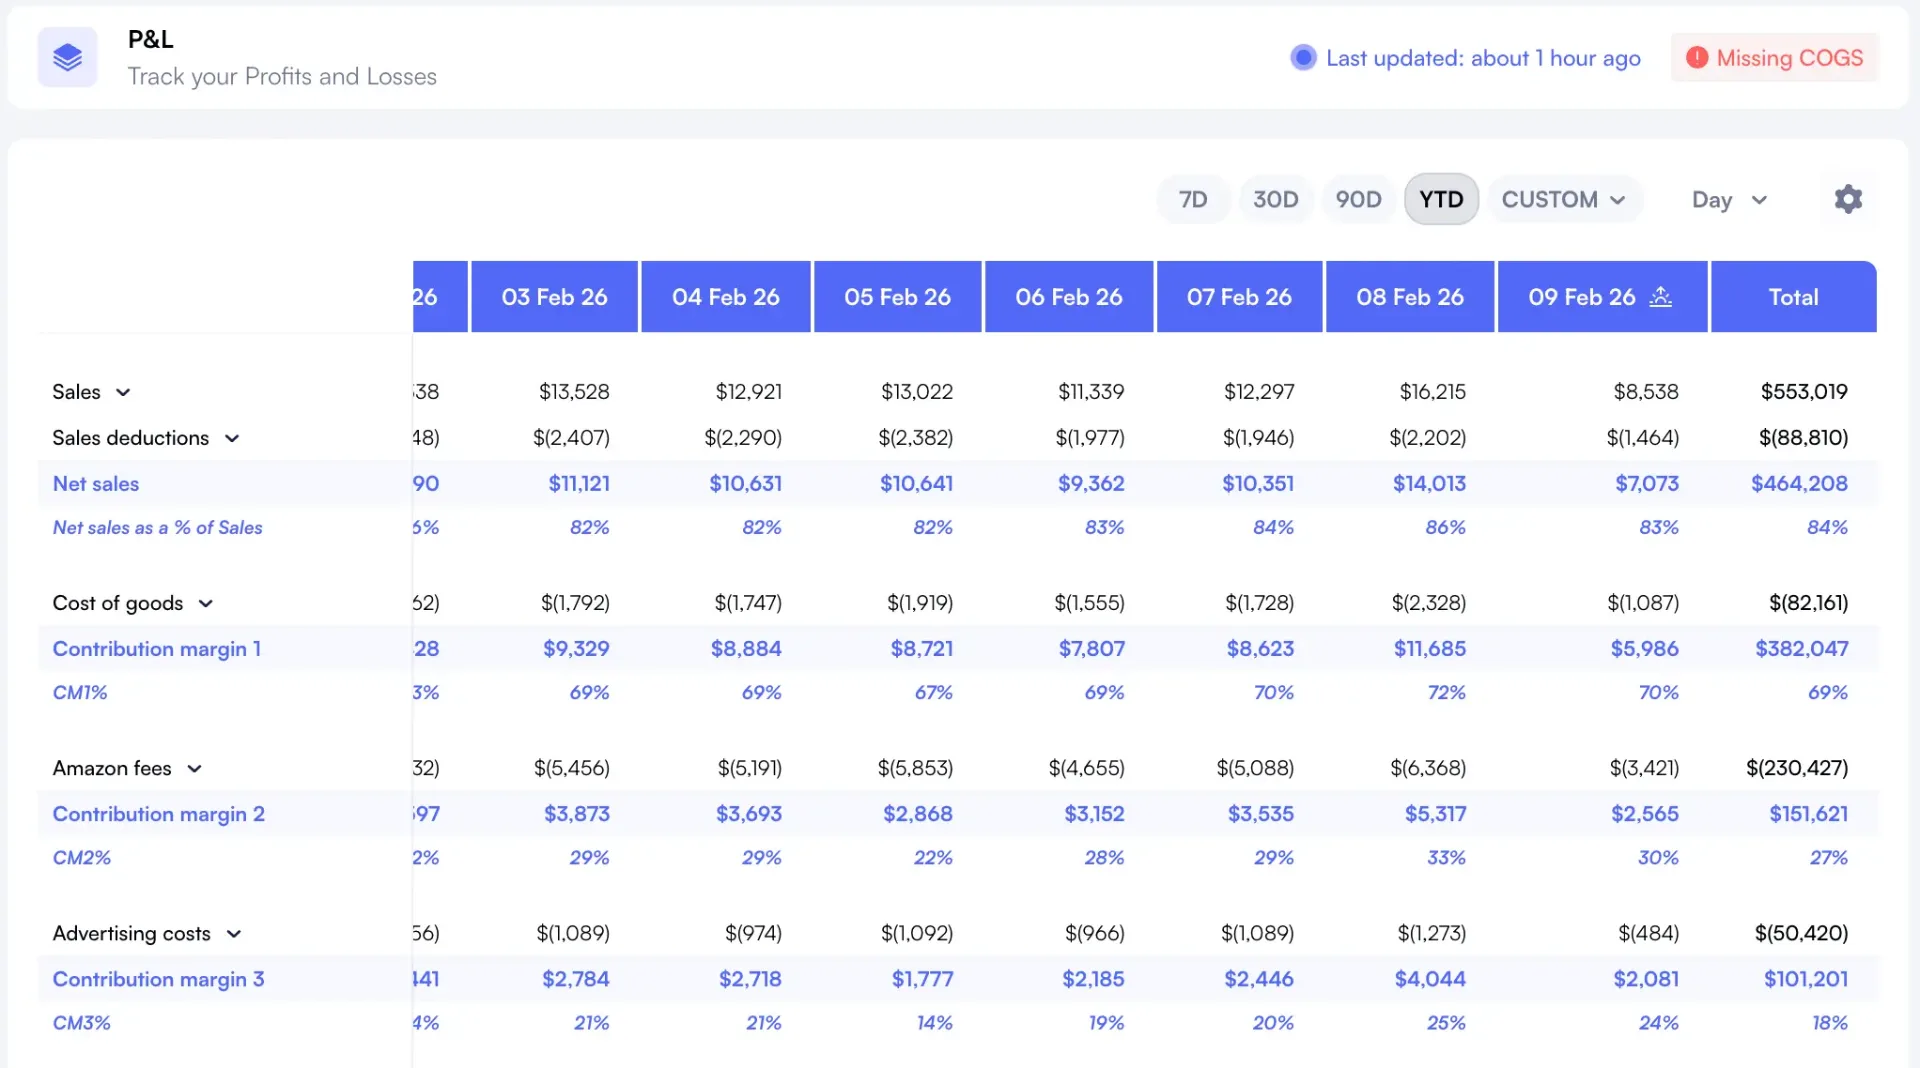
Nothing damages client relationships faster than delivering inaccurate numbers. The platform must reconcile Amazon's fragmented data sources (Seller Central, Advertising Console, Business Reports, Brand Analytics) into a single source of truth. Look for 99%+ data accuracy guarantees. Nova's automated profit and loss tracking ensures your client reports match their actual bank statements.
Detailed P&L tracking that reconciles all Amazon data sources for 99.9% accuracy
5. Advertising Cost Visibility at Scale
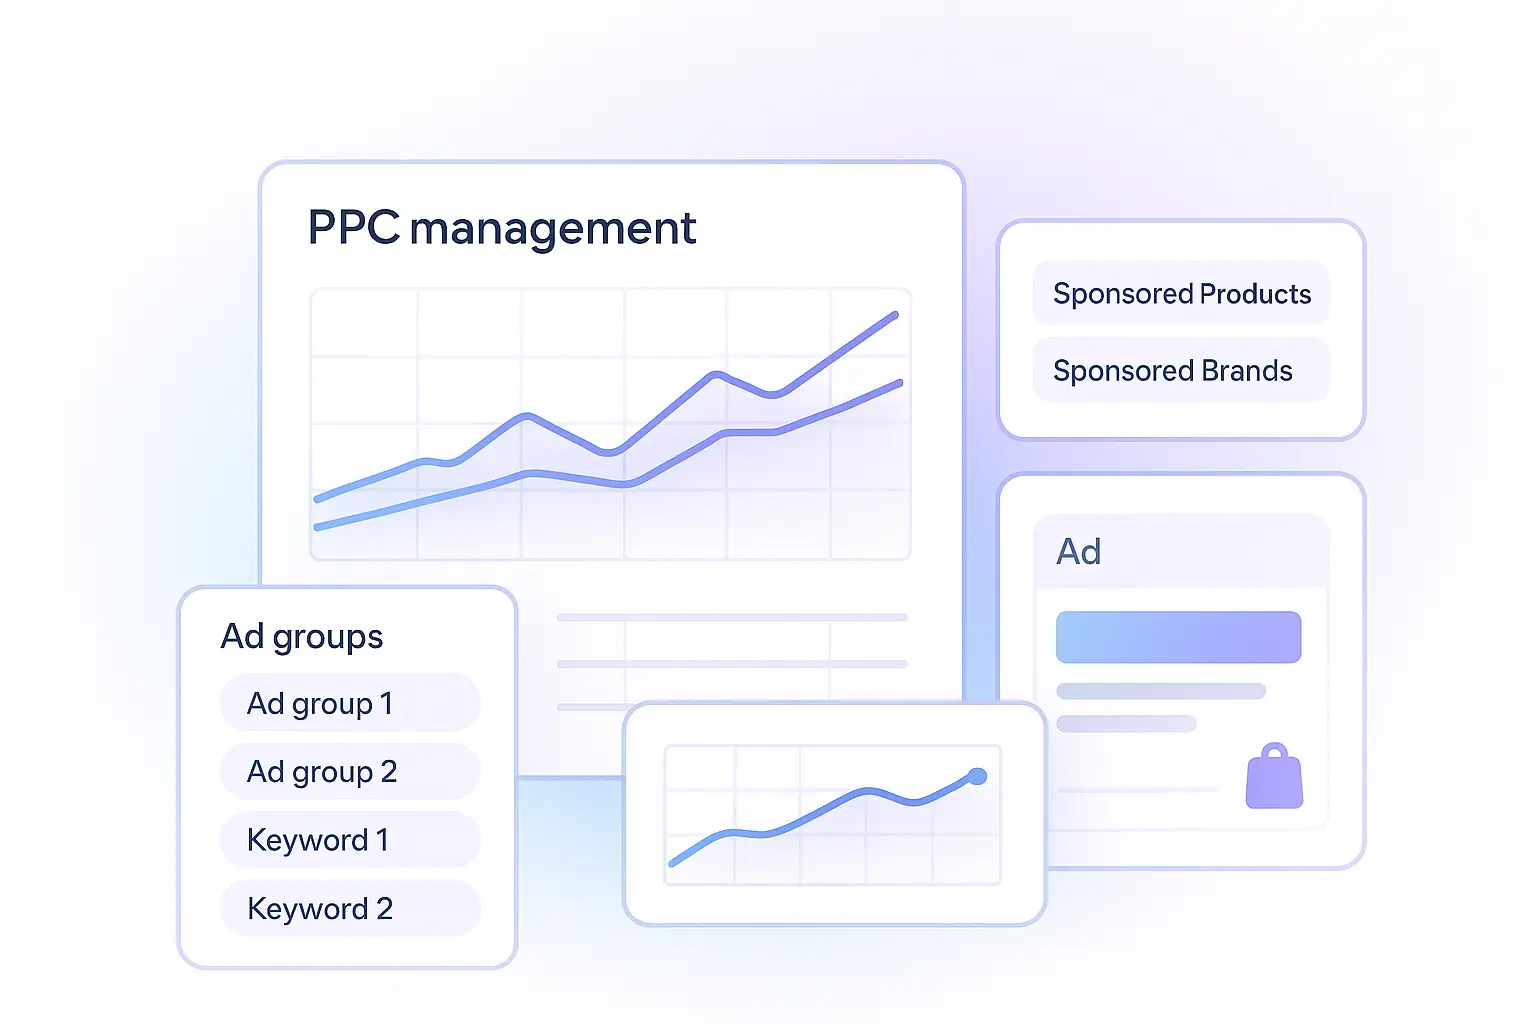
Managing advertising across multiple clients requires clear visibility into campaign performance, ad spend efficiency, and ROAS trends. The platform should provide detailed advertising cost tracking that help you understand ad spend impact on profitability across your entire portfolio and make data-driven decisions for each client.
Comprehensive advertising cost tracking showing campaign efficiency and profitability impact
6. Custom Metrics and KPIs
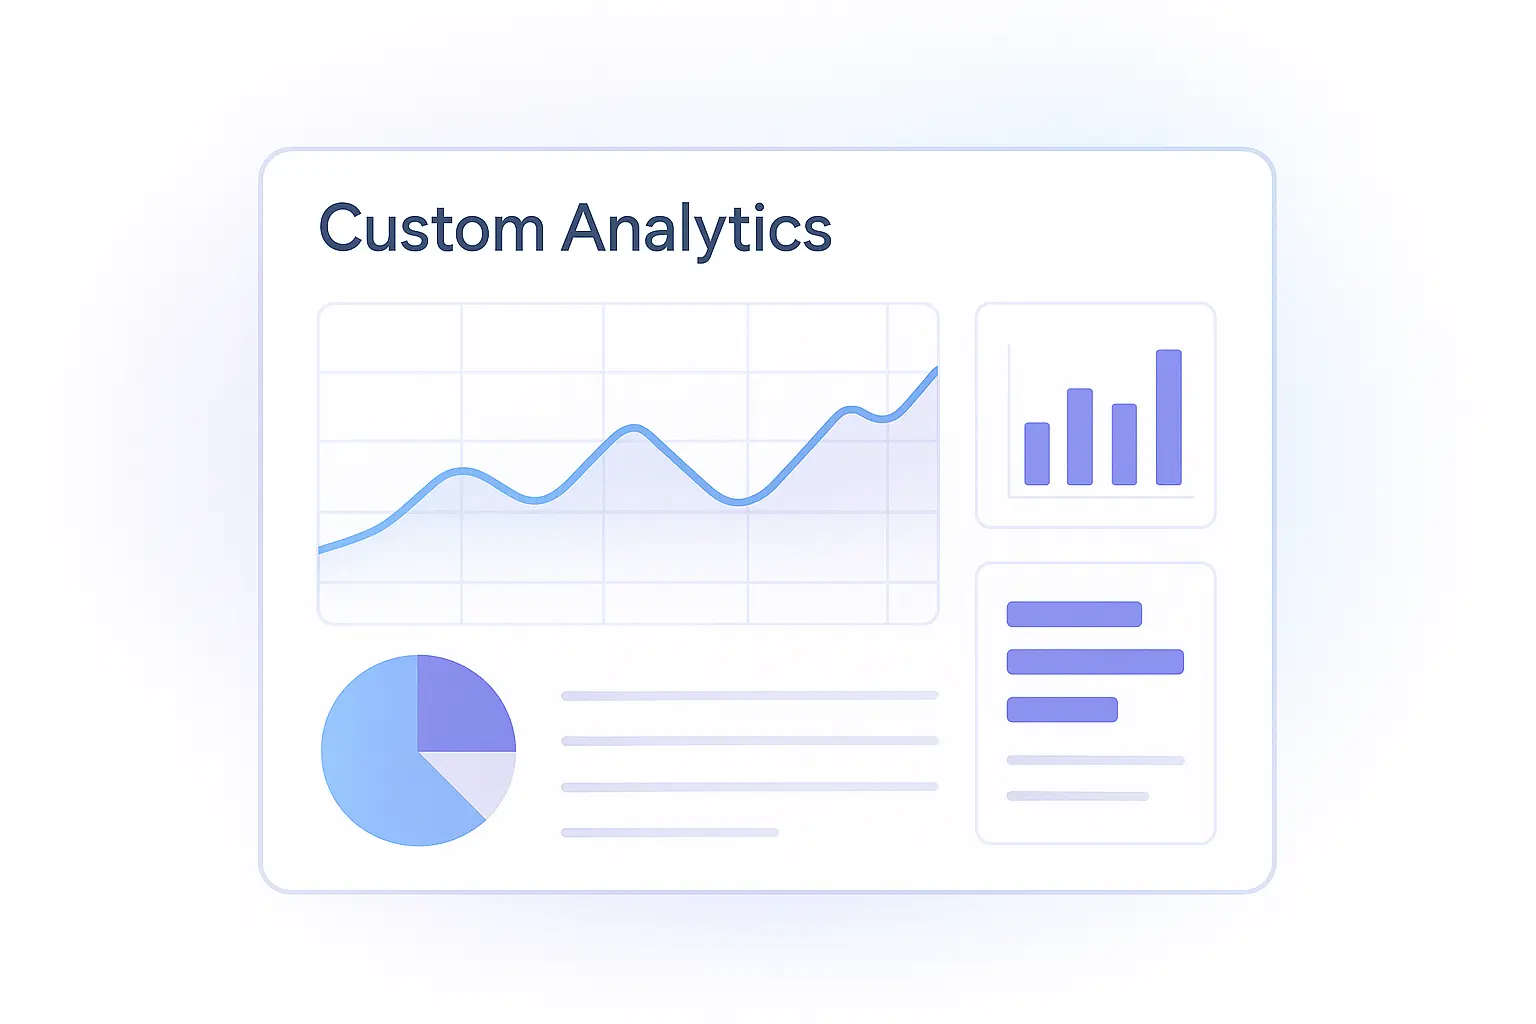
Every client has different success metrics. One brand cares about total ROAS, another obsesses over new-to-brand sales, a third prioritizes inventory turnover. Your platform must support flexible metrics, custom breakdowns, and client-specific dashboards. Custom analytics capabilities let you build exactly the metrics each client needs without manual calculations.
Build custom dashboards with client-specific metrics and KPIs
7. Team Collaboration Features
Multiple team members need simultaneous access with appropriate permissions. Look for role-based access, activity logs, internal notes, task assignment, and change tracking so your team can collaborate without stepping on each other's toes. Strong collaboration features become essential when managing multiple brand managers across different client portfolios.
8. Flexible Pricing Model
Per-seat pricing destroys agency margins as you scale. Look for pricing that scales with your business, not your headcount. According to Forrester's SaaS pricing research [2], usage-based or flat-rate models typically reduce total cost of ownership by 30-50% for agencies compared to per-seat alternatives.
Multi-Client Architecture Deep Dive
The architecture matters more than most agencies realize. Here's what separates true multi-client platforms from tools with bolt-on multi-account features.
Capability
Bolt-On Multi-Account
True Multi-Client
Account Switching
Required for each client
Single unified view
Data Refresh
Sequential (slow)
Parallel (fast)
Cross-Client Analysis
Manual export/merge
Built-in portfolio view
Team Permissions
Per-account setup
Centralized role management
Reporting
Individual generation
Batch automation
Bulk Actions
Limited or none
Cross-client capabilities
Architecture Red Flags
Watch out for these signs that a platform isn't truly built for agencies:
Account Dropdown: If you're selecting clients from a dropdown menu, you're still switching accounts
Separate Logins: Multiple login credentials for different clients means bolt-on architecture
No Portfolio View: can't see aggregate metrics across all clients in one place
Per-Client Setup: Having to configure settings, integrations, or permissions separately for each client
Data Export Required: need to export data to compare performance across clients
Platform Access and Transparency: Decision Framework
How you give clients access to their Amazon data impacts trust, collaboration, and your agency's positioning. Here's how to think through different approaches.
When Branded Access Makes Sense
Direct Platform Access Benefits
Premium Positioning: Partnering with recognized analytics platforms adds credibility and demonstrates you use best-in-class tools
Transparent Collaboration: Clients can log in anytime to see real-time sales and fresh ad data without waiting for reports
Efficient Workflows: your team and clients work in the same system, reducing back-and-forth communication
Client Empowerment: give clients direct access to their data while you provide strategic interpretation and recommendations
Trust Building: Transparency around tools and data sources strengthens long-term client relationships
Key Considerations for Platform Transparency
What Matters More Than Branding
Data Accuracy: Clients care more about reliable numbers than whose logo is on the dashboard
Your Expertise: your value comes from strategic interpretation, not controlling tool access
Collaborative Approach: working alongside clients in shared tools often builds stronger relationships than gatekeeping data
Focus on Outcomes: Clients hire you for results and insights, not for software development
Scalability: Direct platform access scales better than custom white-label solutions as you grow
Pricing Models Decoded
Agency pricing varies wildly. Understanding the models helps you calculate true cost and avoid surprises as you scale.
Pricing Model
How It Works
Best For
Watch Out For
Per Seat
$50-150 per user monthly
Small teams (2-5 people)
Costs explode as team grows
Per Client
$100-500 per client monthly
Predictable client growth
Kills margins on small clients
Flat Rate
$1,000-5,000 monthly unlimited
Agencies with 10+ clients
May have hidden usage limits
% of Ad Spend
0.5-2% of managed ad spend
High ad spend portfolios
Penalizes PPC-heavy strategies
Tiered
Plans based on client count
Growing agencies
May force unnecessary upgrades
True Cost Analysis
Don't just compare monthly fees. Calculate total cost of ownership:
Base Platform Fee: the advertised monthly cost
Implementation: Setup, data migration, team training (often $2,000-10,000)
Hidden Limits: Overage charges for API calls, data storage, report generation
Support Tiers: Premium support often required for agencies ($500-2,000/month extra)
Integration Costs: Additional fees for connecting tools like Google Sheets, Slack, CRMs
Opportunity Cost: Time your team spends managing the platform vs. Servicing clients
Worked example: what changes between 5 and 50 clients
The figures below are an illustrative model, not a specific client. They show the shape of the problem when an agency moves from per-seller tool logins to agency-level analytics, and why portfolio-scale operations break on reporting long before they break on strategy. Substitute your own client count, blended rate and reporting hours.
The Starting Point
Model the starting point as five clients reported on through a mix of Seller Central exports, separate tool logins and Google Sheets, with account managers spending a large share of their week assembling data rather than reading it. That is the same accuracy problem faced by multi-client FBA operations.
Modelled: manual process
30 hours/month: Manual reporting per client
48 hours delay: Average time to deliver client insights
3-5% error rate: Data discrepancies in reports
$1,200/month: Tool costs across multiple platforms
2 clients/manager: Maximum capacity before burnout
Modelled: centralised analytics
8 hours/month: Report creation with consolidated data
Daily updates: Fresh data available every morning
99.9% accuracy: reconciled against Amazon settlements
$2,500/month: Single platform flat rate
8 clients/manager: 4x capacity improvement
The Growth Phase
The point of the model is the ratio, not the endpoint. Once reporting is centralised, client count grows against the same core team instead of against headcount, because the marginal cost of adding a client is configuration rather than a new weekly reporting routine.
What the model implies
10x
Modelled client growth (5 to 50)
Same team
Core headcount held flat
73%
Modelled time reduction on data gathering
The Financial Impact
Do the same arithmetic on your own numbers: hours per client per month spent gathering data, multiplied by client count and your blended hourly rate, gives the capacity currently locked in reporting. That capacity is what gets redeployed into high-touch brand management, which is also where retention is won.
Platform Comparison Matrix
Here's how to evaluate platforms across the dimensions that matter most for agencies. This framework helps you compare options objectively.
Evaluation Category
Must-Have Features
Nice-to-Have Features
Deal Breakers
Multi-Client
Unified dashboard, role-based access
Portfolio analytics, benchmarking
Requires account switching
Data Accuracy
99%+ accuracy, Amazon API integration
Real-time refresh, audit trails
Known data discrepancies
Reporting
Centralized data, custom metrics
Exportable reports, multiple formats
Fragmented data sources
PPC Analytics
Detailed performance tracking, ROAS analysis
Historical trends, keyword insights
Basic metrics only
Pricing
Transparent, scales with business
Flexible payment terms
Per-seat that scales poorly
Support
Dedicated account manager
24/7 technical support
Email-only, slow response
Evaluation Process
Follow this systematic approach when evaluating platforms:
Define Requirements: Document your must-haves, nice-to-haves, and deal-breakers before demos
Test with Real Data: Insist on trials with actual client data, not demo accounts
Involve Your Team: have account managers test daily workflows, not just leadership
Check References: Talk to agencies at your scale managing similar client types
Calculate TCO: Compare 3-year total cost of ownership, not just monthly fees
Migration Plan: Understand data migration, training, and transition support included
Scalability Test: Confirm pricing and performance at 2x and 5x your current client count
Decision Framework by Agency Stage
Your needs change as you scale. Here's what to prioritize at each stage.
Startup Stage (1-5 Clients)
You're proving your model and need flexibility more than advanced features. Focus on speed and keeping costs low while establishing processes. At this stage, accurate profit and loss tracking matters more than fancy automation.
Startup Priorities
Quick Setup: you need to onboard clients fast, not spend weeks configuring tools
Low Fixed Costs: Variable pricing that scales with revenue makes sense early
Clean Data Access: Consolidated dashboards that make you look established without manual data work
Daily Refresh: Fresh data every morning without manual exports
Learning Curve: Intuitive interfaces matter when you're wearing all hats
Growth Stage (6-20 Clients)
You're adding clients monthly and need systems that prevent operational chaos. This is where agencies typically make their first major platform investment. Your focus shifts from basic reporting to comprehensive PPC performance analysis and client benchmarking.
Growth Stage Priorities
Team Collaboration: Multiple people need access with clear roles and permissions
Client Segmentation: Group clients by vertical, size, or service level for benchmarking
Efficient Data Workflows: Repeatable processes for extracting insights across all clients
Comprehensive PPC Analytics: Deep visibility into campaign performance and optimization opportunities
Flexible Pricing: per-client or flat-rate pricing prevents margin erosion
Scale Stage (20+ Clients)
You're operating at enterprise scale and need enterprise capabilities. Platform reliability, advanced features, and business intelligence capabilities become critical for managing diverse portfolios.
Scale Stage Priorities
Portfolio Analytics: Aggregate views across all clients for agency-level insights
Data Export Capabilities: Flexible data extraction for custom client presentations
API Access: build custom integrations with your CRM, billing, and project management tools
Dedicated Support: Named account manager who understands your specific setup
SLA Guarantees: Uptime commitments and priority support when issues arise
Why Nova Is Built for Amazon Agency Operations
Nova's Amazon analytics platform was designed from the ground up for agencies and aggregators managing multiple Amazon brands. Here's what makes our approach different for agency workflows.
True Multi-Client Architecture
Manage unlimited clients from a single dashboard. No account switching, no separate logins. Role-based permissions let you control exactly what each team member sees across your portfolio.
We reconcile Amazon's fragmented data sources into a single source of truth. Profit & Loss tracking that actually matches your client's bank statements.
Product-level analytics for detailed client reporting and performance management
Pricing Built for Agencies
Flat monthly rate regardless of client count or team size. No per-seat fees, no hidden usage charges, no surprises as you scale. From 5 clients to 500, your platform cost stays predictable.
Most agencies complete migration in 1-2 weeks. This includes connecting all client accounts, configuring custom dashboards with custom metrics, training your team, and validating data accuracy. We provide dedicated onboarding support and handle the heavy lifting.
Yes. You can grant clients read-only access to their own dashboards so they can check performance anytime. This transparency often strengthens relationships while you maintain control over strategic decisions and optimizations. Many agencies find this collaborative approach builds more trust than limiting access.
Adding clients takes 5 minutes. Connect their Amazon account, assign team members, select report templates, and you're live. No additional fees, no configuration complexity, no waiting for approval. Flat-rate pricing means growth doesn't increase your platform costs.
We guarantee 99.9% accuracy by reconciling multiple Amazon data sources (Seller Central, Advertising Console, Business Reports, Brand Analytics). Our validation algorithms catch discrepancies before they reach your reports. Learn more about our approach to Amazon data accuracy. If you find an error, we investigate and correct it within 24 hours.
Currently we focus exclusively on Amazon (US, UK, CA, EU, AU, JP marketplaces). This specialization allows us to provide deeper Amazon-specific insights than multi-platform tools. If you manage clients on other marketplaces, you can use Nova alongside your existing tools for those channels.
Every agency gets a dedicated account manager who understands your specific setup. Priority support via email, chat, and scheduled calls. Average response time under 2 hours for technical issues. Monthly check-ins to review performance and optimize your usage.
Making Your Amazon Analytics Decision
The Amazon analytics platform you choose will impact your agency's efficiency, margins, and ability to scale for years. Don't rush the decision, but don't wait too long either. Every month you spend on manual reporting and account switching is lost opportunity. Whether you're serving FBA sellers or enterprise brand executives, the right analytics foundation determines your competitive advantage in the Amazon agency market.
Final Checklist Before Committing
Trial Period: Test with real client data for at least 2 weeks
Team Buy-In: get feedback from account managers who'll use it daily
Data Validation: Compare platform numbers against Seller Central for accuracy
Migration Plan: Confirm timeline, support included, and data transfer process
Growth Scenario: Model costs at 2x and 5x your current client count
Contract Terms: Check lock-in period, cancellation policy, and pricing guarantees
Reference Calls: Talk to 2-3 agencies at your stage using the platform
The right platform becomes invisible. Your team stops thinking about the tool and focuses on client strategy. Data consolidation happens daily. Numbers stay accurate. Clients get insights faster. That's when you know you made the right choice.