7 Amazon Seller Mistakes That Kill Profit Margins (2026)
Half of all Amazon sellers operate on net margins below 15%. These seven common mistakes silently drain profitability every month. Here's how to diagnose and fix each one.
Half of all Amazon sellers operate on net margins below 15%. Many of them think they're doing fine because they confuse revenue growth with profitability. The reality? Seven common mistakes silently drain margins every single month.
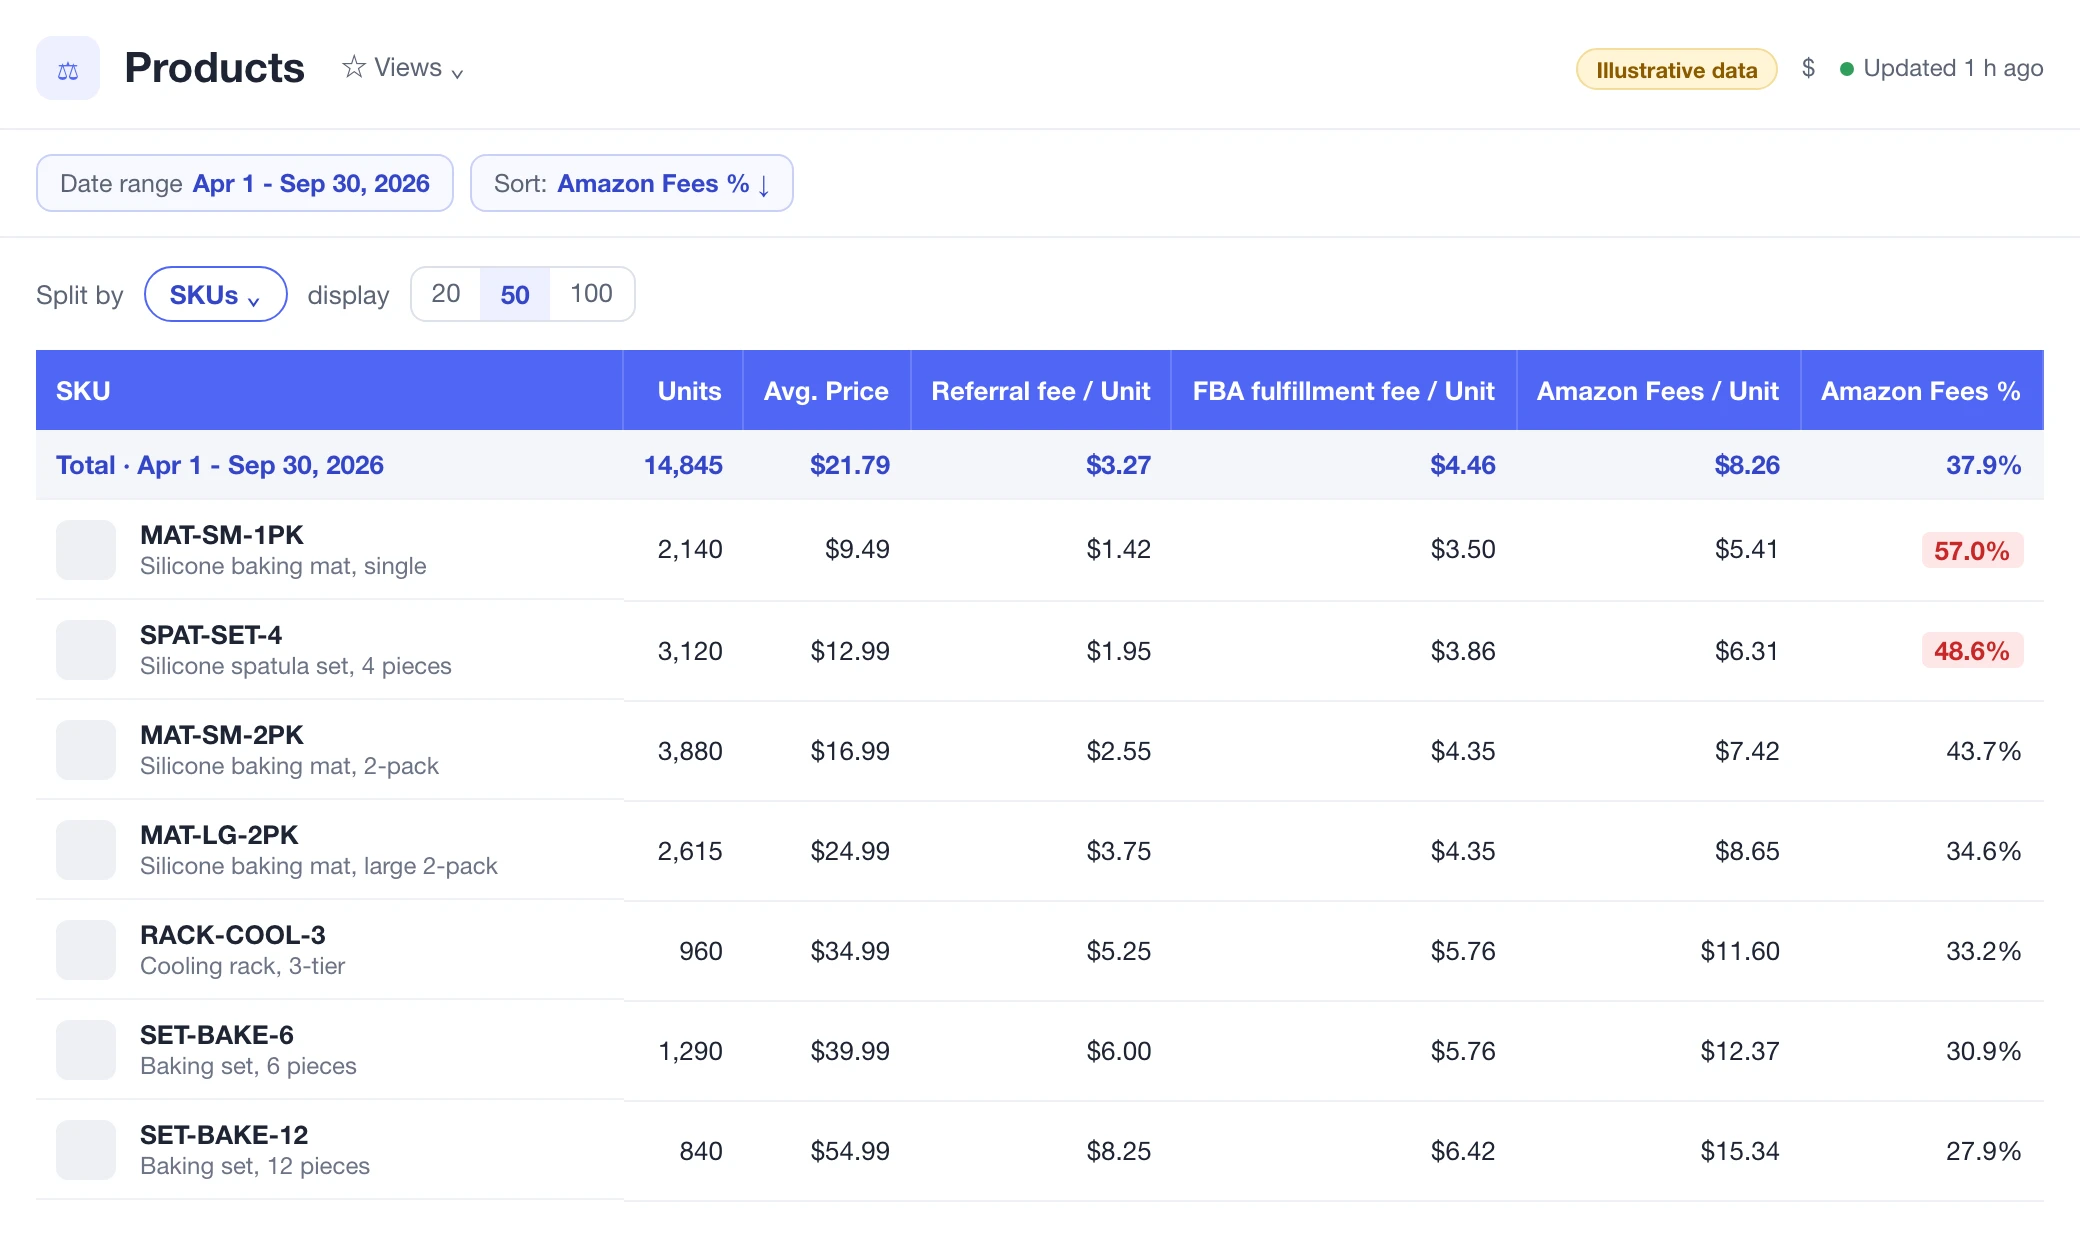
Compare fees per unit with their share of price before judging product profitability.
We've analyzed hundreds of Amazon seller accounts. The patterns are surprisingly consistent. Sellers making $50K/month and sellers making $500K/month fall into the same traps. The difference between a 10% net margin and a 25% net margin often comes down to tracking, not strategy.
This guide breaks down the seven most damaging margin mistakes, explains why each one costs you more than you think, and gives you specific fixes. No vague advice. Just the math, the mistakes, and the solutions.
TL;DR - Key Takeaways
•Most sellers calculate margins from revenue instead of contribution margin, overstating profitability by 8-15 points
•1 in 3 SKUs in a typical catalog is unprofitable when all costs are included
•The average seller ignores 8+ Amazon fee types when calculating product-level profit
•Sellers who review P&L weekly catch margin erosion 60% faster than those who check monthly
•Scaling revenue without tracking unit economics is the fastest path to negative cash flow
Sellers Under 15% Margin
50%
Jungle Scout State of the Seller 2025
Hidden Fee Types
8+
Avg. Fees sellers don't track
Unprofitable SKUs
1 in 3
When all costs are included
What Sellers Think Their Margin Is vs. Reality
Before we get into the specific mistakes, look at how perception and reality diverge. This table is based on aggregated data from seller surveys and account audits.
Line Item
What Sellers Think
What's Actually Happening
Gross Margin
40-50%
35-42% (after accurate COGS)
Amazon Fees
"Around 30%"
33-42% (referral + FBA + storage + extras)
Ad Spend as % Revenue
10-12%
14-22% (including all campaign types)
Return Cost
"Negligible"
2-5% of revenue (processing + lost inventory)
Net Margin
20-25%
8-16% (median)
The gap between perceived and actual margins typically ranges from 8 to 15 percentage points. That's not a rounding error. It's the difference between a viable business and one slowly bleeding cash. According to Jungle Scout's State of the Amazon Seller report, only 28% of sellers track net profit at the product level.
Mistake #1: Calculating Margins from Revenue, Not Contribution Margin
This is the foundational error. Everything else compounds from here. When you calculate margins using gross revenue minus COGS, you're ignoring 15-25 cost line items that eat into every sale.
Contribution margin is the only metric that tells you whether a product actually makes money after all variable costs. It includes COGS, referral fees, FBA fees, storage, advertising, returns, promotions, and every other cost tied to selling that specific unit.
The Real Math
A product selling for $29.99 with $8 COGS looks like a 73% gross margin. But after referral fees ($4.50), FBA pick & pack ($3.86), monthly storage ($0.40), advertising ($4.80), and returns ($0.90), the actual contribution margin is $7.53, or 25.1%. That's a 48-point gap from the "gross margin" number most sellers track.
The fix is straightforward: switch from gross margin to contribution margin as your primary profitability metric. Track it at the SKU level. If your analytics can't show you contribution margin per product, you're flying blind.
Mistake #2: Ignoring Per-SKU Profitability
Catalog-level averages hide the truth. When you look at your overall margin and see 18%, that number masks the reality: some products deliver 35% margins while others lose money on every sale. According to Feedvisor's marketplace research, the average seller has at least 30% of their catalog operating at breakeven or worse.
The problem gets worse as your catalog grows. Sellers with 50+ SKUs almost never know which products are their real profit drivers versus which ones just generate revenue with zero margin. Your top-line winners might be bottom-line losers.
How to Find Your Unprofitable SKUs
Export your last 90 days of data. For each SKU, calculate: Revenue minus COGS minus all Amazon fees minus ad spend minus returns. Sort by contribution margin percentage. Anything below 10% deserves immediate attention. Anything negative needs to be fixed or killed.
Nova's Products Feed shows contribution margin for every product in your catalog, updated with near real-time data. You can instantly spot which SKUs are dragging down your overall profitability.
Mistake #3: Not Tracking COGS Changes Over Time
Your Cost of Goods Sold isn't static. Supplier prices change. Shipping costs fluctuate. Raw material markets move. Exchange rates shift. Yet most sellers set their COGS once and forget about it for months.
A 5% increase in COGS that goes untracked for 6 months doesn't just cost you 5% of margin. It means every pricing decision, every ad bid, and every profitability calculation during those 6 months was wrong. You might have been promoting unprofitable products the entire time.
Statista's supply chain cost data shows that raw material and shipping costs fluctuated by 8-15% year over year between 2023 and 2025. Sellers who don't update COGS quarterly are almost certainly overstating their margins.
Build a quarterly COGS review into your operations. Pull actual invoices. Compare against what's in your system. Update immediately. Better yet, use a platform that lets you track COGS changes over time with version history so you can see exactly when costs shifted and how it affected margins.
Mistake #4: Treating All Ad Spend as Equal
Not all advertising dollars deliver the same return. A dollar spent on a branded keyword defending your listing is fundamentally different from a dollar spent on a broad category keyword prospecting new customers. But most sellers lump all ad spend into one bucket and calculate a single ACoS number.
This masks critical information. Your branded campaigns might run at 5% ACoS while your prospecting campaigns run at 45% ACoS. The blended number of 20% ACoS looks acceptable, but the prospecting spend might be destroying margins on specific products.
Understanding the split between organic and PPC-driven sales is essential. If 60% of a product's sales come from advertising, that product's true margin is much lower than one where only 20% of sales are ad-driven. Your true ROAS needs to account for this split.
The TACoS Reality Check
Total Advertising Cost of Sales (TACoS) gives you the full picture by measuring ad spend as a percentage of total revenue, not just ad-attributed revenue. A healthy TACoS for most categories sits between 8-15%. Above 20%, advertising is eating too much of your margin. Track this alongside contribution margin per product to see the real impact.
Mistake #5: Missing Hidden Amazon Fees
Amazon charges more than referral fees and FBA fulfillment fees. Most sellers track those two. But there are 40+ distinct fee types that can apply to your account, and the average seller actively tracks fewer than half of them.
Here's what typically gets missed:
Long-term storage fees: Inventory sitting 181-365 days gets surcharged. Over 365 days? The fee jumps dramatically.
Removal and disposal fees: Getting rid of dead inventory isn't free.
Return processing fees: you pay Amazon to process returns in most categories.
Inbound placement fees: Since 2024, Amazon charges for distributing inventory across fulfillment centers.
Low inventory level fees: Maintaining less than 28 days of supply triggers additional per-unit fees.
FBA prep service fees: If Amazon preps your products, that cost adds up.
Coupon redemption fees: each coupon clip costs $0.60 on top of the discount.
Subscribe & Save discounts: the 5-15% discount comes from your margin.
According to Amazon's official fee schedule, referral fees alone range from 8% to 45% depending on category. When you stack FBA fees, storage, and the extras listed above, total Amazon fees can reach 40-50% of your selling price.
Mistake #6: No Regular P&L Review Cadence
How often do you actually look at your profit and loss statement? If the answer is "monthly" or "quarterly," you're catching problems too late. Amazon's marketplace moves fast. Fee changes, competitor price drops, ad cost spikes, and seasonal demand shifts can erode margins within days.
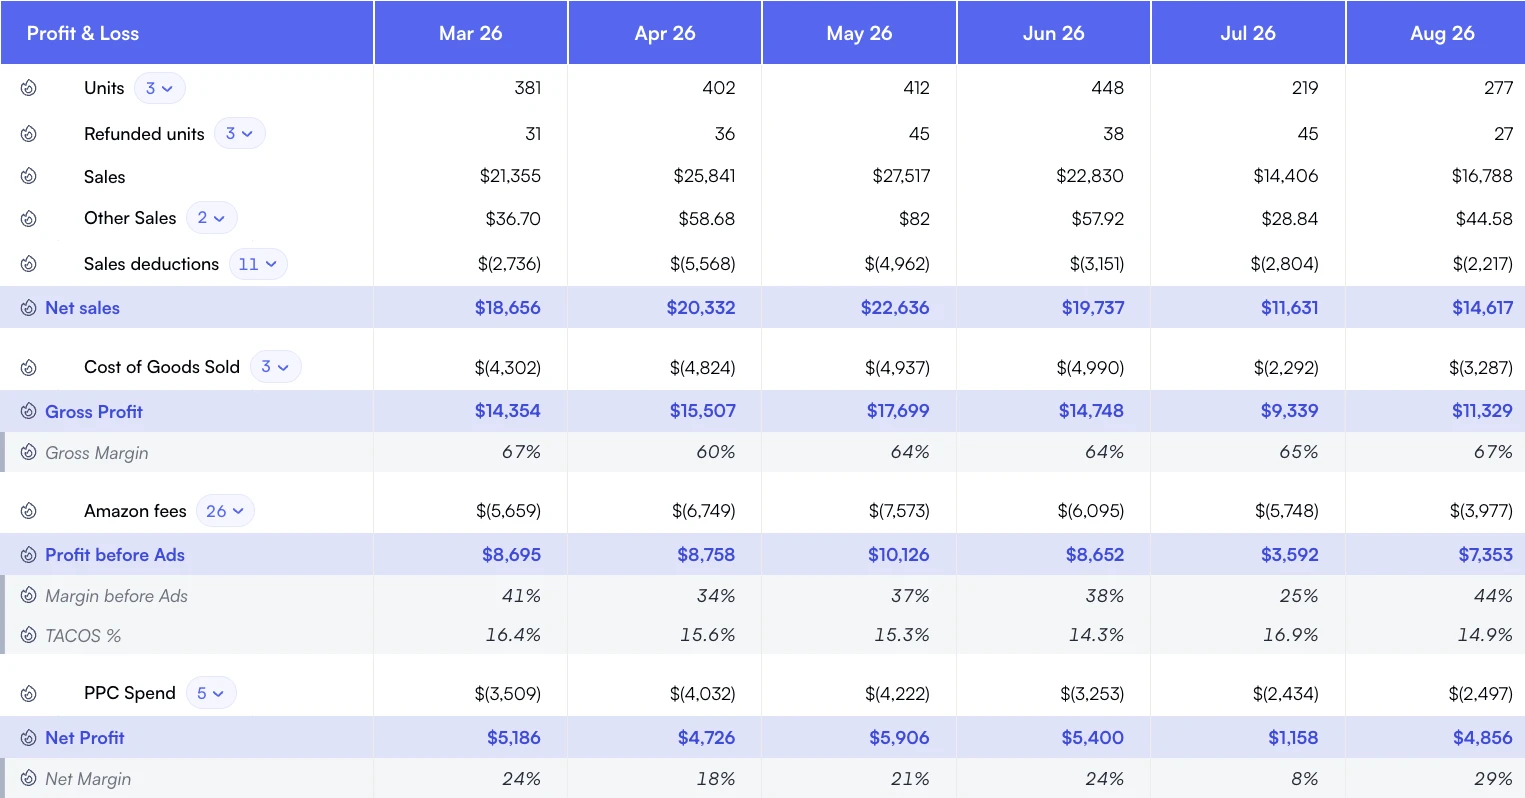
Read sales alongside every cost layer to see how much profit remains.
Your weekly business review should include checking contribution margin trends for top 20 SKUs, flagging any products where margin dropped more than 3 points, reviewing ad spend efficiency, and comparing actual vs. Target P&L. A monthly deep dive should complement this with a full P&L statement review.
How Nova Helps
Nova's P&L dashboard gives you a real-time view of profitability across your entire catalog. You can drill into any product, any time period, and see exactly where margins are moving. Combined with day-to-day performance tracking, you'll catch margin shifts the day they happen instead of discovering them weeks later.
Mistake #7: Scaling Revenue Without Tracking Unit Economics
This is the most dangerous mistake because it feels like success. Revenue is growing. Orders are increasing. The business looks healthy on the surface. But if you haven't nailed your variable costs per unit, scaling just amplifies your losses.
Here's what happens: you launch a product with an estimated 20% margin. You spend heavily on PPC to rank. Sales climb. You order more inventory. But your actual margin, after all costs, is 6%. Every additional unit sold at scale makes the problem worse, not better.
Marketplace Pulse data shows that the fastest-growing Amazon sellers are not always the most profitable. Revenue growth without margin discipline is how businesses go from "scaling" to "failing" in a single quarter.
Warning: The Scale Trap
If your contribution margin per unit is below 15%, think twice before scaling that product with aggressive advertising. You'll need extremely high volume to cover fixed costs, and any increase in COGS or ad costs will push you into negative territory. Fix unit economics first, then scale.
The Margin Reality Check: A Diagnostic Framework
Use this framework to diagnose your margin health. Score yourself on each item. If you score below 4 out of 7, your margins are almost certainly lower than you think.
Check
What to Verify
Pass/Fail Criteria
Contribution Margin Tracking
Do you track contribution margin (not gross margin) per SKU?
Pass: All SKUs tracked. Fail: Using gross margin or catalog averages.
COGS Accuracy
When was COGS last updated against actual invoices?
Pass: Within 90 days. Fail: 6+ months or never.
Fee Completeness
Do you track all Amazon fee types including storage, returns, and placement?
Pass: 90%+ fee types tracked. Fail: Only referral + FBA.
Ad Spend Segmentation
Can you see ad cost impact per product, not just campaign-level?
Can you identify your bottom 20% of products by profitability?
Pass: Yes, with data. Fail: Guessing or catalog average.
Review Cadence
How often do you review P&L and margin trends?
Pass: Weekly minimum. Fail: Monthly or less.
Unit Economics Before Scaling
Do you validate unit economics before increasing ad spend or inventory?
Pass: Always. Fail: Scale first, check later.
If you scored 5 or above, your margin tracking is solid. Focus on optimization. If you scored 3-4, you're likely leaving 5-10% margin on the table. Below 3? Your stated margins are almost certainly inaccurate by 10+ percentage points.
Start With the Biggest Impact
Don't try to fix everything at once. Start with Mistake #1 (contribution margin tracking) and Mistake #2 (per-SKU profitability). These two changes alone typically reveal 5-8 percentage points of margin that sellers didn't know they were missing. Use Nova's Custom Breakdowns to segment your catalog by profitability tiers and prioritize which products need attention first.
Frequently Asked Questions
Every day you operate without accurate margin data is a day you might be scaling losses. The seven mistakes in this guide aren't rare edge cases. They're the norm for most sellers. Fix them systematically, starting with contribution margin tracking and per-SKU visibility, and you'll likely find 5-15% of hidden margin waiting to be recovered.
Start with the FBA profit margins fundamentals, then use the diagnostic framework above to identify your biggest gaps. For automated margin diagnostics, explore Nova Analytics' profit analytics to see exactly where margins leak per SKU. Your margins are probably better than you fear, but worse than you think.
Ready to Transform Your Amazon Business?
Join thousands of successful sellers who use Nova Analytics to make data-driven decisions and maximize their profits.