
Amazon Return Rate Analytics
Returns cost Amazon sellers 3-5% of gross revenue. But the headline return rate doesn't tell the full story. Product-level analysis reveals that 80% of return costs come from 20% of your catalog. Learn how to identify problem SKUs, leverage Amazon's new Returns Dashboard, and implement returnless refund strategies.
Latest updates
Refreshed for 2026
- 2026 return-rate benchmarks have moved across major Amazon categories, with product-level loss patterns visible in recent seller cohorts.
- Returns, refunds and reimbursements sit inside Nova's Seller Cockpit alongside 200+ Amazon metrics and 40+ fee types on an hourly refresh, from $29/mo or Custom.
- Related reading: Amazon P&L, FBA inventory and Amazon profit analytics.
Returns cost Amazon sellers 3-5% of gross revenue on average. For a $500K seller, that's $15,000-$25,000 annually walking out the door. But here's what most sellers miss: the headline return rate doesn't tell the full story. Product-level analysis reveals that 80% of return costs typically come from 20% of your catalog. This guide shows you how to find those problematic SKUs and fix them.
We've analyzed return data across hundreds of Amazon accounts. The pattern is consistent: sellers who track returns at the product level recover 15-40% of their return-related losses within 90 days. Those who only monitor account-level metrics continue losing money without knowing why.
The difference isn't luck. It's analytics depth. Let's break down exactly how to build return rate intelligence that protects your margins.
The True Cost of Returns (It's Not Just the Refund)
Most sellers calculate return cost as simply the refunded amount. That's a dangerous oversimplification. According to Supply Chain Dive research1, returns cost retailers 59% of the original sale price when you factor in all associated expenses.
For Amazon FBA sellers, the true cost includes:
- Original sale price refunded to customer
- Outbound shipping you already paid (non-recoverable)
- Return shipping fee Charged by Amazon ($2.12-$4.97 for standard items)
- Return processing fee on certain categories
- Restocking/grading time If item returns to sellable inventory
- Disposal fees If item is unsellable ($0.32-$2.25 per unit)
- Lost opportunity cost from inventory tied up in transit
A $30 product with a return doesn't cost you $30. It costs $38-$45 when you add processing, shipping, and potential disposal. For high-volume sellers, this adds up to thousands monthly.
Average Return Rate
8-12%
Apparel categories (highest)
True Return Cost
130-150%
Of refund amount (all-in)
Recovery Potential
15-40%
With product-level tracking
Return Rate Benchmarks by Category
Before panicking about your return rate, understand what's normal for your category. National Retail Federation data2 shows significant variation across product types.
| Category | Average Return Rate | Acceptable Range | Red Flag Threshold |
|---|---|---|---|
| Apparel & Accessories | 8-12% | 6-15% | >18% |
| Electronics | 5-8% | 3-10% | >12% |
| Home & Kitchen | 4-7% | 3-9% | >11% |
| Health & Personal Care | 2-5% | 1-6% | >8% |
| Toys & Games | 4-6% | 3-8% | >10% |
| Sports & Outdoors | 5-8% | 4-10% | >12% |
Your P&L dashboard should break down returns by category so you can compare against these benchmarks. Account-level return rates mask category-specific problems.
The Product-Level Return Analysis Framework
Category benchmarks give context. Product-level analysis drives action. Here's the framework top sellers use to identify and fix return problems.
Step 1: Calculate SKU-Level Return Rates
For each product, calculate: Return Rate = (Units Returned ÷ Units Sold) × 100
Simple, but most sellers don't do this consistently. They look at it once when a problem is obvious, then forget about it. The Winners & Losers analysis Automates this calculation across your entire catalog.
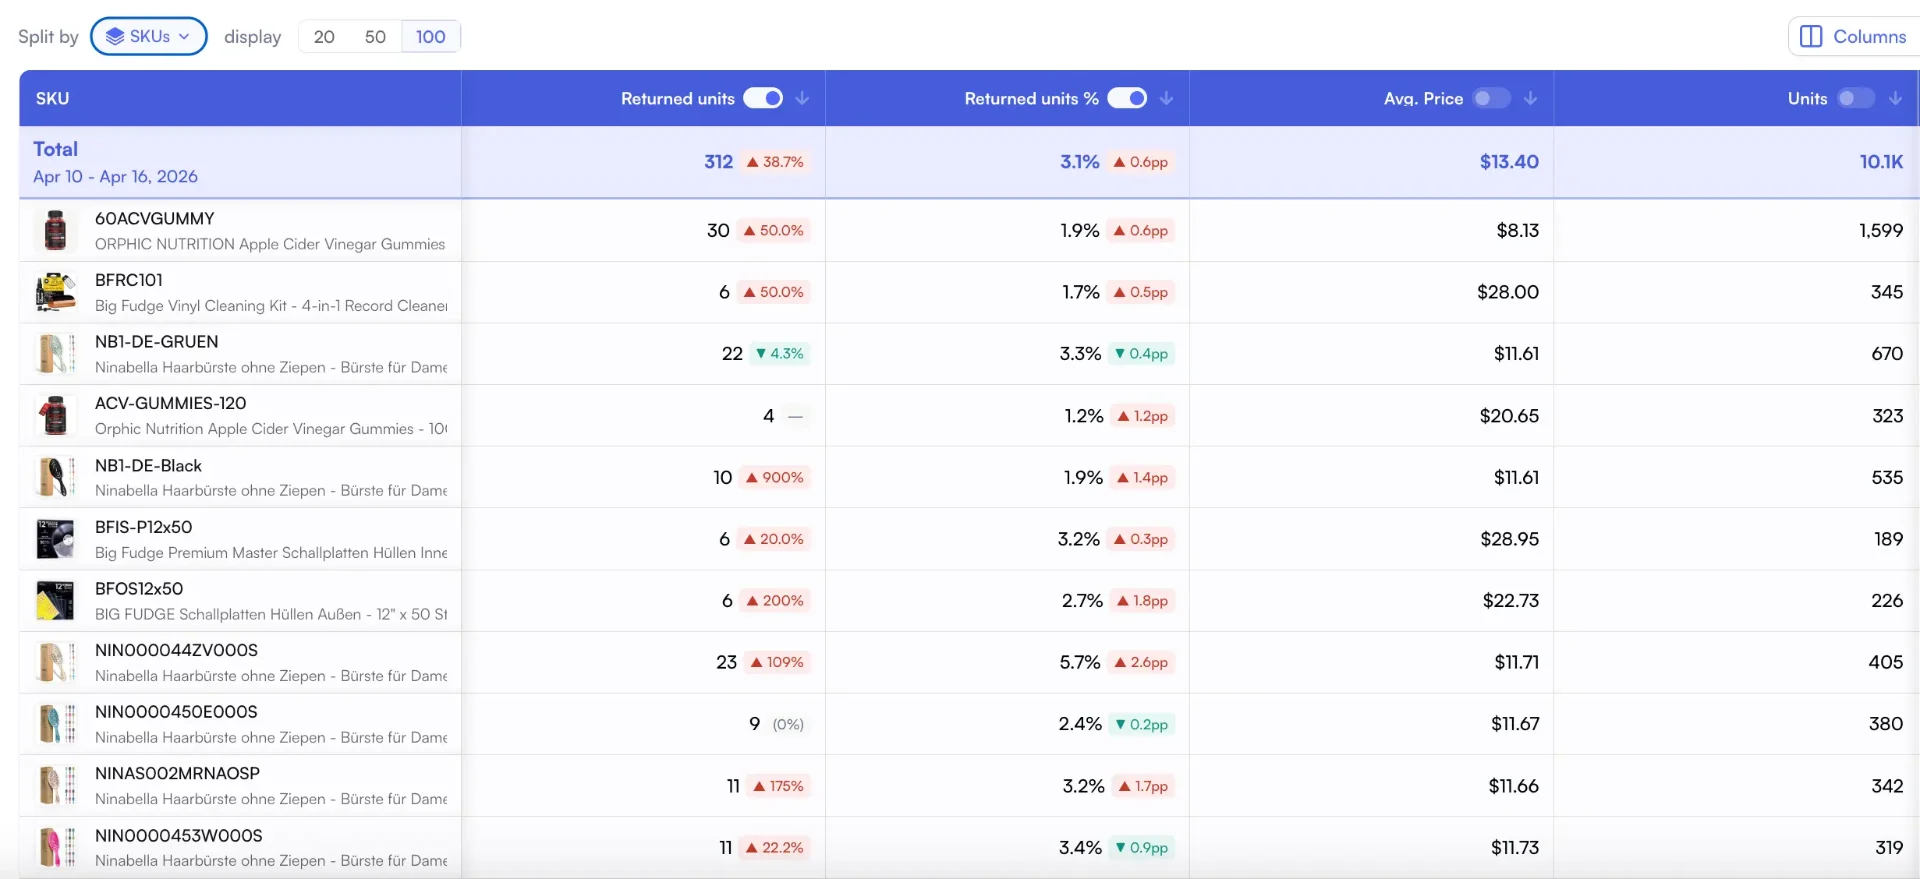
Sort the full catalog by return rate to surface the SKUs eating margin
Period-over-period returns: catch a spike against last week or the same week last year
Flag any SKU with a return rate more than 50% above your category average. A 9% return rate in apparel is normal. A 9% return rate in health & personal care is a problem.
Step 2: Segment by Return Reason
Amazon provides return reason codes. Group them into actionable categories:
- Product quality issues: Defective, damaged, not as described. These indicate sourcing or manufacturing problems.
- Expectation mismatch: Wrong size, wrong color, different from listing. These indicate listing optimization opportunities.
- Buyer remorse: No longer needed, found better price, ordered by mistake. Less actionable but worth monitoring.
- Fulfillment errors: Wrong item sent, missing parts. These indicate operational issues.
According to McKinsey research on retail returns3, expectation mismatch accounts for 40-50% of fashion returns. For non-apparel categories, quality issues dominate at 35-45%.
Step 3: Calculate Return Impact on Profitability
Not all returns hurt equally. A $100 product with a 5% return rate costs more than a $20 product with a 10% return rate in absolute terms. Your Products Feed should weight return impact by:
- Revenue impact: Return rate × Average selling price × Units sold
- Margin impact: Returns on high-margin items hurt more
- Processing cost: Oversized items cost more to return and restock
This prioritization ensures you fix the $50,000 problem before the $500 problem.
7 Return Reduction Strategies That Actually Work
Generic advice like "improve product quality" doesn't help. Here are specific, tested strategies with expected impact.
1. Size Chart Optimization (Apparel: 20-30% reduction)
Size-related returns are the #1 driver in apparel categories. Baymard Institute research4 shows that 42% of shoppers abandon carts due to size uncertainty.
Fix it by adding:
- Detailed measurement tables (not just S/M/L)
- Fit guidance: "runs small, order up"
- Model measurements with size worn
- Customer reviews mentioning fit
Track the impact in your Custom Analytics by comparing return rates before and after size chart updates.
2. Enhanced Product Photography (15-25% reduction)
"Not as described" returns often come from poor visual representation. According to BigCommerce research5, 78% of online shoppers want photos that bring products to life.
High-return products need:
- Scale reference images (product next to common objects)
- All angles, including bottom and interior
- Lifestyle images showing actual use
- Close-ups of texture, material, and finish
Pro Tip: A+ Content Reduces Returns
Products with A+ Content see 3-5% lower return rates on average. The comparison charts and enhanced images set clearer expectations.
3. Bullet Point Clarification (10-20% reduction)
Analyze your "not as described" returns for patterns. Common issues include:
- Material expectations (plastic vs. Metal, etc.)
- Battery inclusion (or exclusion)
- Assembly requirements
- Compatibility limitations
Add preemptive clarification in your bullets. "Important: Requires 2 AA batteries (not included)" prevents returns and negative reviews.
4. Quality Control Improvements (25-40% reduction for defect-related)
If "defective" or "damaged" appear frequently in your return reasons, implement:
- Pre-shipment inspection sampling (1-3% of units)
- Supplier quality agreements with penalty clauses
- Packaging upgrades for fragile items
- Batch tracking to identify problematic shipments
The Custom Breakdowns Feature lets you tag inventory by supplier and batch, making it easy to trace quality issues to their source.
5. Price-Value Alignment (10-15% reduction)
"Didn't meet expectations" often means the product didn't match perceived value at the price point. Harvard Business Review notes6 that value perception is relative to alternatives.
Options to fix:
- Reduce price to match perceived value
- Enhance packaging to increase perceived value
- Add accessories or bonuses to justify price
- Improve listing copy to communicate value better
6. Review Mining for Return Triggers (Variable impact)
Your negative reviews are a goldmine for return prevention. Look for phrases like:
- "Smaller than expected" (add dimension clarity)
- "Doesn't work with X" (add compatibility info)
- "Cheaply made" (material clarity or quality upgrade)
- "Confusing instructions" (improve documentation)
Cross-reference review complaints with return reason codes. The overlap reveals your highest-impact fixes.
7. Strategic Bundling (8-15% reduction)
Bundled products have lower return rates because:
- Higher perceived value reduces buyer remorse
- Complementary items increase satisfaction
- Partial returns are less common (returning one item from a bundle is inconvenient)
Consider bundling your highest-return products with complementary items that enhance the overall experience.
Building Your Return Analytics Dashboard
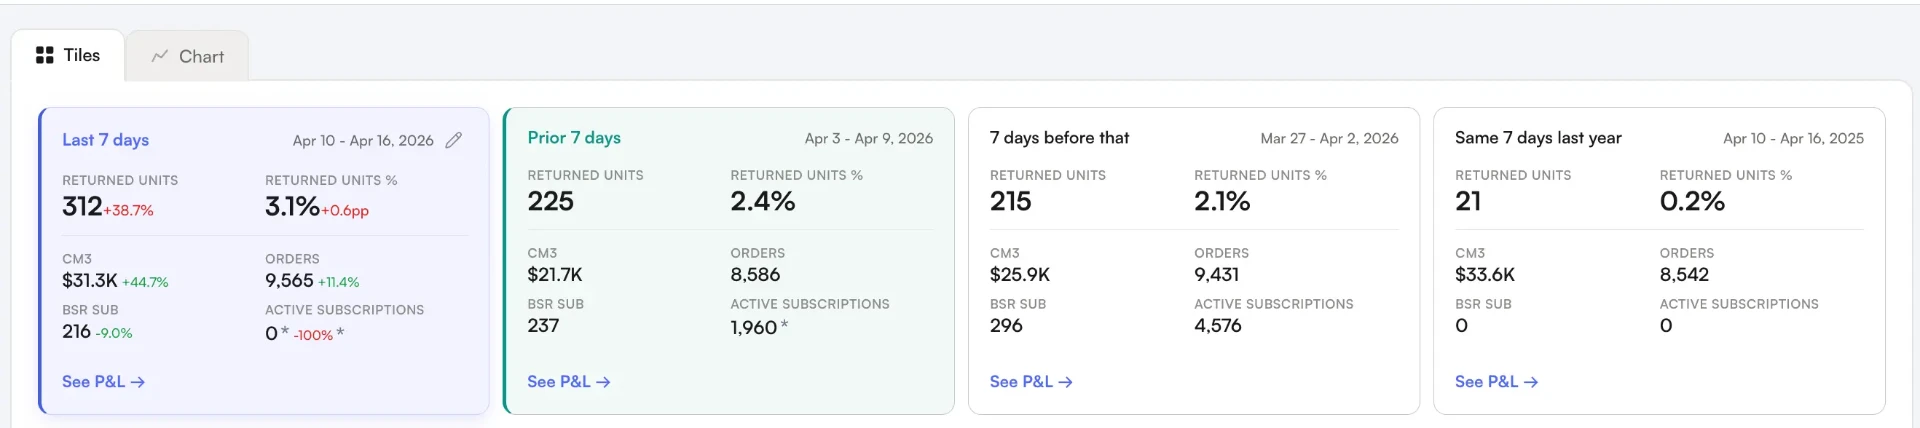
Effective return management requires consistent monitoring. Here's what your Day-to-Day Analytics should track:
Daily Monitoring (2 minutes)
- Total returns count vs. Rolling average
- Any single SKU with 3+ returns (spike detection)
- Return rate trend (7-day moving average)
Weekly Review (15 minutes)
- Top 10 highest return rate SKUs
- Return reason breakdown by category
- Comparison to category benchmarks
- Week-over-week trend by product
Monthly Deep Dive (45 minutes)
- Full catalog return rate ranking
- Financial impact calculation by SKU
- ROI on return reduction initiatives
- Supplier quality scorecard (if tracking batches)
The Nova analytics platform Consolidates these views into a single dashboard so you can monitor SKUs against your thresholds.
Warning: Don't Ignore Voice of Customer Reports
Amazon's Voice of Customer dashboard provides return reason insights that don't appear in standard reports. Sellers who ignore this data miss 30-40% of actionable return intelligence. Combine this with the Returns Dashboard for complete visibility.
Amazon's Returns Dashboard Features (2026)
Amazon rolled out a significantly upgraded Returns Dashboard8 that centralizes return analytics in ways previously impossible. This is a shift for sellers serious about reducing return costs.
Did You Know?
The Returns Dashboard consolidates FBA and FBM return settings in one place for the first time. Previously, sellers had to navigate multiple screens to manage return policies across fulfillment types.
Key Dashboard Features
| Feature | What It Shows | Action You Can Take |
|---|---|---|
| ASIN-Level Insights | Return metrics, trends, top reasons per product | Identify problem SKUs instantly |
| Critical Review Rate | Percentage of 1-3 star reviews by ASIN | Correlate reviews with return spikes |
| Recovery Insights | Grade and Resell metrics (graded units, sold units, net recovery) | Track recovered value from returned inventory |
| Resource Center | Customer feedback, returned item tracking, reports | Download granular data for analysis |
| Centralized Settings | FBA + FBM return policies in one view | Configure returnless rules by category |
Metrics Tracked in the New Dashboard
Total Returns
Units with return requests
Track volume trends over time
Return Rate %
Returns ÷ Shipped Units
Compare against category benchmarks
Net Recovery
Value recovered from resold returns
Measure Grade & Resell performance
Pro Tip: Weekly Dashboard Review Cadence
The dashboard updates daily. Set a weekly calendar reminder to review your top 10 ASINs by return rate and cross-reference with critical review rates. Products with high returns AND high critical review rates are your priority fixes.
Returnless Refund Optimization: The ROI Calculator
Returnless refunds let you refund customers without requiring them to ship the product back. It sounds counterintuitive, but for certain products, it saves money. Amazon allows sellers to configure returnless refunds for items priced between $1-$759.
When Returnless Makes Financial Sense
The math is straightforward. Calculate your all-in return processing cost:
Returnless Savings = Return Shipping ($3-5) + Restocking Labor (~$2) + Disposal Risk (10-30% of item value)
If this total exceeds the product cost, enable returnless refunds for that SKU.
Decision Framework by Price Point
| Item Price | Return Shipping | Restocking Time | Disposal Risk | Recommendation |
|---|---|---|---|---|
| Under $10 | $3-5 | 5 min | High | Enable returnless |
| $10-25 | $4-6 | 10 min | Medium | Enable for specific reasons |
| $25-50 | $5-8 | 15 min | Low | Case-by-case |
| Over $50 | $6-12 | 20+ min | Varies | Require return |
Configuring Returnless by Return Reason
Not all return reasons should trigger returnless refunds. Here's the strategic matrix:
- "No longer needed": Enable returnless. Low prevention potential. Customer already decided they don't want it.
- "Wrong size": Require return. You can resell the item. Use return data to fix size chart.
- "Defective": Enable returnless. You can't resell defective items anyway. Save the shipping cost.
- "Not as described": Require return. Verify the claim. Improve listing based on feedback.
The Price Threshold Sweet Spot
Based on Amazon's $1-$75 configurable range, most sellers find the optimal returnless threshold sits between $12-20. Below this range, return processing almost always costs more than the product value. Above it, the math starts favoring return collection.
Returnless Success Story
A home goods seller set a $15 returnless threshold for "defective" and "no longer needed" reasons. Monthly savings: $2,100 from avoided return shipping and restocking labor. ROI: 340% on lost product value. The key was being strategic about which reasons qualified.
The P&L Impact: Returns as a Line Item
Returns shouldn't be buried in your cost of goods. They deserve their own P&L line item with full visibility.
Your P&L analytics should show:
- Gross returns: Total refunded amount
- Return-related fees: Processing, shipping, disposal
- Net return cost: Gross returns + fees - recovered inventory value
- Return rate trend: Rolling 30/60/90 day comparison
- Return cost as % of revenue: your true return burden
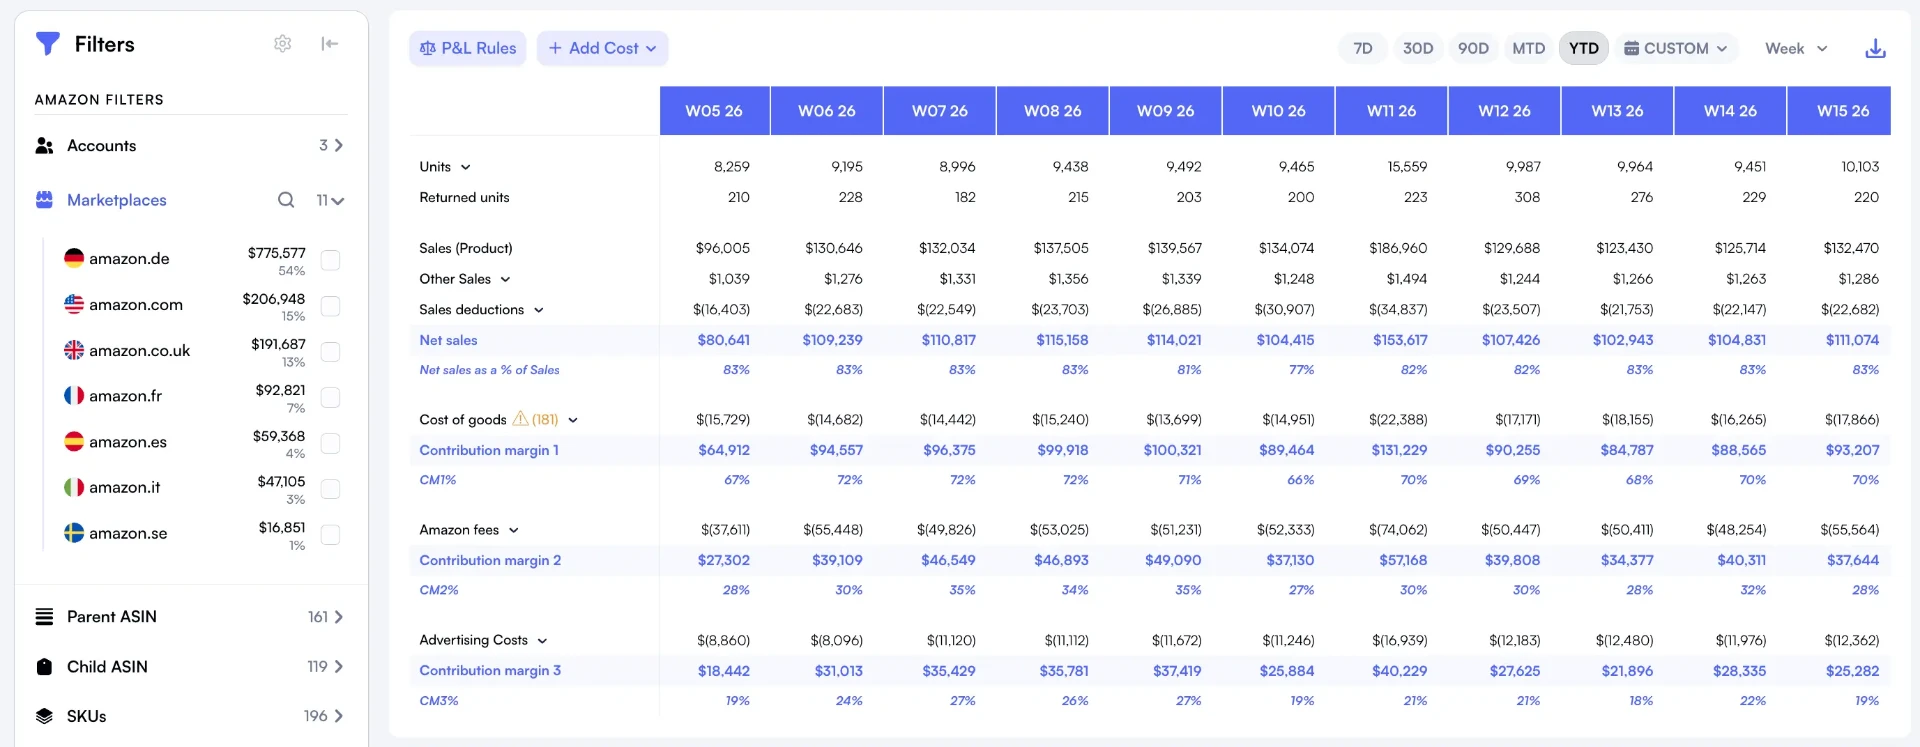
Returned units sit next to net sales, COGS, and CM3 inside your live P&L
This visibility transforms returns from a vague problem into a measurable KPI with clear improvement targets.
Case Study: Kitchen Brand Cuts Returns by 34%
A kitchen accessories brand selling $1.2M annually came to us with a 7.2% return rate. Above the 4-7% category benchmark, this was costing them roughly $86,000 in annual return-related losses.
The analysis revealed three problem SKUs accounting for 61% of all returns:
- Silicone spatula set: 14% return rate. Return reason: "smaller than expected." Fix: Added hand-in-frame images and explicit dimensions.
- Electric mixer: 11% return rate. Return reason: "defective." Fix: Switched suppliers and added protective packaging.
- Knife block: 9% return rate. Return reason: "doesn't fit my knives." Fix: Added compatibility chart listing knife brands/sizes.
Results After 90 Days
The brand's overall return rate dropped from 7.2% to 4.8% (34% improvement). Annual return cost savings: approximately $29,000. The spatula set alone went from 14% to 5.2% return rate after photography updates.
The key insight: they had been treating returns as an unavoidable cost of doing business. Product-level analytics revealed it was a solvable problem with specific solutions.
Case Study: Fashion Brand Reduces Size-Related Returns by 42%
Size-related returns plague apparel sellers. This women's casual clothing brand selling $800K annually had a return rate problem that was destroying margins.
Starting Return Rate
18%
vs 12% category benchmark
Annual Return Cost
$144K
Direct P&L impact
Size-Related Returns
64%
Of all return reasons
The Root Cause Analysis
Using the Custom Analytics Return breakdown, they discovered:
- Size charts only showed S/M/L without body measurements
- No fit guidance (runs small/large indicators)
- Model photos didn't include measurements or size worn
- Customer reviews mentioning fit were buried
The 5-Point Fix
- Size chart overhaul: Added bust, waist, hip measurements in inches and cm
- Fit notes in bullets: "Relaxed fit, size up if between sizes"
- Model measurements: "Model is 5'7", 130 lbs, wearing size M"
- Review mining: Featured customer reviews that mentioned fit in A+ Content
- A+ comparison chart: Side-by-side fit comparison showing their sizing vs. Common brands
Results After 90 Days
10.5%
New return rate (was 18%)
$60K
Annual savings
+23%
Review sentiment improvement
The bonus: improved size information also boosted conversion rate by 8%. Customers felt more confident purchasing, knowing exactly what they'd receive.
Case Study: Electronics Brand Cuts Defective Returns 58% with Packaging
"Defective" is the most frustrating return reason because it feels unsolvable. This Bluetooth speaker and accessories brand found that 80% of their "defective" returns weren't actually defective.
Starting Return Rate
11%
vs 8% category benchmark
"Defective" Returns
52%
Of all return reasons
Actually Defective
Only 20%
When tested in warehouse
The Root Cause Discovery
They tested 100 "defective" returns and found only 20 were actually defective. The rest:
- 45% Arrived with shipping damage (packaging inadequate)
- 25% Customers couldn't pair the device (user error)
- 10% Battery wasn't pre-charged (customers assumed dead)
The Multi-Pronged Solution
- Packaging upgrade: Added foam inserts and corner protection ($0.45/unit increase)
- Pre-pairing QR code: Sticker on device linking to 30-second setup video
- Battery pre-charge: all units shipped at 70% charge with "Ready to Use" messaging
- Insert card: "Having trouble? Scan here before returning" with troubleshooting QR
- Returnless for accessories: Enabled returnless refunds for items under $15
Results After 120 Days
"Defective" as % of returns
52% → 22% (58% reduction)
Overall return rate
11% → 6.8%
Packaging cost increase
$0.45/unit
Net annual savings
$38,000
The $0.45/unit packaging investment generated a 47x return. Sometimes the solution isn't product quality. It's protecting that quality through the shipping process and helping customers use the product correctly.
Advanced: Predicting High-Return Products Before Launch
Experienced sellers can predict return risk before listing new products. Red flags include:
- Size variation products: Apparel, jewelry, furniture (higher expectation mismatch risk)
- Complex assembly: Products requiring significant setup (higher frustration returns)
- Subjective quality: Fragrance, food, art (taste-based returns)
- Technology integration: Items requiring app connectivity (compatibility issues)
- High price point: more scrutiny leads to higher return likelihood
For high-risk categories, build return cost assumptions into your profit calculations before launch. If a product only works with a 3% return rate but category average is 8%, reconsider the opportunity.
Return Rate vs. Account Health
Amazon monitors return rates at the account level. According to Amazon's policies7, consistently high return rates can trigger:
- Listing suppression for specific ASINs
- Account health warnings
- Increased scrutiny on new listings
- Potential category restrictions
Track your account-level return rate against Amazon's thresholds. Most categories have informal triggers around 10-15% account-wide return rates. Staying below category benchmarks keeps you in safe territory.
Connecting Returns to Your Broader Analytics Strategy
Return analytics don't exist in isolation. They connect to every other metric in your business:
- Advertising efficiency: High-return products have artificially inflated ROAS. Your profitability dashboard should factor in return rates.
- Inventory planning: High-return SKUs need buffer stock to maintain availability during return processing.
- Supplier negotiations: Return rate data gives use for quality improvement discussions.
- Product development: Return patterns inform design improvements for next versions.
The brand managers and FBA sellers who master return analytics don't just reduce costs. They build better products, write better listings, and make smarter sourcing decisions.
Your Return Rate Action Plan
Start with these steps this week:
- Access Amazon's Returns Dashboard: Navigate to Seller Central → Reports → Returns → Insights to explore the Returns Dashboard.
- Export your return data: Last 90 days, by SKU, with reason codes.
- Calculate SKU-level return rates: Flag anything 50%+ above category average.
- Identify your top 5 problem SKUs: Rank by financial impact, not just rate.
- Configure returnless refunds: Enable for items under $15 with "defective" or "no longer needed" reasons.
- Diagnose root causes: Map return reasons to actionable categories.
- Implement one fix per SKU: Start with the highest-impact changes.
- Set up ongoing monitoring: Weekly dashboard review with your analytics platform.
Most sellers can implement meaningful return reduction within 30 days. The payoff compounds. Lower returns mean better reviews, better rankings, and better margins.
Returns are inevitable. Excessive returns aren't. The difference is analytics.
Ready to Transform Your Amazon Business?
Join thousands of successful sellers who use Nova Analytics to make data-driven decisions and maximize their profits.
Sources & References
- 1 Industry analysis: Returns cost retailers approximately 59% of the original sale price when factoring in all associated expenses including reverse logistics.
- 2 National Retail Federation: Consumer Returns in the Retail Industry 2024
- 3 McKinsey & Company: Improving Returns Management for Apparel Companies
- 4 Baymard Institute: Apparel: 10 Best Practices on Sizing
- 5 Industry best practice: 78% of online shoppers want photos that bring products to life with multiple angles and lifestyle imagery.
- 6 Harvard Business Review: A Quick Guide to Value-Based Pricing
- 7 Amazon policies: Consistently high return rates can trigger listing suppression and account health warnings. Most categories have informal triggers around 10-15% account-wide return rates.
- 8 Amazon's Returns Dashboard upgrades in 2025-2026 centralized return analytics for sellers.
- 9 Amazon Seller Central: Returnless refund settings allow sellers to offer automatic refunds without requiring item return.
- 10 NRF & Happy Returns: 2024 Consumer Returns Report
- 11 Amazon announced Returns Dashboard features in 2025-2026 to help sellers manage return analytics.
Continue Learning
Explore more expert insights to grow your Amazon business
Amazon Contribution Margin Calculator
Gross profit tells you if a product is viable. Contribution margin tells you if it's worth your time. Learn how to calculate CM1, CM2, and CM3 for Amazon products with category benchmarks and strategic applications.
Amazon Profit Dashboard Setup
Most sellers wait until they're losing money before tracking profits. This guide walks through setting up a profit dashboard in 30 minutes, what data you need, and the three insights you'll discover in week one.
Amazon Seller KPI Benchmarks 2026: 30 Metrics by Category
Every KPI that matters for Amazon sellers in 2026, organized by category with real benchmarks. Revenue, profitability, advertising, inventory, and strategic metrics with healthy ranges.