From CM2 to true net margin: 4 cost layers sellers miss
CM2 is a SKU-decision metric. True net margin is what you actually keep. Four cost layers sit between them: long-tail Amazon fees, refund admin, late-arriving adjustments, and reimbursement netting.
By AntoinePublished Apr 27, 2026Updated Oct 8, 202611 minAnalytics
Most Amazon operators stop their P&L at contribution margin and assume the rest is rounding. It is not. Between the CM2 number on your dashboard and the true net margin a finance lead would defend, four cost layers are usually under-counted. Each one is small on its own. Together they routinely eat 2 to 5 percent of revenue, which is often the entire net margin on a mid-sized FBA business.
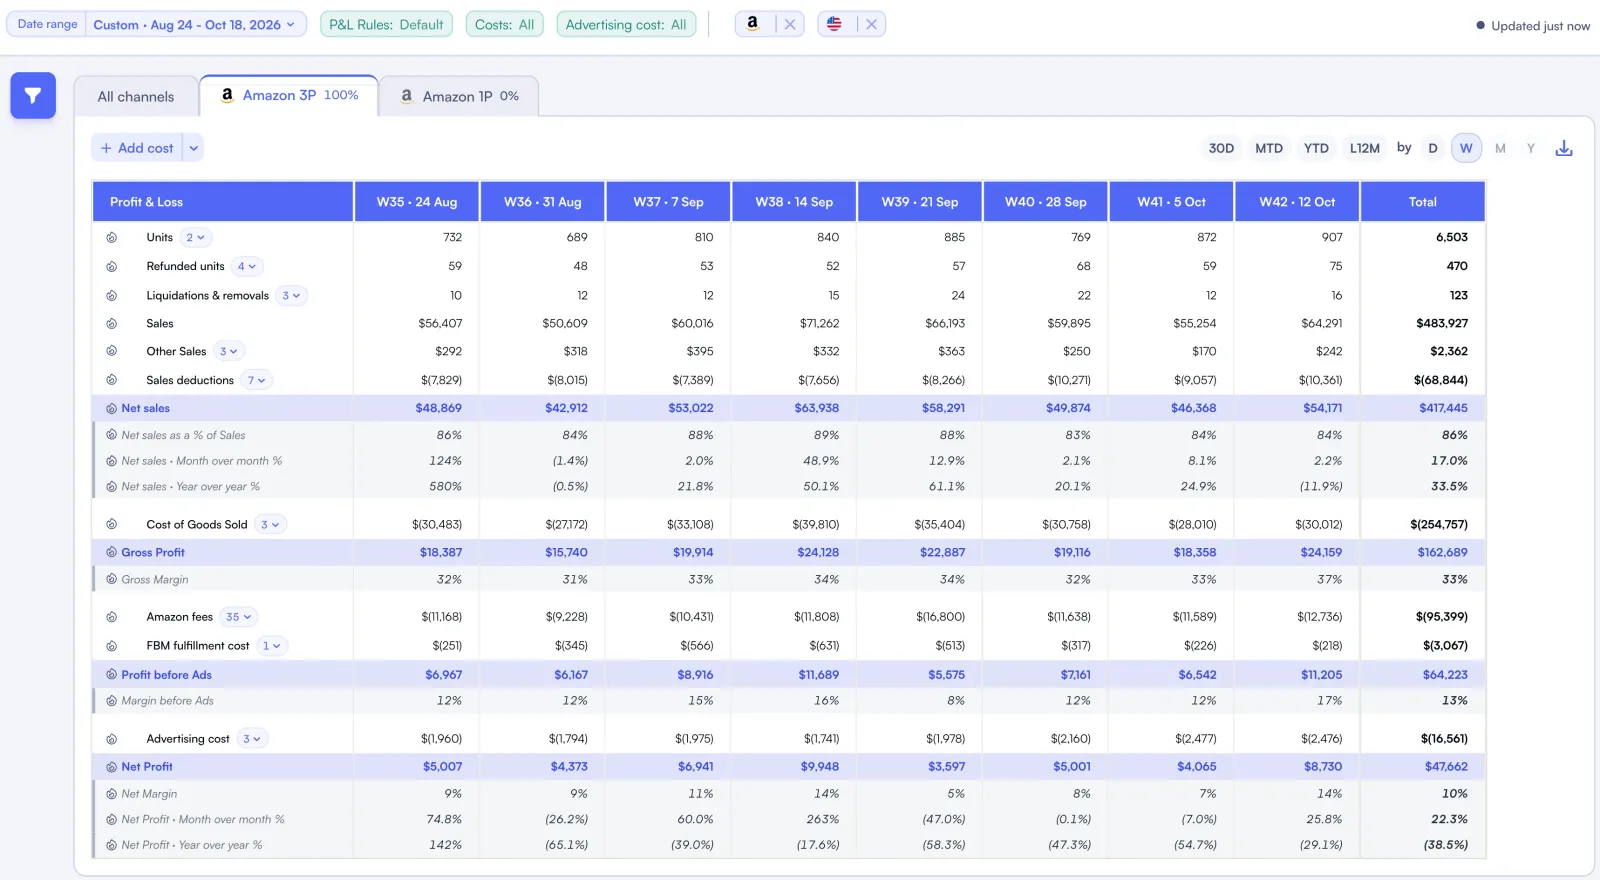
Read sales alongside every cost layer to see how much profit remains.
TL;DR - Key Takeaways
•CM2 is a useful SKU-decision metric. True net margin is what you actually keep, and the two diverge by 2 to 5 percent of revenue for most brands.
•Four cost layers explain the gap: long-tail Amazon fees, refund admin and return processing, late-arriving settlement adjustments, and reimbursement credits booked against the wrong period.
•Amazon reports 40+ distinct fee types. Most dashboards surface 5 to 10 and call it a day.
•Refund administration fees alone shave 1 to 2 percent off net margin in apparel, electronics and supplements.
•The fix is fee-line completeness at the SKU level, not a new spreadsheet.
Our take
If you only do one thing this quarter
Pull a 90-day Date Range Transaction report from Seller Central, list every distinct fee type that appears, and compare it to the line items in your current P&L tool. Anything missing is real margin you cannot see.
Best fit if
•Brands above $500K annual revenue where long-tail fees start to matter
•Finance leads reconciling a month-end P&L against Seller Central reports
•Aggregators and agencies running multiple accounts where fee profiles vary by category
Skip if
•Sub-$200K sellers where headline FBA + referral fees explain 95% of cost
•Pure FBM operations with a much narrower fee surface
CM2 is the right metric for SKU decisions. It tells you whether a product pays for itself once you net out COGS, the headline fulfillment fee, storage, returns and the ad spend that drove the order. For deciding which products to keep and which to kill, it is the cleanest signal you have.
The trouble starts when you treat CM2 as the bottom line. According to Marketplace Pulse coverage of Amazon's 2024 fee changes, Amazon now reports more than 40 distinct fee types to FBA sellers, with new line items added every year. Most analytics tools surface the five or six largest fees and roll the rest into a generic "other" bucket, which is exactly where margin goes to hide.
Layer one: the long tail of Amazon-reported fees
Pull a Date Range Transaction report and the fee taxonomy is much wider than most operators expect. Beyond referral and FBA fulfillment, you will see monthly storage, long-term storage, aged-inventory surcharge, low-inventory-level fee, FBA inbound placement, removal, disposal, return processing, refund administration, high-volume listing fee, the fuel and inflation surcharge, and a category-specific long tail.
On its own each line is small. Across a 90-day window on a multi-SKU catalog the long-tail total typically lands at 1 to 3 percent of revenue. That is the difference between a 12 percent net margin and a 9 percent one.
Nova insight
Nova currently tracks 40+ Amazon fee types at the SKU level with 99.9% reported accuracy across the 23 supported marketplaces. The calculation includes FBA inbound placement, low-inventory-level, aged-inventory surcharge, refund administration, and the fuel and inflation surcharge.
Layer two: refund administration and return processing
When a customer returns an item, two things happen on the cost side that rarely make it into a CM2 view. First, Amazon keeps a portion of the original referral fee as a refund administration fee (the lower of 20 percent of the referral fee or $5 per the Seller Central refund administration fee documentation). Second, in apparel, shoes, watches, jewelry, luggage and a handful of other categories, Amazon charges a return processing fee on the returned unit.
For a brand running a 12 percent return rate (typical for apparel) the combined refund admin plus return processing fees can shave 1 to 2 percent off net margin. If your CM2 view treats refunds as a simple revenue reversal, that fee leakage is invisible.
The four cost layers between CM2 and true net margin
Layer
Typical impact on margin
Where to find it
Long-tail Amazon fees (30+ line items)
1-3% of revenue
Date Range Transaction report
Refund admin + return processing
0.5-2% of revenue
Refund event detail in payments report
Late-arriving settlement adjustments
0.3-1% of revenue
Next settlement after original sale
Reimbursement credits booked to wrong period
0.5-1.5% of revenue
Inventory adjustment events
A-to-z claim debits
0.1-0.5% of revenue
Account-level adjustments
FX margin on cross-marketplace
0.3-1% spread
Marketplace currency reports
Layer three: late-arriving settlement adjustments
Amazon settles on a defined cycle. Some adjustments to a sale (a chargeback debit, a delayed FBA fee correction, a category-fee restatement) do not appear on the same settlement as the original order. They land one or two settlements later. If your P&L books the original sale in March but the related adjustment hits in May, March will look better than it actually was and May will look worse.
The fix is not a cash-flow tool. It is a P&L view that ties every adjustment back to the original sale event so March's number is restated when the late line item arrives. Without that, monthly margin numbers oscillate by half a point in either direction for no operational reason.
Nova surfaces 40+ Amazon fee types at the SKU level, restates late-arriving adjustments, and reports refunds and reimbursements as proper P&L lines. Real-time sales, 23 marketplaces.
Layer four: reimbursement credits booked to the wrong period
When FBA loses, damages or destroys inventory, Amazon eventually issues a reimbursement. By the time the credit lands, the original loss event may be one or two months old. Booking the reimbursement as current-period revenue inflates this month's margin and hides the underlying inventory loss rate.
The clean treatment: report the reimbursement credit as a cost offset against the original event so the gross inventory loss, the recovered amount, and the net margin impact are all visible on the same line. Nova reports reimbursements as a P&L line item with the underlying event reference, which makes this reconciliation tractable at month-end. Treating reimbursements as topline revenue, by contrast, is one of the recurring patterns flagged in industry coverage of FBA return economics.
Nova insight
The honest test for whether your tooling handles reimbursements correctly: run your monthly P&L for any month with a known inventory loss event. Does the reimbursement credit appear as an offset against the original loss, or as a separate income line? If it is income, the gross loss rate is being masked.
Putting the four layers into one true-net-margin view
Closing the gap between CM2 and true net margin means four additions to the standard P&L view, each at the SKU level.
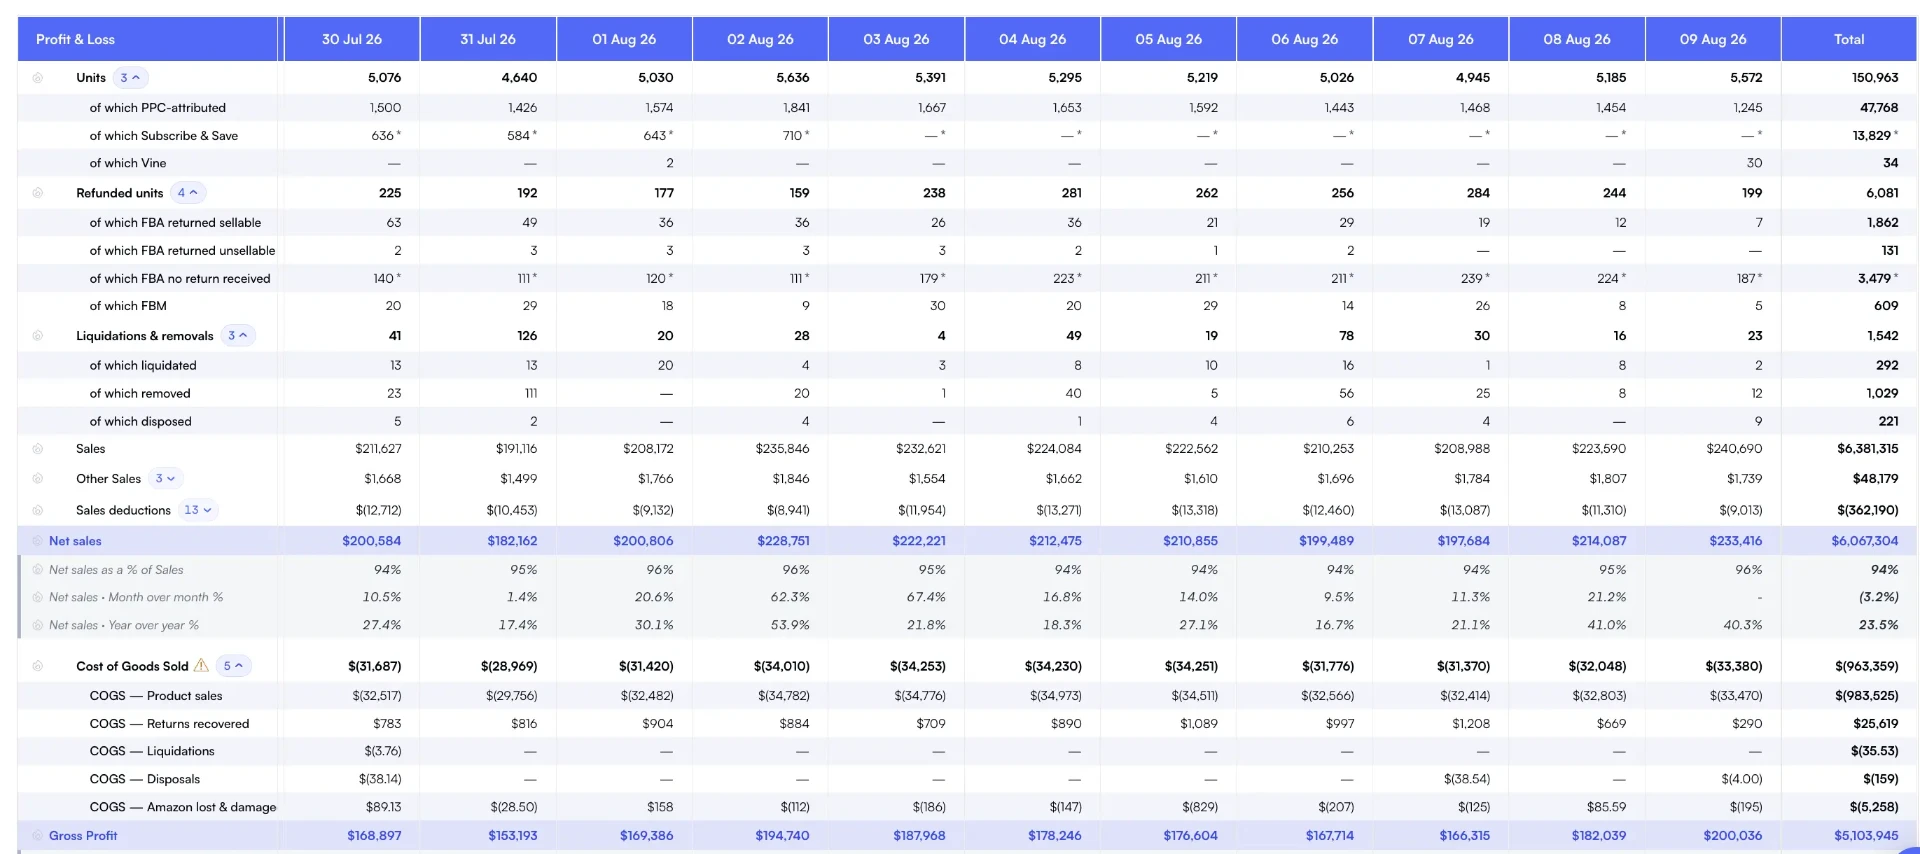
Stock exits carry product costs that belong in the profit review.
Fee-line completeness. Surface every Amazon-reported fee type, not just the largest five. Anything rolled into "other" is margin you cannot manage.
Refund-event detail. Decompose every refund into the customer credit, the refund admin fee, and the return processing fee. Track per-SKU.
Settlement restatement. When a late adjustment arrives, restate the original month rather than booking the cost in the current month.
Reimbursement netting. Book reimbursement credits as offsets against the original loss event, not as topline revenue.
Not everyone. Brands below $200K annual revenue can usually run a P&L from the headline fees and the COGS file without losing meaningful signal. The long-tail fees are too small in absolute terms to matter at that scale.
Above $500K, the math shifts. Two percent of revenue on a $1M brand is $20K of margin walking out the door each year, and that number compounds with growth. Above $5M with a multi-marketplace footprint, the long-tail fee profile varies enough between marketplaces that a single rolled-up "fees" number stops being defensible at month-end. Statista marketplace data shows FBA continues to grow as a share of third-party sales, which means more sellers operating at the scale where this matters.
The bottom line
CM2 answers whether a SKU is profitable. True net margin answers what you actually keep. The four cost layers between them (long-tail fees, refund admin, late-arriving adjustments, reimbursement netting) are individually small and collectively large enough to consume the entire net margin on a mid-sized FBA business.
Surface every fee Amazon charges at the SKU level, treat refunds and reimbursements as proper P&L lines, and the gap between dashboard margin and bank-statement margin closes.
Frequently asked questions
CM2 (contribution margin level 2) subtracts COGS, fulfillment fees, storage and ad spend from net revenue. True net margin goes further and subtracts the long tail of Amazon-reported fees (refund administration fees, return processing, removal and disposal, low-inventory-level fees, fuel and inflation surcharges, FBA inbound placement, aged-inventory surcharges) plus reimbursement credits. The gap between the two is typically 2 to 5 percent of revenue, which is often the entire net margin on a mid-sized FBA business.
Most dashboards stop at the headline FBA fulfillment fee and the referral fee. They miss the 30+ smaller line items Amazon reports separately on the Date Range Transaction view, plus refunds and reimbursements that arrive in a later settlement than the original sale. Those items net out to a real cost that is invisible on the dashboard but very visible on the bank statement at month-end.
Amazon reports more than 40 distinct fee types across the FBA program: referral fees, FBA fulfillment, monthly storage, long-term storage, aged-inventory surcharge, low-inventory-level fee, FBA inbound placement, removal, disposal, return processing, refund administration, high-volume listing fees, fuel and inflation surcharge, and a long tail of category-specific fees. Nova surfaces all 40+ at the SKU level so the long tail stops being invisible.
When a customer returns an item, Amazon refunds the customer and then keeps a portion of the original referral fee as a refund administration fee (typically 20 percent of the referral fee or $5, whichever is lower). On categories with high return rates, this fee alone can shave 1 to 2 percent off net margin and is rarely surfaced on default seller dashboards.
Track them as a cost offset against the original event (lost inventory, damaged inventory, customer refund). Treating reimbursements as revenue inflates your top line and hides the underlying inventory loss rate. Nova reports reimbursements as a P&L line so you can see the gross loss, the credit Amazon issued, and the net impact on margin.
Brands above $500K annual revenue start to see meaningful margin leakage from the long-tail fees because volume amplifies the per-unit math. Below that, the headline fees usually explain 95 percent of the cost. Above $5M with a multi-marketplace footprint, granular fee tracking is the difference between a defensible monthly close and a quarterly surprise.
Ready to Transform Your Amazon Business?
Join thousands of successful sellers who use Nova Analytics to make data-driven decisions and maximize their profits.