Q1 2026 brought new Amazon fees, fuel surcharges, and reimbursement changes. Here's exactly what to check in your P&L before Q2 decisions are locked in.
Amazon changed several fees and policies around Q1 2026. The January FBA fulfillment fee update, the 3.5% fuel and logistics-related surcharge effective 17 April, continued Low Inventory Level fee enforcement, and the first full quarter of the November 2025 manufacturing-cost reimbursement policy can make a Q1 P&L differ from Q4 2025. Check each change before making Q2 decisions.
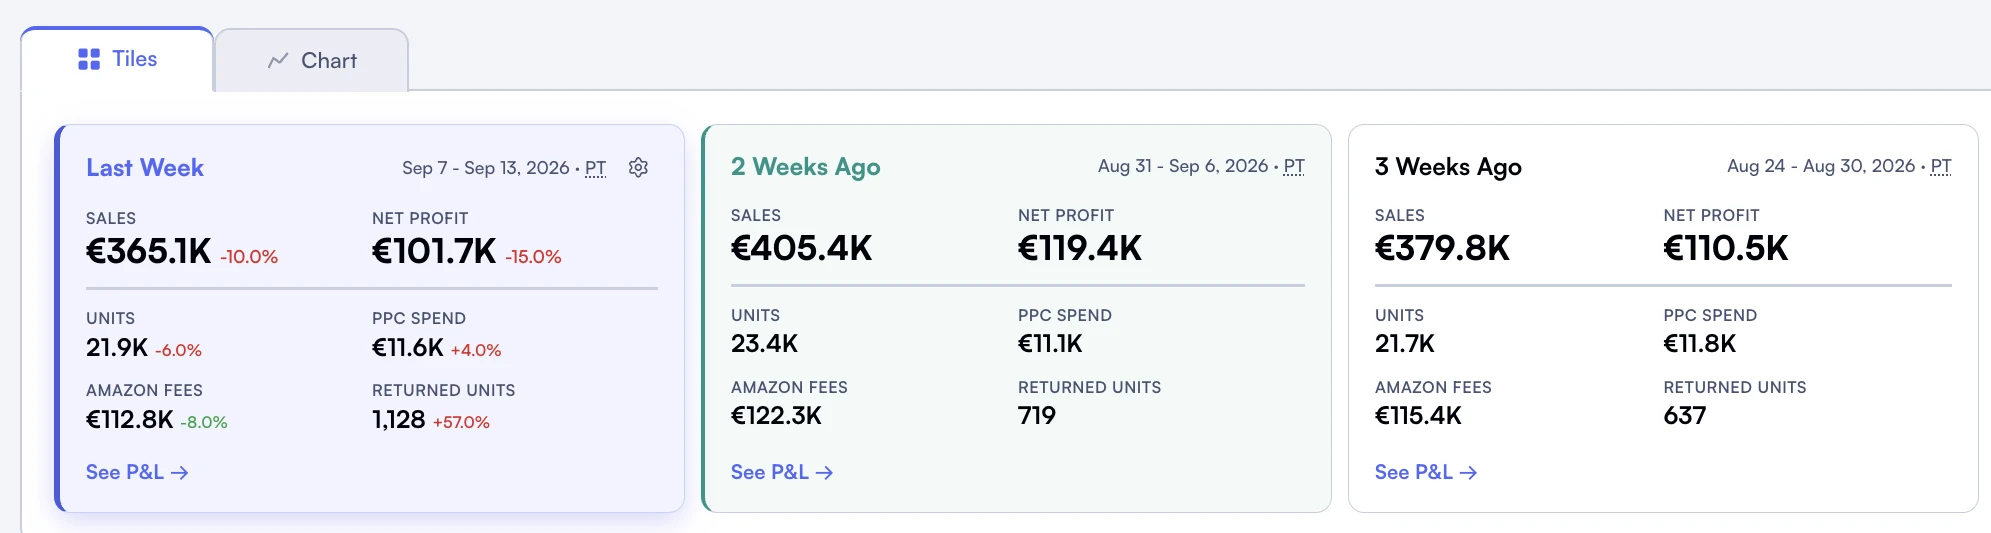
Period tiles provide a starting point for investigating changes in performance.
This is a practical close-out checklist. We walk through what actually changed in Q1, the seven line items every seller should audit before booking the quarter, three SKU patterns that quietly destroyed margin between January and March, and the operational adjustments worth making in the next 30 days.
What changed in Q1 2026
Five Amazon policy and fee changes took effect between January and April 2026. Review each one against the published rate card and your own per-unit costs.
FBA fulfillment fees
+$0.04 to $0.61
Per-unit increase by size tier (Jan 15, 2026)
Fuel surcharge
+3.5%
Applied to FBA fulfillment fees from April 17, 2026
Reimbursement basis
Mfg cost
Replaces sale-price basis (effective Nov 15, 2025)
The five changes that matter
1. January 15 FBA fulfillment fee update
Standard size and oversize fees moved up across the board. Small standard items absorbed the smallest dollar increase but the largest percentage hit. Large bulky and special oversize categories took the biggest absolute increase per unit. Read the full breakdown in our 2026 FBA fee changes guide.
2. April 17 fuel and logistics-related surcharge
Amazon applied a 3.5% fuel and logistics-related surcharge to FBA fulfillment fees from April 17, 2026. Q2 is the first quarter to include the surcharge.
The LIL fee continued through Q1 with no policy relief. Sellers maintaining less than 28 days of historical supply on standard-size items kept paying it on every unit shipped. For seasonal catalogs winding down from Q4, January and February were prime LIL exposure months.
4. AWD storage rate adjustments
Amazon Warehousing and Distribution rates adjusted in Q1, with longer-tenure storage tiers seeing the most movement. For sellers using AWD as their upstream buffer for FBA, this changed the effective cost of holding stock outside the fulfillment network.
5. Manufacturing-cost reimbursement policy (first full quarter)
The November 15, 2025 policy change shifted reimbursement valuations from sale price to manufacturing cost for lost or damaged FBA inventory. Q1 2026 was the first full quarter operating under it, which means your reimbursement totals for Jan to March are not directly comparable to last year's. See our reimbursement guide for the documentation requirements.
Q4 2025 vs Q1 2026 fee deltas at a glance
Fee category
Q4 2025
Q1 2026
Direction
FBA fulfillment (standard)
2025 schedule
+$0.04 to $0.21 / unit
Up
FBA fulfillment (oversize)
2025 schedule
+$0.20 to $0.61 / unit
Up
Fuel surcharge
None
3.5% (from April 17)
New line item
Low Inventory Level fee
Active
Active
Unchanged
Reimbursement basis
Sale price (until Nov 15)
Manufacturing cost
Lower payouts
Source comparison: Amazon FBA fee schedule and Amazon news releases. For broader context on fee trajectory, see Marketplace Pulse on Amazon's take rate.
The 7 line items to audit on your Q1 P&L
Don't try to audit every transaction. Focus on the seven line items where Q1 2026 changes are most likely to have moved your numbers without you noticing. For each one, the question is the same: did this line behave the way I expected, and if not, which SKUs caused the variance?
1. Fulfillment fee per unit (compare January vs March)
Pull your FBA fulfillment fee column for the same top 20 SKUs in January and March. The delta should reflect the January 15 fee schedule update. If a SKU shows a larger jump than expected, check whether its size tier changed at intake. Dimensional reclassification quietly moves products into more expensive tiers and is one of the most common silent margin killers.
2. Inbound placement service fee
Look at total inbound placement fees for Q1 and divide by units shipped in. If your per-unit inbound cost crept up versus Q4, you're likely defaulting to the optimized split shipment option more often. For high-velocity SKUs the math can flip toward partial or minimal shipment splits, especially if you have AWD upstream.
3. Storage utilization fee plus AWD costs
Combine your monthly FBA storage fees, aged inventory surcharge, storage utilization fee, and AWD storage fees into one quarterly bucket. Then divide by average units on hand. This gives you a cost-of-holding figure that you can compare against Q4. Check every component because the line items are scattered across reports.
4. Reimbursement amounts (under the new manufacturing-cost basis)
Pull total reimbursements for Q1 and compare to Q1 2025 as a percentage of revenue. If the ratio dropped by more than 30 percent, the new manufacturing-cost basis is doing what it was designed to do: lower payouts. The action item is making sure your Cost of Goods values in Seller Central are accurate and up to date, because that figure is now the basis for what Amazon owes you.
5. Returns processing fee per category
Returns processing fees apply to high-return-rate categories. Run the calculation per parent ASIN: total return processing fee divided by units sold. If a single category is running above 8 percent return rate and pulling the per-unit fee with it, that SKU's contribution margin is being silently eroded. Our return rate analytics guide covers the diagnostic steps.
6. PPC spend allocation per SKU
Aggregate ad spend at the SKU level for Q1, then compare each SKU's spend against its gross profit. The pattern to look for: SKUs where ad spend grew faster than gross profit. These are the ones that look like they're "scaling" in revenue terms but are actually dragging total contribution margin down. For the methodology, see tracking PPC ROI per product.
7. True contribution margin per SKU
The final line. Revenue minus referral fee, FBA fees, storage fees, return costs, COGS, and PPC spend, calculated for each SKU. If you only do one of these seven audits, do this one. It's the only number that tells you which products actually made you money in Q1 versus which ones just generated revenue.
Pro tip: run this audit in the first month of the quarter
Q2 buying decisions, PPC budget reallocation, and SKU-level price changes all benefit from being grounded in a clean Q1 reading. Doing this audit in early May after Q2 is already underway means decisions have already been made on incomplete information.
Three patterns to check for
These three checks require a SKU-level contribution margin breakdown rather than a top-line sales review.
Pattern 1: Winners losing margin
If your top revenue SKUs absorbed the January fulfillment fee increase without a price adjustment, contribution margin per unit falls. Calculate the change for each SKU using Amazon's published fee schedule.
Pattern 2: Losers eating fees
Check whether low-revenue SKUs generated storage fees, aged inventory surcharges, or return fees through Q1. If those costs exceed the SKU's contribution, consider consolidating storage, discounting to clear, or removing it entirely. Our SKU rationalization guide walks through the decision tree.
Pattern 3: Hidden seasonal shifts
Products that sold heavily in Q4 stayed in inventory through Q1 because reorder cadence was set to historical pre-Q4 demand. Result: Low Inventory Level fee on the wrong SKUs (those that did move quickly post-holiday) and storage utilization charges on the ones that didn't. The fix is recalibrating reorder triggers based on the post-Q4 sell-through curve, not the holiday peak.
If you'd rather not pull this manually
The seven-line audit above takes between 4 and 12 hours per quarter for a 50 to 200 SKU catalog if you're working from raw Seller Central exports. Most of that time is matching identifiers between fee reports, ad reports, and order reports, then rebuilding contribution margin per SKU.
If you want this view automatically across all your SKUs and all 23 marketplaces, Nova connects to Seller Central via SP-API and tracks 40+ Amazon fee types alongside COGS, refunds, reimbursements, and product-level ad spend. The Q1 vs Q2 comparison, the per-SKU contribution margin, and the fee-line breakdown are all there without spreadsheet work. Connecting takes about 5 minutes.
For sellers who want to keep their existing spreadsheet workflow, the operating principle is the same: the audit only matters if it actually gets done before Q2 decisions are locked in. Whatever method gets you there is the right one.
What to set up before Q2 ends
Update Cost of Goods values in Seller Central
The manufacturing-cost reimbursement policy uses the COGS value Amazon has on file. If yours is empty, outdated, or set to a placeholder, your reimbursement payouts will be lower than they should be. Do this once per SKU and revisit quarterly.
Reprice the SKUs absorbing the January fee increase
For your top 20 revenue SKUs, calculate the fee delta from January 15 onward and decide whether to absorb it, partially pass through, or reprice fully. Going into Q2 with no decision is itself a decision, and usually the wrong one.
Recalibrate reorder cadence post-Q4
The seasonal-shift pattern from earlier compounds throughout the year. Use Q1 sell-through to set Q2 and Q3 reorder triggers, not Q4 demand. This is also the best time to address Low Inventory Level fee exposure before it affects Q2 unit economics.
Adopt a recurring weekly review
Quarterly recap is necessary, but it's downstream of weekly review discipline. Our weekly business review checklist covers the rhythm that catches fee drift inside 7 days instead of 90.
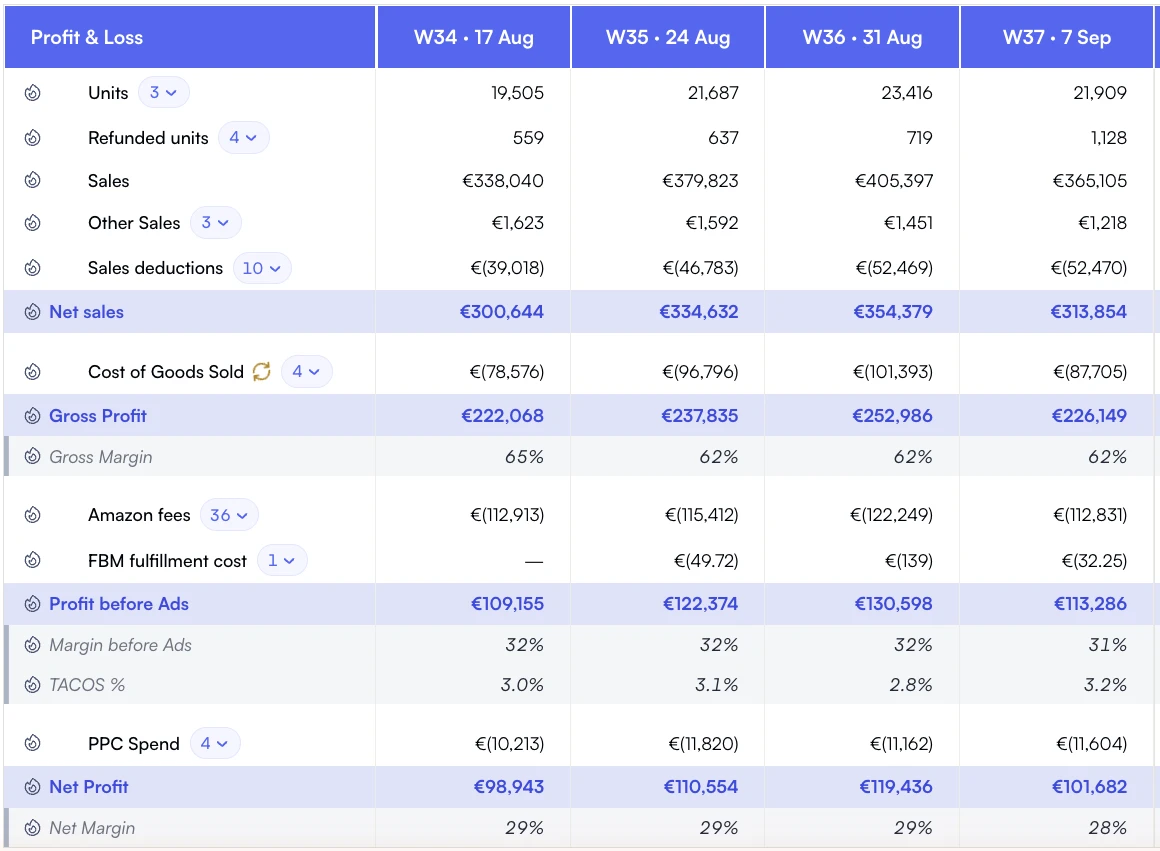
A weekly P&L puts margin changes and advertising pressure in the same review.
Plan the fuel surcharge into Q2 forecasts
Amazon's 3.5% fuel and logistics-related surcharge applies to FBA fulfillment fees from April 17. Apply it to each SKU's published fulfillment fee when updating Q2 contribution margin assumptions.
For internal management reporting, by the third week of April. Amazon's settlement cadence means you'll have all of March's fee and reimbursement data settled by mid-April. Waiting until end of April delays Q2 decisions by a full month for no analytical benefit.
No. The November 15, 2025 effective date applies to incidents reported on or after that date. Anything before continues to use the previous valuation method. Q1 2026 is the first quarter where the entire reimbursement bucket is under the new basis.
No. Focus on the top 20 revenue SKUs first. For low-velocity SKUs, repricing can trigger Buy Box volatility that costs more than the fee increase itself. Match the response to the SKU's strategic role in the catalog. Our pricing strategy guide has the framework.
Compare units sold and gross revenue Q4 vs Q1, then compare contribution margin Q4 vs Q1. If units and revenue held but margin dropped, fees are the cause. If units and revenue dropped, it's demand or competitive pressure. If both moved against you, it's compounding and the SKU needs immediate attention.
Run the audit at brand level first, then drill into the worst-performing brand at SKU level. Trying to audit 500+ SKUs in a single pass leads to analysis fatigue. For agencies and aggregators managing portfolios, segmented dashboards across brands and marketplaces make this scalable. See our multi-brand portfolio analytics guide.
Closing the quarter
Q1 2026 was a quarter of small, compounding fee shifts rather than one dramatic change. That makes it easy to miss. Treat the fee changes as a reason to tighten per-SKU contribution margin tracking rather than as background noise.
The work between now and end of April: clean Q1 close, repriced top SKUs, accurate COGS uploaded to Seller Central, and a reorder cadence that reflects post-Q4 reality. That's the foundation for Q2 unit economics that don't drift further.