Best Amazon Profitability Software for FBA Sellers 2026
Our 2026 ranking of the top 9 Amazon profitability software tools, scored on a seven-criterion buyer scorecard. Nova leads with live SKU and marketplace P&L plus custom-category tagging, with side-by-side comparison and decision matrix by seller archetype.
TL;DR: which Amazon profitability software to pick
Best overall:Nova. Live SKU and marketplace P&L, product-level PPC joined, product tagging so you can build a P&L for any brand or category you define, 23 Amazon marketplaces, from $49/month.
Best for power users on a large catalog:SellerLegend. Dense reporting if you can absorb the UI.
Best for agencies and aggregators:Nova agency tier. Multi-account consolidation, white-label exports, per-account billing at $49.
Best low-cost entry point:Sellerboard. Basic daily P&L, dated UI, fine for a single small private-label catalog.
Amazon profitability software is the category of tools that calculates true net profit per SKU, per marketplace, after referral fees, FBA fulfillment, storage, returns, refunds, reimbursements, and product-level advertising spend. It is not bookkeeping software, it is not a research tool, and it is not a PPC bid manager. If your spreadsheet still says "profit" and you suspect it does not, this is the category you need.
This 2026 ranking covers what profitability software has to do, the seven-criterion scorecard serious buyers use, nine tools worth a real evaluation (numbered #1 to #9), a side-by-side comparison table, a decision matrix by seller archetype, and an honest look at implementation cost.
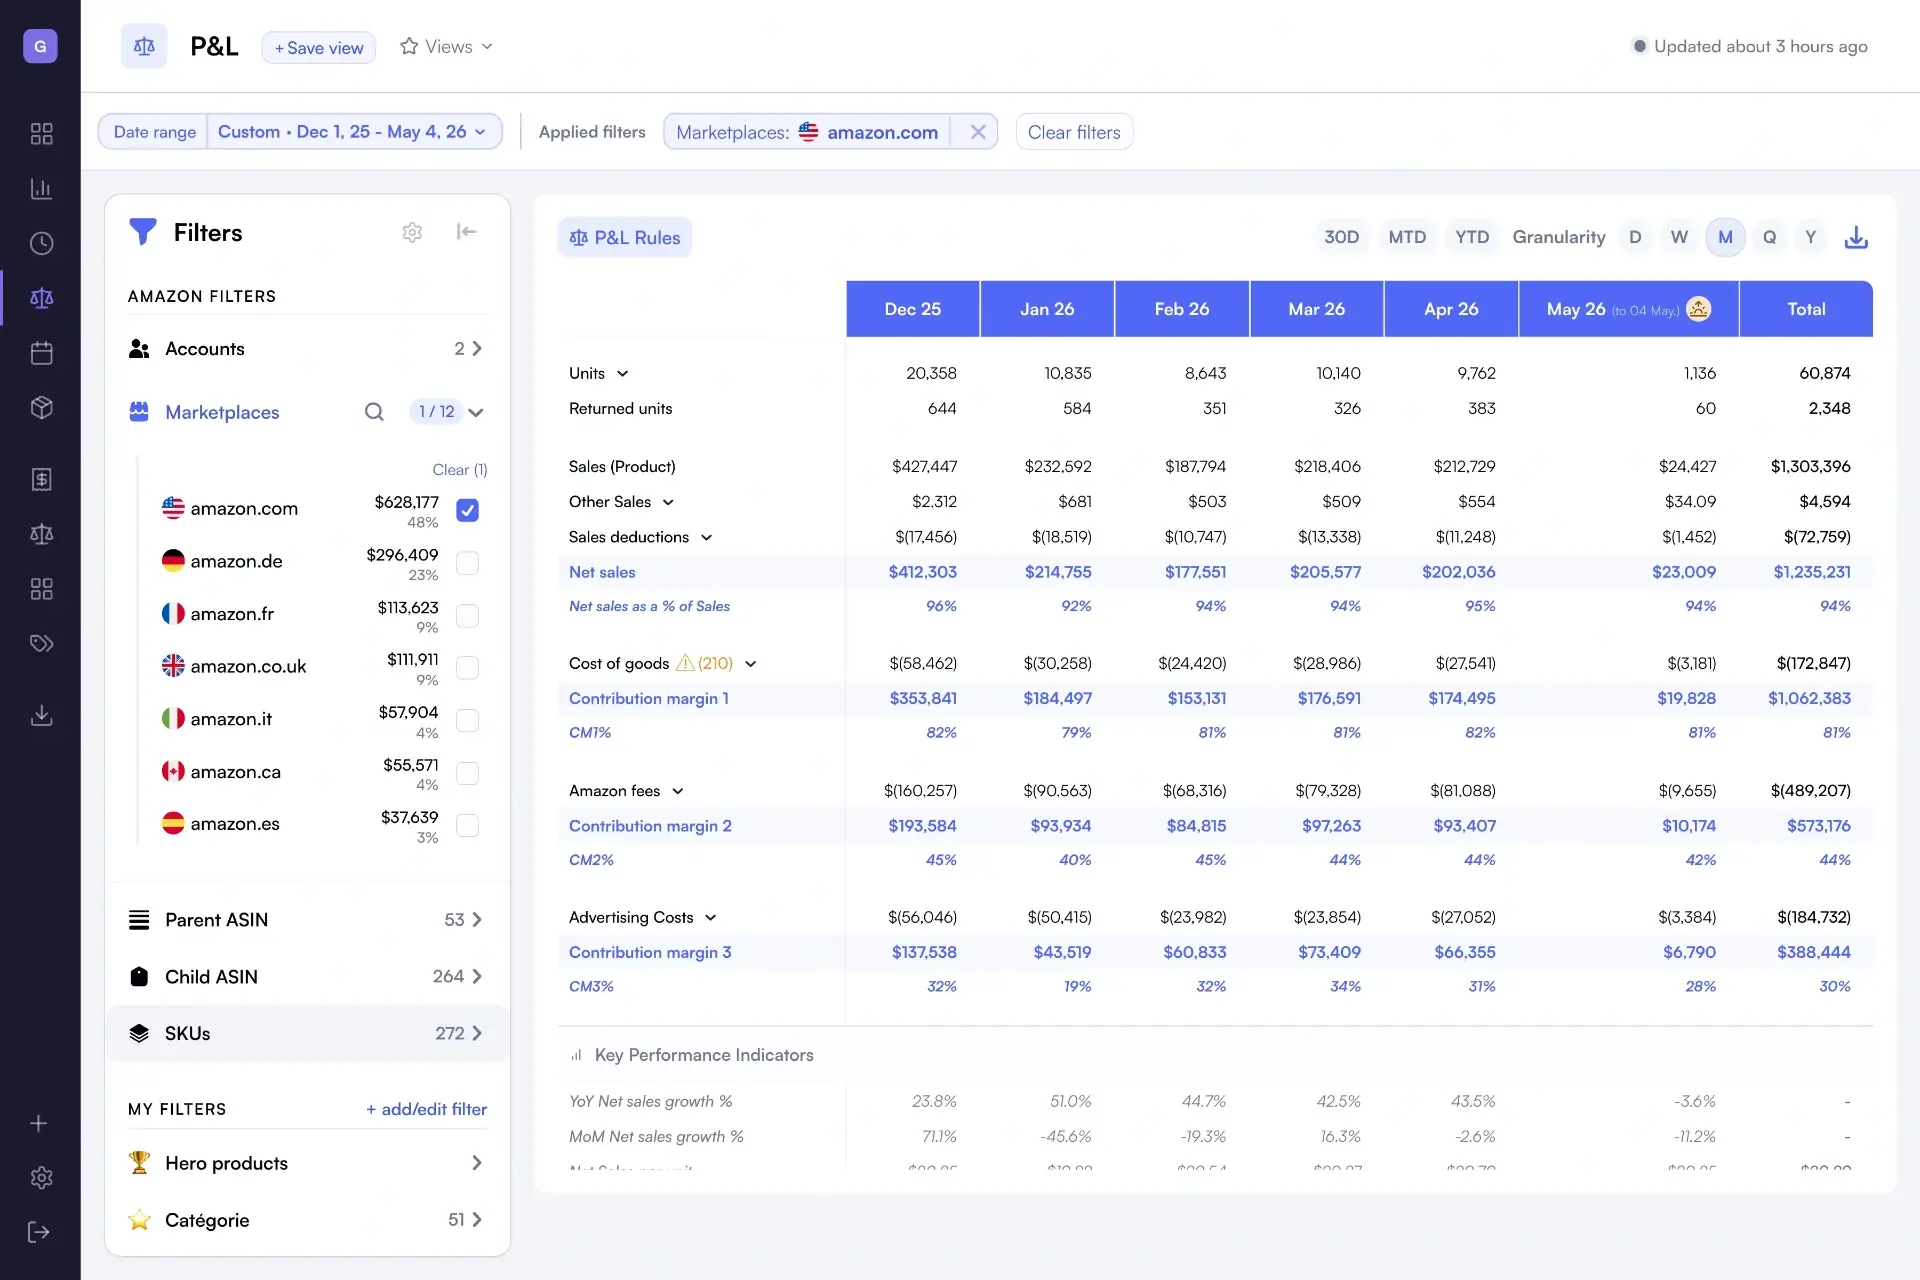
Nova's SKU-level P&L: every fee, return, refund and PPC line joined to contribution margin.
What Amazon profitability software has to do
Core capabilities
SP-API ingestion of orders, settlements, returns, refunds, fees
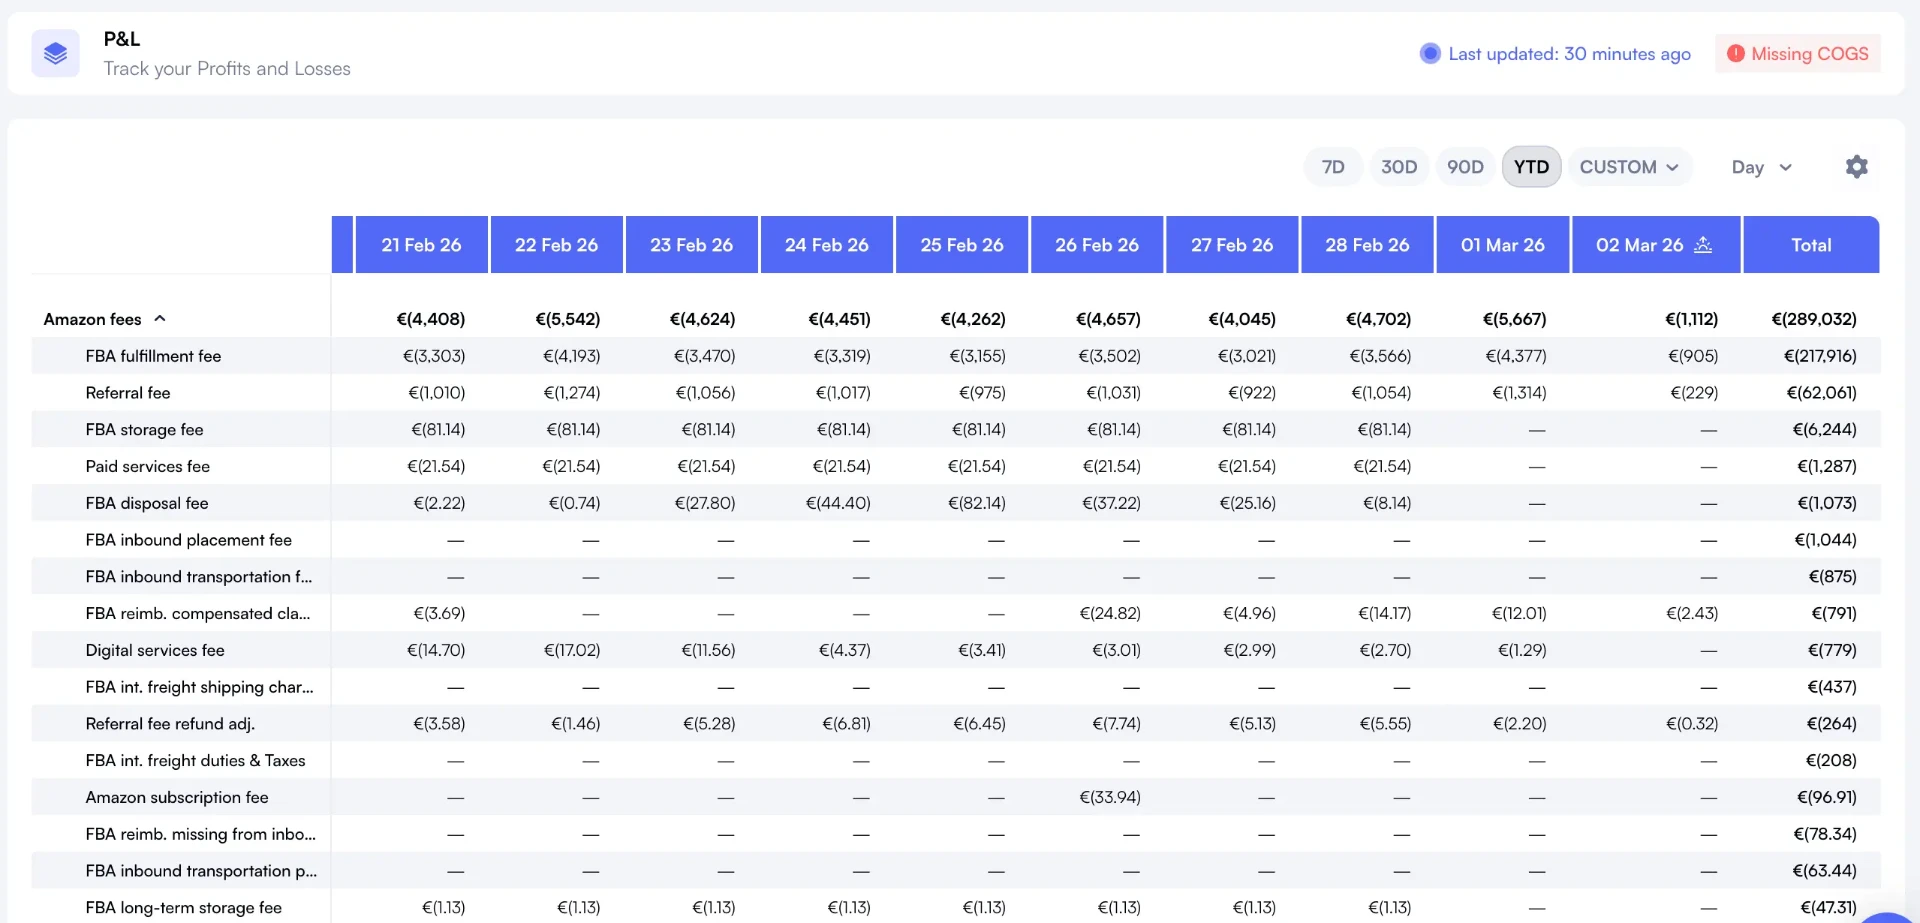
Fee normalization across the 40+ fee types Amazon charges
SKU-level COGS with date-effective landed cost
Multi-marketplace consolidation, with currency normalized
Product-level PPC spend joined to the SKU P&L
Near-real-time refresh: same-day decisions need same-day data
Out of scope
Bookkeeping and tax filing (different category)
Product research and sourcing decisions
Listing copy and image generation
Bid management and campaign creation
Reimbursement-case filing
Fee normalization in Nova: 40+ Amazon fee types itemized at the SKU level.
The pattern most sellers get wrong is treating a research tool, an accounting package, or a PPC manager as a profitability tool. They are adjacent categories. A research tool tells you what to launch; an accounting package tells you what you owe in tax; a PPC manager tells you what to bid. None of them give you the per-SKU, per-marketplace net profit number that drives reorder, kill, and reprice decisions.
Selection criteria scorecard
Use these seven criteria to evaluate any candidate. If a vendor cannot answer all seven during a demo, the tool is not a profitability platform, it is a dashboard.
Criterion
What to ask
Why it matters
Data freshness
How often does the SKU P&L refresh?
Daily is the floor in 2026; sub-hour is the standard for active sellers.
Fee coverage
How many distinct fee types are itemized?
Amazon ships 40+. Tools that bucket fees into 4 or 5 lines hide leaks.
Marketplace coverage
How many Amazon marketplaces and with FX normalized?
EU and JP sellers cannot live with a US-only tool.
SKU granularity
Can you see margin at the SKU level, not just brand or category?
Category averages hide loss-making SKUs subsidized by winners.
PPC integration
Is product-level ad spend joined to the SKU row natively?
True ROAS depends on this join; manual stitching wastes hours per week.
Export / API
Can you export every metric to CSV or pull via API?
Finance teams will demand it. Tools that lock data are a future migration cost.
Transparent pricing
Is the price on the website, with no quote-required tier hiding the real cost?
Hidden pricing usually means per-revenue billing that punishes growth.
How this ranking was built
Each tool was scored against the seven criteria above. Weighting reflects what serious operators actually use the category for: SKU-level fee depth and PPC integration count double, because they are the two places dashboards usually fake the math. Multi-marketplace coverage matters more in 2026 than it did three years ago, since most growing brands now sell in at least three Amazon regions.
Pricing transparency is a tiebreaker, not a top criterion. Free trials of at least 14 days were treated as a baseline expectation; shorter trials get a deduction because they cannot cover a full settlement cycle. Tools were demoed inside the last 90 days where possible. Anything that required a sales call to see a working demo screen lost a position.
The ranking is intentionally short. There are dozens of dashboards that surface order counts and call it profit; the nine below are the ones that actually compute net contribution margin per SKU and per marketplace. For a third-party editorial view of the category (not a software vendor, a media and analyst site that covers it), the RevenueGeeks roundup of Amazon analytics tools is a useful cross-reference.
Best for: sellers and agencies that need live SKU and marketplace P&L with product-level PPC joined, across 23 Amazon marketplaces.
Highlights: sub-hour refresh, 40+ fee types itemized, 371 metrics, product tagging so you can build a P&L for any brand, category or sub-catalog you define, exportable to CSV and BI tools, transparent pricing from $49/month with a 14-day free trial and no credit card required.
Trade-off: not a PPC bid manager and not a reimbursement-case service. Use it for the profit view; pair with a bid tool and a reimbursement service if those workflows matter.
Verdict: the most complete live profitability stack at the price. The default pick for 2026 unless you have a specific reason not to.
P&L of your own categories (product tagging)
Most Amazon profit tools force you into Amazon's catalog tree: brand, parent ASIN, child SKU, marketplace. That breaks down the moment you run two brands under one Seller Central account, want a separate P&L for hero SKUs versus the long tail, or need to isolate hazmat from non-hazmat for margin reviews.
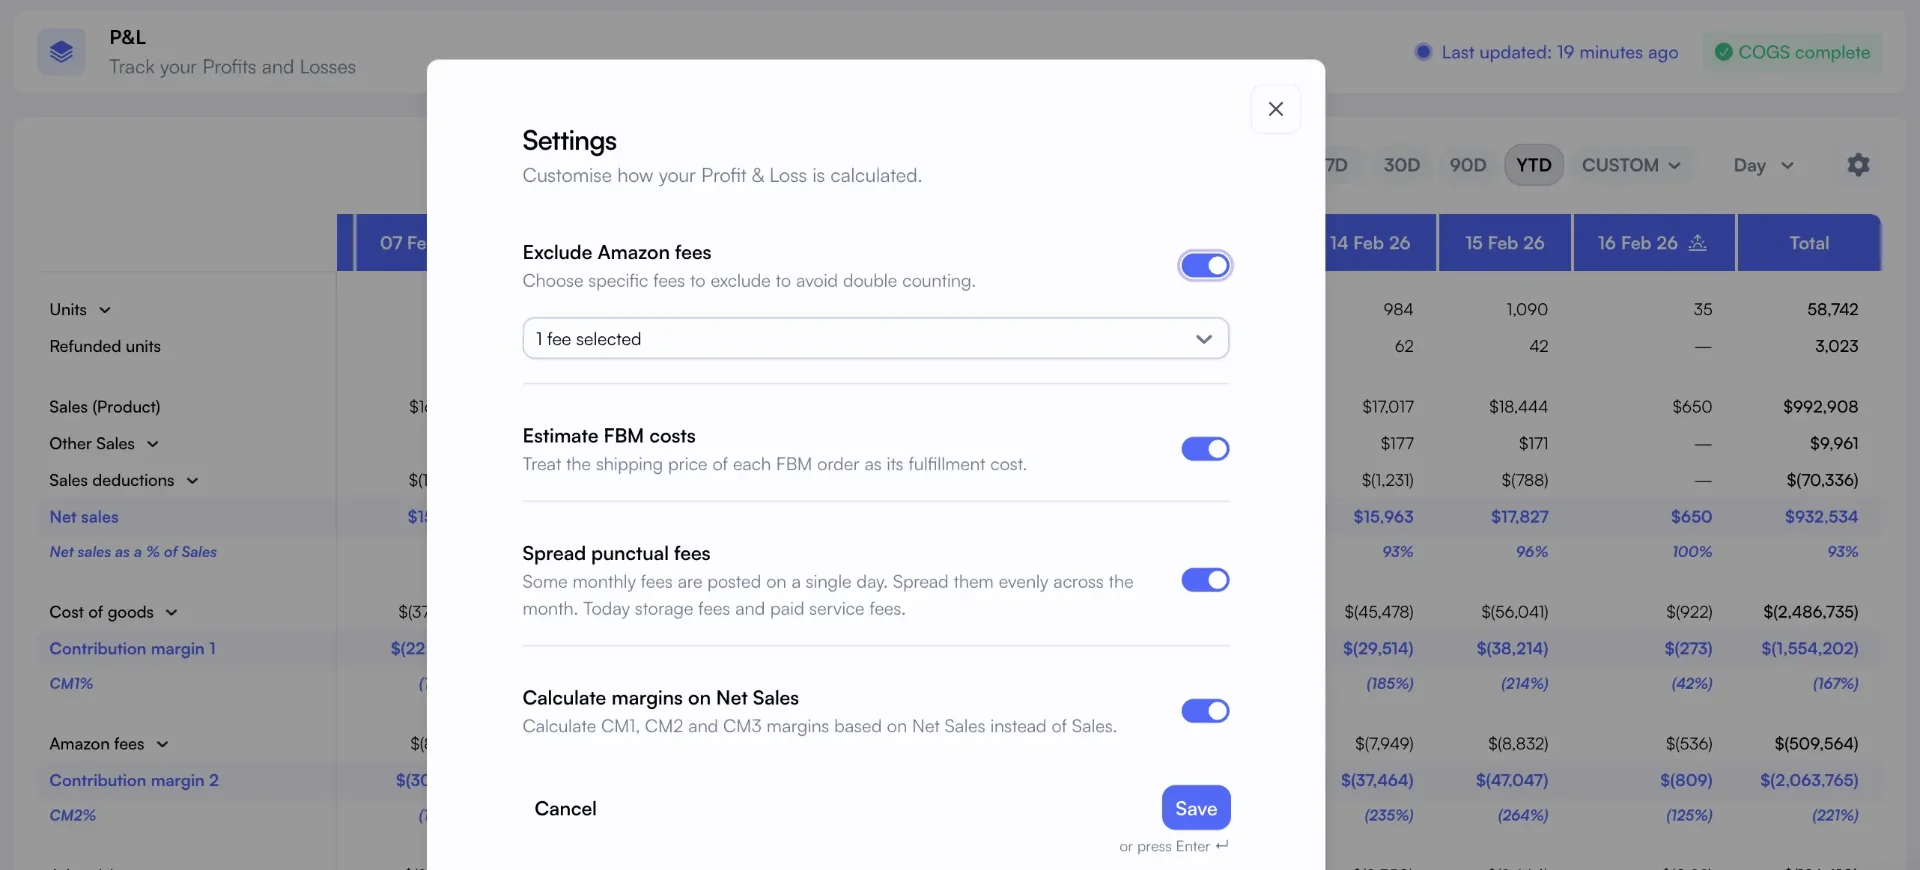
Nova lets you tag any product with your own labels and pivot the P&L on them. Filter by brand, marketplace, custom tag or any combination, save unlimited views, and reuse them for weekly reviews. The result is a P&L of your own categories, not Amazon's. See how custom breakdowns work.
Customizable P&L columns, product tags and saved views in Nova.
Trade-off: dated UI, less granular fee handling on EU marketplaces, refresh cadence trails the category leaders, PPC depth is limited.
Verdict: acceptable as a starter for a single small catalog. Most sellers outgrow it within a year of serious operating.
7. Sellerise
Best for: sellers who want profit reporting bundled with research, listing, and keyword tools in one suite.
Highlights: suite breadth, profit dashboard included in higher tiers.
Trade-off: profitability is one module among many. Depth on fee normalization and multi-marketplace currency handling is shallower than category specialists.
Verdict: reasonable if you genuinely want the bundle. Weak if profit is the only thing you came for.
8. SellerApp
Best for: sellers running an analytics suite where profit is one workstream alongside keyword and listing tools.
Highlights: broad analytics surface, profit layer in the higher tiers, established multi-marketplace footprint.
Trade-off: profit depth is not the headline; if SKU P&L is the core job, category specialists win on detail.
Verdict: a fair pick when the suite breadth is the real reason you are buying.
9. Gorilla ROI
Best for: finance teams already living in Google Sheets that want profit data pulled into their own spreadsheet model.
Highlights: sheet-native distribution, flexible reporting, plays well with custom downstream models.
Trade-off: you build the dashboard. Time saved versus a turn-key tool depends on how strong your sheets team is.
Verdict: the right tool when a real spreadsheet model already exists and a SaaS dashboard would replace something better.
Setup time: 5 minutes for Amazon OAuth, 2–24 hours for historical SP-API backfill, 1–2 hours to upload COGS and tag the catalog. Anyone quoting "weeks" is selling consulting, not software.
Pricing floor: serious tools start around $49–$79/month. Anything cheaper is usually a research tool with a profit tab.
Per-account billing: agencies and aggregators should ask whether extra Seller Central accounts are billed at the base rate or discounted. Nova bills additional accounts at $49 each.
Free trial that proves it: 14 days is the realistic floor, long enough to see a full settlement cycle. Trials shorter than 7 days are demos in disguise.
Enterprise quotes: if a vendor refuses to publish any price, expect a per-revenue contract that scales with growth. Negotiate accordingly.