Amazon COGS by SKU: Track True Product Profitability
Your average COGS is hiding the truth. That '35% margin' masks SKUs running at 45% and others hemorrhaging at 15%. Here's how to track costs per product.
Your average COGS is hiding the truth about which products actually make money. That "35% margin" across your catalog? Some SKUs run at 45% while others hemorrhage at 15%. Without SKU-level cost tracking, you're flying blind on pricing, advertising, and inventory decisions.
This guide shows you how to set up accurate per-product cost tracking, handle the complexity of variants and bundles, and use granular COGS data to identify margin compression before it kills your profitability.
Why Average COGS Destroys Your Profit Visibility
Most Amazon sellers calculate a single "blended" cost across their catalog. This creates dangerous blind spots.
The Blended COGS Trap
Seller has 50 SKUs with an "average" landed cost of $12 per unit. They price everything at $29.99 assuming 60% gross margin. Reality: 15 SKUs cost $8 (true margin: 73%) while 10 SKUs cost $18 (true margin: 40%). They're overinvesting in ads for the low-margin products and underpricing the high-margin winners.
Result: Annual profit 23% lower than it should be. They only discovered this after a full cost audit.
The problem compounds with advertising. If you allocate PPC budget equally across products, you're subsidizing your worst performers with profit from your best. TACoS looks acceptable at the portfolio level while individual product economics tell a different story.
Pricing Errors
18%
Average profit lost to pricing decisions based on blended costs
Hidden Losers
12%
SKUs that appear profitable with blended COGS but lose money individually
Advertising Waste
$2,400/mo
Average wasted ad spend on negative-margin products
What Belongs in SKU-Level COGS
Complete landed cost includes every expense required to get a product to Amazon's warehouse, ready for sale:
Direct Product Costs
Unit cost from manufacturer/supplier
Packaging and inserts per unit
Labeling costs If outsourced
Quality inspection per unit allocation
Freight and Logistics
International shipping (sea/air freight allocated per unit)
Customs duties (percentage of declared value)
Freight forwarder fees (per shipment allocated)
Domestic freight to FBA (per unit or per case)
Pro Tip: Allocate Shipping Per Unit Weight
When a container holds multiple SKUs, allocate freight cost by weight rather than by quantity. A 2-pound product should carry twice the shipping cost of a 1-pound product. This prevents your lightweight items from subsidizing your heavy ones.
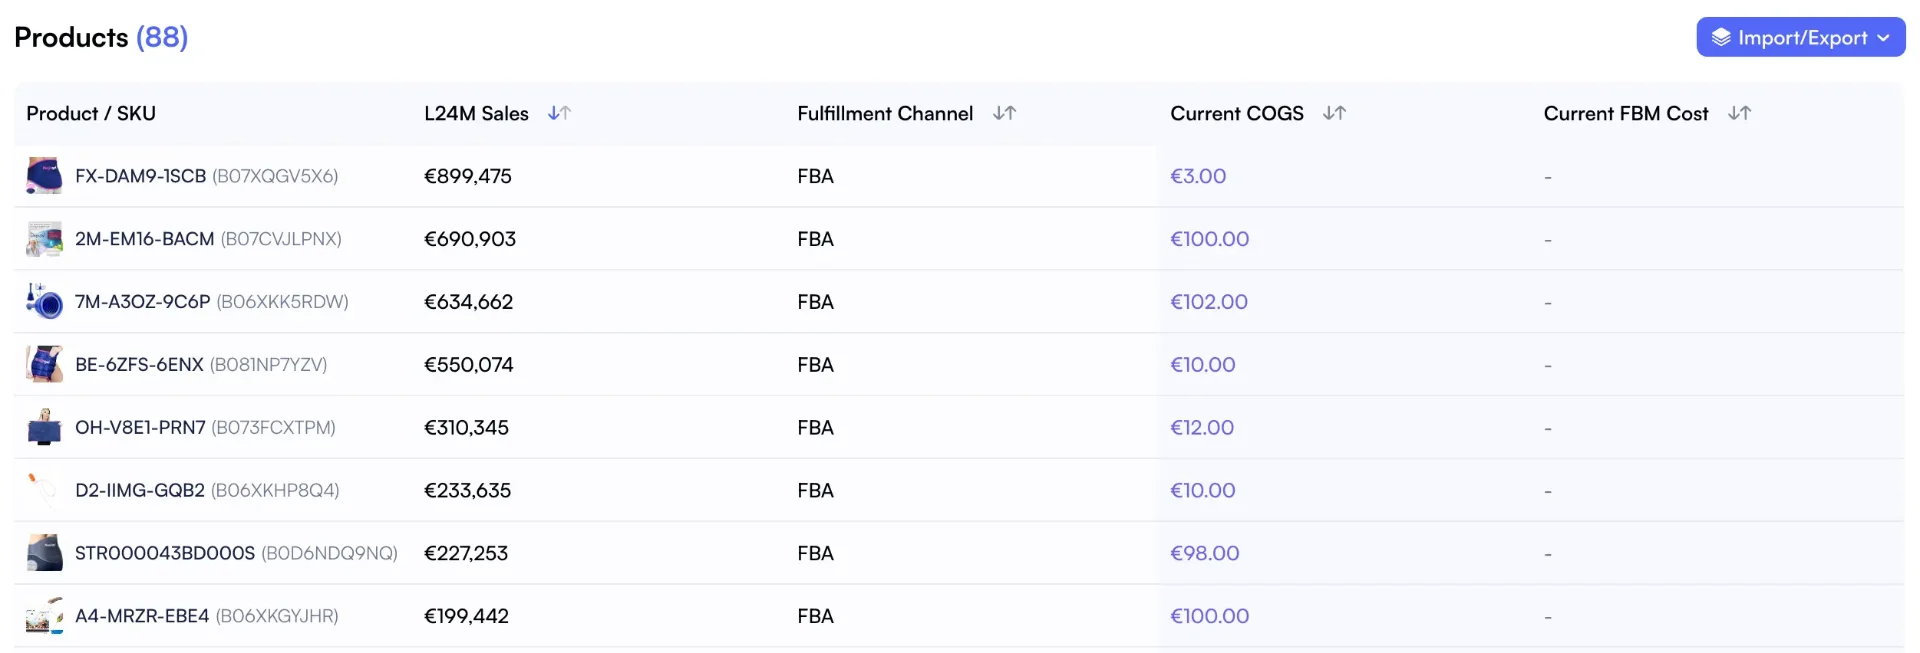
Nova's COGS Manager Interface
Nova's COGS Manager lets you set costs at the individual SKU level with period-based pricing to handle cost changes over time.
COGS Manager with per-SKU cost tracking and period-based pricing support
Setting Up SKU-Level Cost Tracking
The setup process depends on your current data state. Here's the practical path for most sellers:
Step 1: Export Your Product Catalog
Pull your complete SKU list from Seller Central. You need ASIN, SKU, and current inventory levels. This becomes your cost tracking master file.
Step 2: Gather Purchase Documentation
Collect your last 3-6 months of supplier invoices, freight bills, and customs declarations. You'll calculate actual landed costs from real transactions rather than estimates.
Step 3: Calculate Per-Unit Landed Cost
For each SKU, sum all costs and divide by units received:
Input each SKU's landed cost. In Nova, this takes about 30 seconds per product. For large catalogs, you can import costs via CSV.
Step 5: Set Cost Effective Dates
Costs change over time. Set the effective date for each cost entry so historical reports use historical costs, not today's prices. This is crucial for accurate trend analysis.
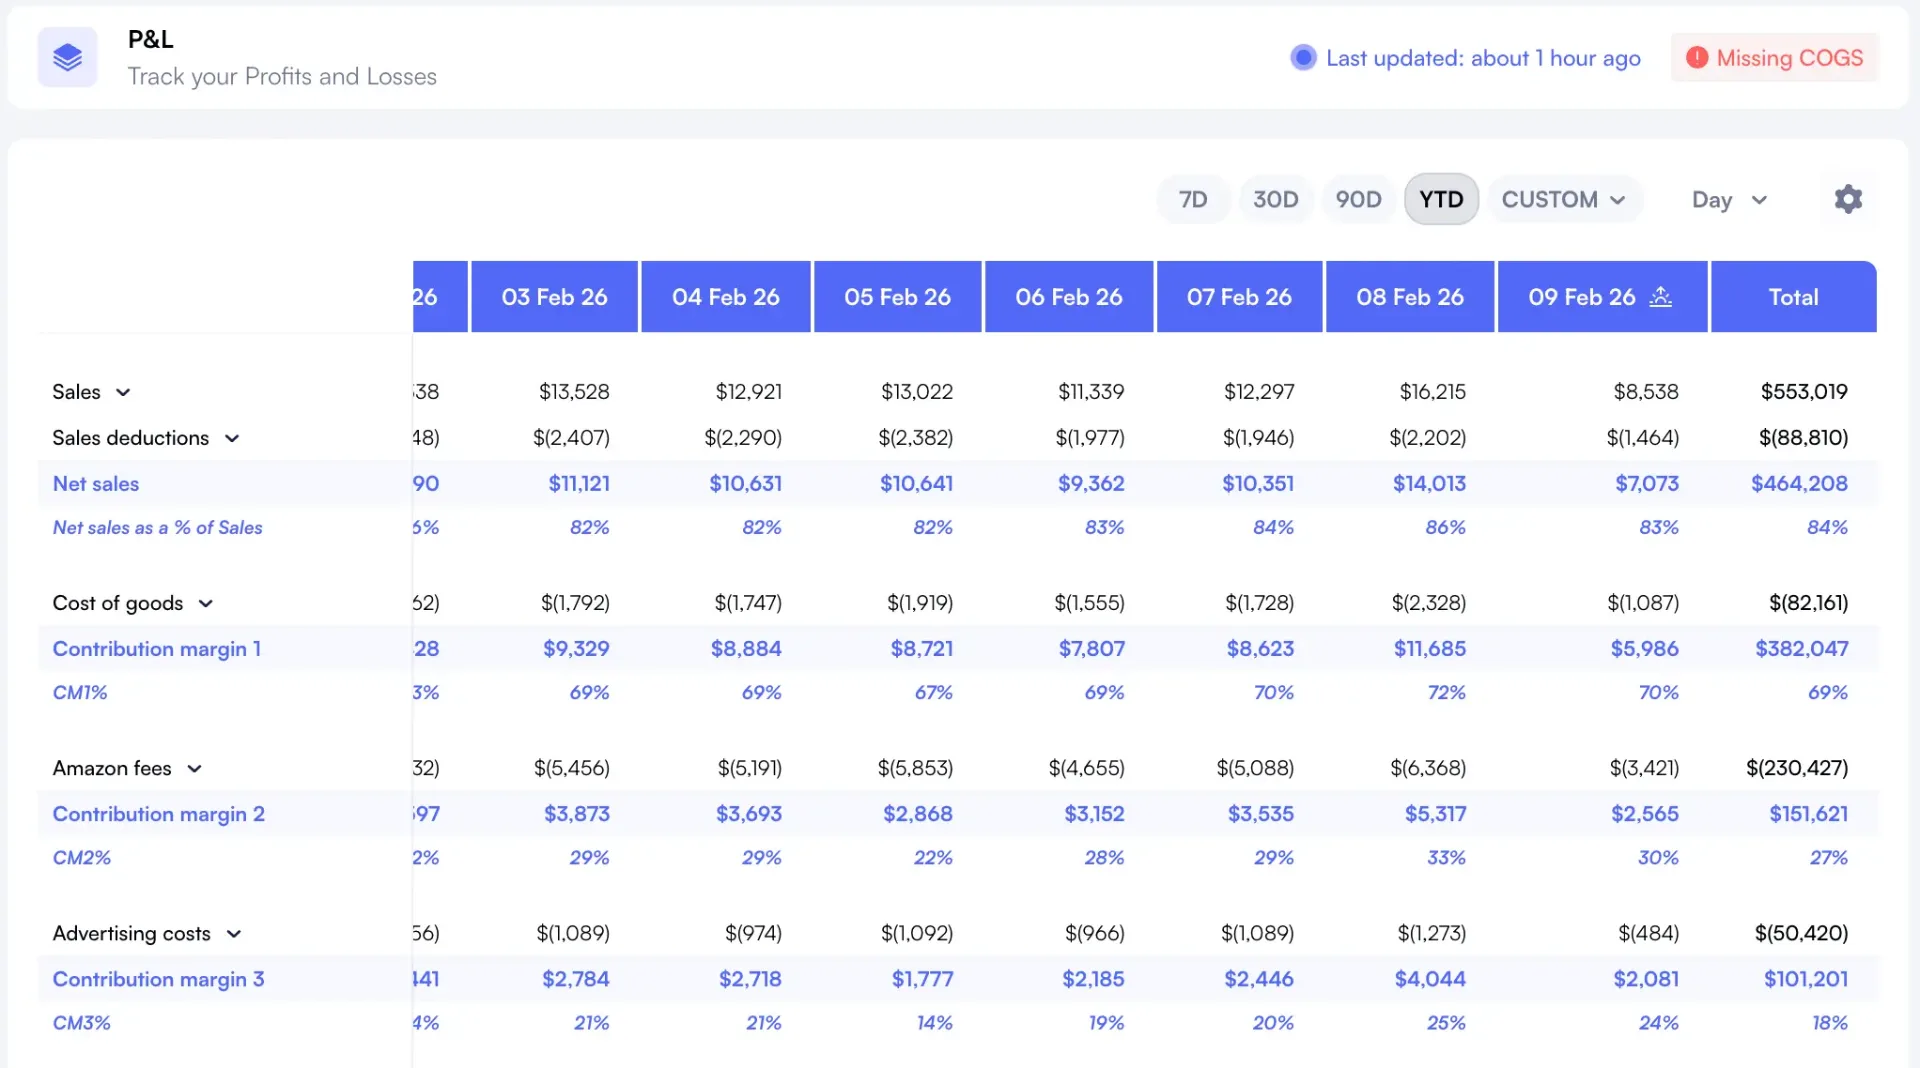
P&L dashboard with accurate contribution margins powered by SKU-level COGS
Handling Variants, Bundles, and Multi-Packs
Simple single-SKU products are straightforward. Complexity emerges with variations and bundles.
Variant Products (Size/Color)
Each variant often has different costs. A large size uses more material than a small. A premium color requires more expensive dye. Track each variant's actual cost, not the parent ASIN average.
Variant
Product Cost
Extra Packaging
Landed Cost
Small - Black
$8.00
$0.50
$11.80
Large - Black
$12.00
$0.80
$16.40
Small - Premium Blue
$9.50
$0.50
$13.30
Large - Premium Blue
$14.25
$0.80
$18.65
Bundle Products
A bundle's COGS equals the sum of its component costs plus any additional packaging or assembly labor. If you sell products individually AND as bundles, you need separate COGS entries for each listing.
Multi-packs are simpler: multiply the single-unit cost by quantity, then add multi-pack specific packaging. A 3-pack isn't always 3x the single-unit cost because of packaging efficiencies.
COGS Update Workflows: When to Refresh
Costs change. Suppliers raise prices, shipping rates fluctuate, currency moves. You need a system for keeping COGS current without constant busywork.
Update Trigger
Frequency
Action
New Inventory Arrival
Per shipment
Calculate new landed cost, update with effective date
Supplier Price Change
When notified
Add new cost entry for future inventory
Currency Fluctuation (5%+)
Quarterly review
Recalculate landed costs for major moves
Shipping Rate Changes
Annually or per contract
Update freight allocation component
Period-Based Cost Tracking
Nova's COGS manager supports period-based pricing. Enter the old cost with an end date, then the new cost with a start date. The system automatically uses the correct cost for each sale based on when it occurred. No need to overwrite historical data.
Using COGS Data to Identify Margin Compression
With accurate per-SKU costs, you can spot margin problems before they become crises. Here's what to monitor:
Contribution Margin by SKU
Sort your catalog by contribution margin (CM1 = Revenue - COGS - Amazon Fees). Products below your target threshold need attention: pricing adjustment, cost renegotiation, or discontinuation evaluation.
Margin Trend Over Time
Compare current margins to 90-day and 180-day averages. Declining trends indicate creeping cost increases or price competition eroding your position.
Cost vs. Revenue Velocity
High-volume products with thin margins can still be profitable. Low-volume products with thin margins are dangerous. Plot each SKU on a volume/margin matrix to prioritize attention.
Scale These Products
High margin + high volume: Stars
High margin + low volume: Potential winners, needs traffic
Investigate These Products
Low margin + high volume: Cash traps (lots of work, little profit)
Low margin + low volume: Candidates for discontinuation
COGS Optimization Strategies
Once you have accurate per-SKU costs, you can systematically reduce them:
Supplier Negotiation with Data
Armed with exact landed costs and margin data, approach suppliers with specific asks. "We need a 5% reduction to maintain viability on this SKU" is stronger than "Can you lower prices?"
Shipping Mode Optimization
Compare air vs. Sea freight impact on landed cost. For high-velocity products, the cash flow cost of 4-week ocean shipping might exceed the savings. For slow movers, air freight destroys margins.
Duty Classification Review
Customs classification errors are common. A 5% duty rate difference on a high-volume product adds up. Review HTS codes with a customs broker annually.
Pro Tip: Track COGS as Percentage of Revenue
COGS as a percentage of revenue (cost ratio) is often more actionable than absolute dollars. If your cost ratio creeps from 35% to 38%, you know margin is compressing even if dollar costs look stable. This happens when you discount prices without adjusting cost expectations.