Amazon Catalog Profit Optimization
The average 1,000-SKU seller has 200+ products losing money after all fees. Use the 4-Quadrant SKU Analysis to find the 20% of products driving 80% of profit.
 Claude
The average 1,000-SKU seller has 200+ products losing money after all fees. They just don't know which ones. Revenue reports show a healthy business. Profit reports, when you can actually build them, tell a very different story. Built from the patterns we see in agency rollups, not from a survey or a benchmark report.
This isn't about bad products. It's about visibility. Amazon charges 40+ different fee types, and most sellers track fewer than 10 of them. Referral fees and FBA fulfillment are obvious. But aged inventory surcharges, low-level inventory fees, disposal fees, long-term storage penalties, and return processing charges quietly erode margins on products that look profitable on the surface.
This guide walks through a systematic approach to catalog profit optimization. You'll learn the 4-Quadrant SKU Analysis framework, how to find hidden winners buried in your mid-catalog, and the monthly review process that turns gut-feel decisions into data-driven portfolio management.
TL;DR - Key Takeaways
- •The average 1,000-SKU seller has 200+ products losing money after all fees. The problem is knowing which ones.
- •Use the 4-Quadrant SKU Analysis (Stars, Cash Cows, Question Marks, Dogs) to classify every product by margin and velocity.
- •Hidden winners are products with high organic sales ratios, improving margin trends, or seasonal strength that gets buried in annual averages.
- •A monthly catalog review using Nova's Custom P&L and contribution margin tools turns gut-feel decisions into data-driven portfolio management.
The Pareto Problem at Scale
You've heard the 80/20 rule. For most large Amazon catalogs, it's actually 90/10. Ten percent of your SKUs drive 90% of your profit. The other 90% of your catalog ranges from marginally profitable to actively losing money.
Here's why this happens. When a seller has 50 products, they know each one intimately: the margins, the ad dependency, the seasonal patterns. At 500 products, that intimate knowledge disappears. Products get launched, they sell "okay," and nobody revisits whether they're actually earning their shelf space.
Profit Concentration
90/10
10% of SKUs drive 90% of profit in most large catalogs
Hidden Fee Types
40+
Amazon fee types most sellers don't fully track
Typical Unprofitable SKUs
15-25%
Of catalog operating at negative contribution margin
The Zombie SKU Problem
The most dangerous products in your catalog aren't the obvious losers. They're the zombies: products that sell just enough to seem alive but quietly drain capital. A zombie SKU might sell 5-10 units per month, generating $200 in revenue. Looks fine in a revenue report. But when you add up FBA storage fees, the occasional return, and the ad spend required to maintain those few sales, the product is costing you $50-100 per month in negative margin.
Multiply that by 50-100 zombie SKUs (common in a 500+ product catalog), and you're hemorrhaging $2,500-10,000 per month in invisible losses. That capital could be redirected to scaling your actual winners.
Hidden Fee Structures at Scale
Certain Amazon fees only become meaningful at scale:
- Aged inventory surcharges: Products sitting in FBA warehouses over 181 days face escalating penalties. At 500+ ASINs, some products inevitably age out, especially seasonal items or slow movers.
- Low-level inventory fees: Amazon penalizes products that maintain less than 28 days of supply. Ironic, since they also penalize excess inventory.
- Return processing fees: Categories with high return rates (apparel, electronics) face significant per-unit processing charges that compound with volume.
- Disposal and removal fees: when you finally decide to clear zombie inventory, you pay for that too.
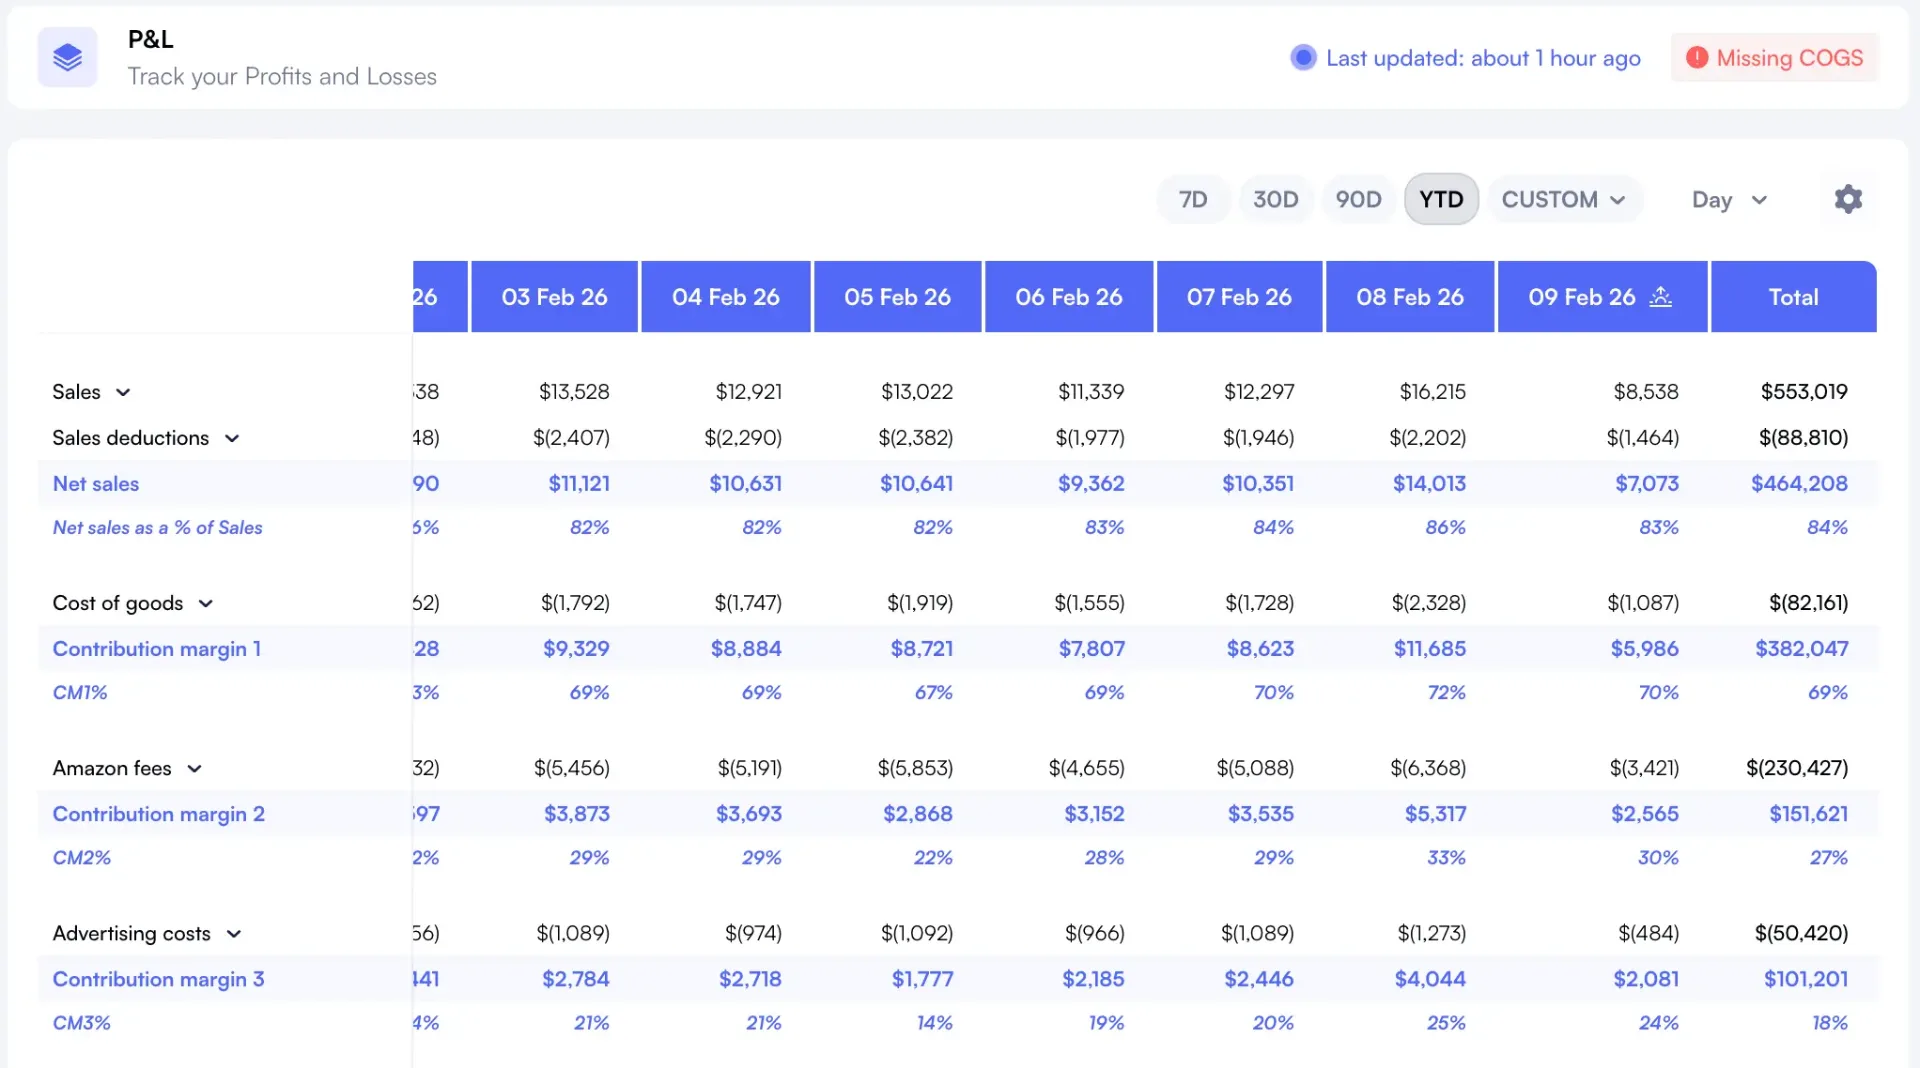
Without a per-SKU P&L dashboard that captures all these fee types, you're flying blind on true profitability.
The 4-Quadrant SKU Analysis
The BCG Matrix (originally designed for corporate portfolio strategy) adapts perfectly to Amazon catalog analysis. Map every SKU on two axes: contribution margin (vertical) and sales velocity (horizontal). This creates four quadrants with clear strategic implications.
| Quadrant | Definition | Strategy | Typical % of Catalog |
|---|---|---|---|
| Stars | High margin + high velocity | Protect and expand. Increase inventory depth, test higher prices, defend organic rank. | 10-15% |
| Cash Cows | High margin + low velocity | Maintain with minimal effort. Reduce ad spend, optimize for organic. These generate steady profit with low attention cost. | 15-25% |
| Question Marks | Low margin + high velocity | Fix or cut. These sell well but don't make money. Test price increases, renegotiate supplier costs, or reduce ad dependency. | 20-30% |
| Dogs | Low margin + low velocity | Liquidate or remove. Stop spending on products that neither sell nor profit. Redirect capital to Stars and Question Marks. | 30-50% |
The power of this framework is speed. Instead of evaluating 500 products individually, you classify them into four buckets and apply bucket-level strategies. Nova's P&L dashboard lets you sort by contribution margin and units sold, making quadrant classification a 30-minute exercise instead of a day-long spreadsheet project.
Finding Hidden Winners
The 4-Quadrant analysis identifies your Stars. But some of the most valuable products in your catalog are hidden, buried in the middle where they don't attract attention because they're neither top sellers nor obvious losers. Here's where to look.
Products with High Organic Sales Ratios
A product where 80% of sales come from organic traffic is structurally more profitable than one where 60% of sales depend on ads. Even if both show the same contribution margin today, the high-organic product has a buffer: you can cut ad spend without killing sales.
Use Nova's Winners and Losers View to identify products where organic share is increasing over time. These are products gaining organic rank, which means their profitability will improve as ad dependency decreases. For a deeper dive on this metric, see our organic vs. PPC sales tracking guide.
Products with Improving Margin Trends
A product with 12% contribution margin today might seem mediocre. But if it was 8% three months ago and 10% last month, the trend matters more than the snapshot. This usually signals one of three things: a supplier cost reduction flowing through, declining ad costs as organic rank improves, or a price increase that customers accepted.
Monitor contribution margin trends at the segment level using Custom Breakdowns. A segment with consistently improving margins deserves more investment, even if absolute margins aren't stellar yet.
Seasonal Performers Hidden in Annual Averages
Annual averages are dangerous for seasonal products. A garden tool that generates 60% of its revenue in March through June will look like a mediocre performer when you average across 12 months. But during its peak season, it might be your highest-margin product. The reverse is also true: a product that looks decent on an annual basis might actually lose money for 8 months of the year, offset by a strong holiday season.
Analyze profitability on a rolling 90-day basis in addition to annual views. This reveals the true seasonal profile of each product and helps you make smarter inventory planning decisions.
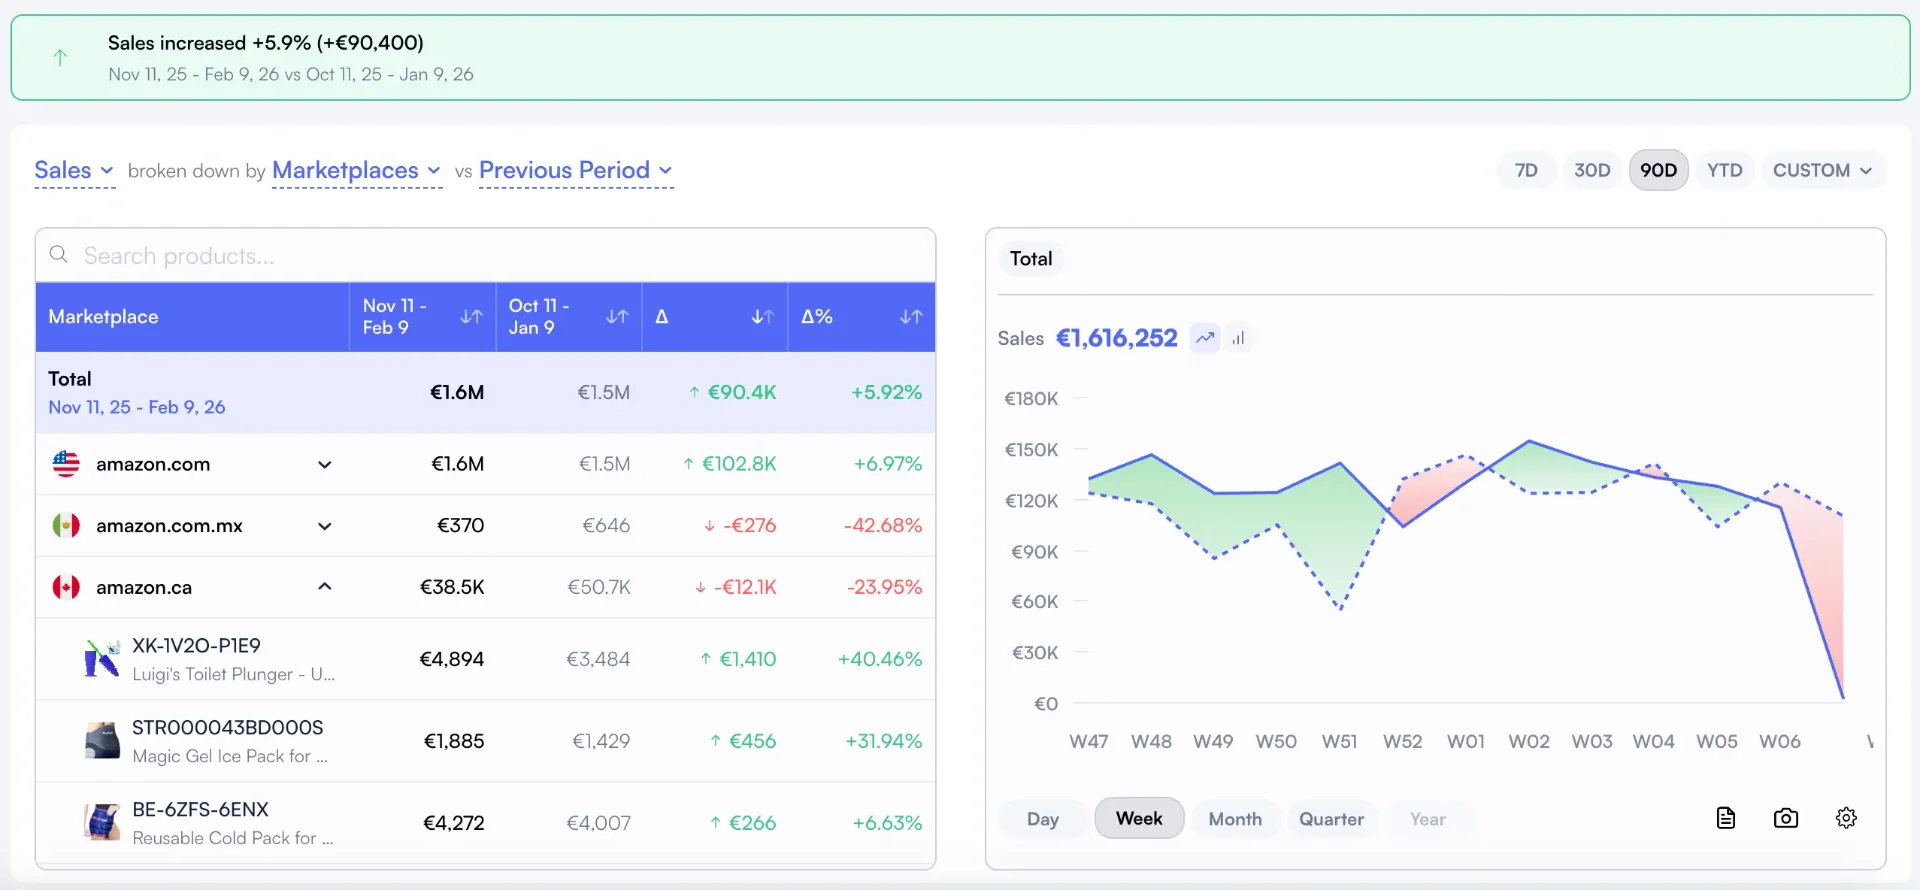
Cross-Marketplace Winners
A product that's a Dog in the US marketplace might be a Star in Germany or Japan. Fee structures, competition levels, and consumer preferences vary dramatically by marketplace. If you're selling across regions, run the 4-Quadrant analysis separately for each marketplace before making kill decisions.
For more on cross-marketplace analytics, see our guide on unified cross-marketplace reporting.
The Monthly Catalog Review Process
Here's the step-by-step process for a monthly catalog review using Nova's analytics tools. Block 2 hours per month for catalogs up to 500 SKUs, 3-4 hours for 1,000+.
Step 1: Pull Your Full-Catalog P&L (10 Minutes)
Open Nova's Custom P&L and select the last 30 days. Sort by contribution margin, ascending. Your worst performers are now at the top. Scan the bottom 20% for products that have been negative for 3+ consecutive months.
Step 2: Classify into Quadrants (20 Minutes)
Using contribution margin and units sold, classify your products into Stars, Cash Cows, Question Marks, and Dogs. You don't need to do this for every product. Focus on any product that moved quadrants since last month. A Star that became a Question Mark needs immediate attention.
Step 3: Analyze Your Question Marks (30 Minutes)
This is where you spend the most time. Question Marks (high velocity, low margin) are your biggest opportunity. For each one, determine the root cause of low margin:
- Ad dependency too high? Check TACoS trend. If organic share is increasing, hold steady. If declining, the product may be losing organic rank.
- COGS too high? Check your COGS tracking for recent supplier cost changes.
- Return rate elevated? High returns eat margin directly. Review listing accuracy, product quality, and customer feedback.
- Fee structure unfavorable? Some products sit in the worst referral fee brackets or face category-specific charges.
Step 4: Make Kill/Grow Decisions (30 Minutes)
Apply the decision tree to products in the Dogs quadrant:
- Kill If: negative margin for 3+ months, no parent ASIN halo effect, no seasonal justification, fewer than 10 units/month
- Fix If: margin was positive in the last 6 months (it's declining, not permanently broken), the product has strategic value (completes a line, drives storefront traffic)
- Grow If: margin is positive and improving, organic share is increasing, there's room for price optimization
For a detailed decision framework, see our SKU rationalization guide.
Step 5: Review Segment-Level Trends (30 Minutes)
Zoom out to your Custom Breakdowns and review trends at the segment level. Are your launch products reaching profitability within the expected timeline? Is a particular supplier's margin declining across all their products (signaling a cost negotiation opportunity)? Is one brand outperforming the rest?
This segment-level view is where strategic insights emerge. Individual product analysis tells you "Product X is underperforming." Segment analysis tells you "Our premium-tier products across all brands are losing margin because of competitor price erosion in that tier."
Case Example: 800-SKU Home Goods Seller
How a Home Goods Seller Cut 120 Products and Increased Net Profit by 28%
A home goods brand (anonymized) managing 800 SKUs across US and EU marketplaces ran their first full 4-Quadrant analysis using Nova's P&L dashboard. The findings reshaped their entire product strategy.
Before (Annual)
- 800 active SKUs
- $4.2M revenue
- $380K net profit (9.0% margin)
- ~180 SKUs at negative margin
After (6 Months Later)
- 680 active SKUs (120 removed)
- $3.9M revenue (7% lower)
- $487K net profit (12.5% margin)
- Net profit up 28% despite lower revenue
Key actions: removed 120 Dogs (mostly slow-moving variants and aged seasonal items), renegotiated COGS on 35 Question Marks, and shifted ad budget from low-organic-share products to Stars with proven organic traction. Revenue dropped 7%, but net profit increased 28% because they stopped subsidizing losing products.
The lesson here is counterintuitive: sometimes the fastest path to higher profit is selling fewer products. But you can only make that decision with data. Without per-SKU contribution margin, you're guessing which products to cut.
Frequently Asked Questions
Catalog Profit Optimization FAQ
Common questions about finding and fixing unprofitable Amazon products
Sources and References
- 1 Corporate Finance Institute, "Contribution Margin Overview," 2024. View source
- 2 McKinsey & Company, "Turning Pricing Power into Profit," 2024. View source
- 3 Harvard Business Review, "A Quick Guide to Value-Based Pricing," 2016. View source
- 4 Marketplace Pulse, "Long-Time Sellers Drive Half of Amazon's 3P GMV," 2024. View source
- 5 Practical Ecommerce, "Amid FBA Fee Hikes, Sellers Consider Alternatives," 2022. View source
- 6 Statista, "Third-party seller share of Amazon platform," 2024. View source
- 7 Digital Commerce 360, "Amazon marketplace seller statistics," 2024. View source
Ready to Transform Your Amazon Business?
Join thousands of successful sellers who use Nova Analytics to make data-driven decisions and maximize their profits.
Continue Learning
Explore more expert insights to grow your Amazon business
Amazon Contribution Margin Calculator
Gross profit tells you if a product is viable. Contribution margin tells you if it's worth your time. Learn how to calculate CM1, CM2, and CM3 for Amazon products with category benchmarks and strategic applications.
Contribution Margin Optimization
Knowing your CM1, CM2, and CM3 is step one. Using that data to make better pricing, advertising, and portfolio decisions is where profits come from. Learn the decision frameworks top sellers use.
Ecommerce Profit Analytics: Why Amazon Is Your Blind Spot
Ecommerce teams track Shopify margins in 2 clicks. Amazon's 40+ fee types make profit invisible. Learn how to close the visibility gap and stop flying blind on your biggest channel.